GOOGL - DSTL Efficiently Combines Value And Quality Styles
2023-03-07 12:13:17 ET
Summary
- Distillate Fundamental Stability & Value ETF selects and weights stocks based on cash flow, stability and debt.
- About one-third of asset value is in technology.
- The fund looks attractive regarding both valuation and quality metrics.
- It has beaten the S&P 500, the S&P 500 Value Index, and the S&P 500 Quality Index since inception.
This ETF (exchange-traded fund) article series aims at evaluating products regarding the relative past performance of their strategies and current portfolios. As holdings and weights change over time, updated reviews are posted when necessary.
DSTL strategy and portfolio
The Distillate Fundamental Stability & Value ETF (DSTL) has been tracking the Distillate U.S. Fundamental Stability & Value Index since October 2018. It has 100 holdings, a 12-month distribution rate of 1.27% an expense ratio of 0.39%.
As described in the prospectus by Distillate Funds , eligible companies must be in the 500 largest U.S.-listed companies in free-float market capitalization and have:
- at least 5 years of cash flow data,
- a net profit in at least one of the last three fiscal years,
- headquarters in the U.S. or Ireland,
- an average daily traded value of $ 50 million in the last 30 days.
Then, proprietary metrics are used to filter out companies with excessive debt, high volatility of cash flow, low free cash flow to enterprise value to finally keep 100 companies. Constituents are weighted by two-thirds of equal weight plus one-third of a normalized cash flow metric. The underlying index is reconstituted quarterly. The turnover is quite high (78% of asset value in the last fiscal year).
The current portfolio is almost exclusively in U.S. companies: Ireland represents less than 1% of asset value. About 55% is in the large cap segment, 44% in mid-caps, and less than 1% in small caps (according to Fidelity).
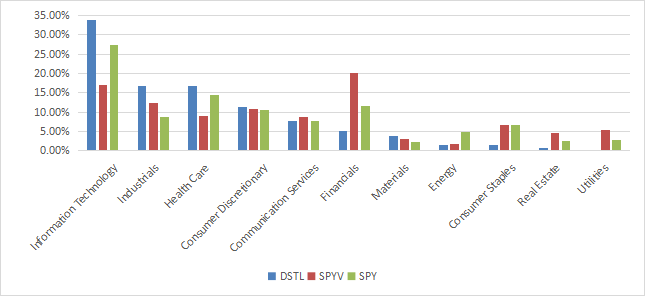
The heaviest sector is information technology, by far (about 34%). Industrials and healthcare are almost tie (about 17%). Then, come consumer discretionary (11.5%). Other sectors are below 8% individually and 21% in aggregate. Compared to the large cap benchmark S&P 500 ( SPY ) and to the S&P 500 Value Index ( SPYV ) , the fund overweights technology, industrials, healthcare and materials. It underweights financials, consumer staples, real estate and ignores utilities.
Sector breakdown ( Chart: author: data: SSGA, Fidelity)
The fund's aggregate price/earnings, price/sales and price/cash flow ratios are materially cheaper than for SPY and SPYV. The price-to-book ratio is more expensive than for SPYV. It can be explained by the much lower weight of financials, characterized by a low average price/book (1.6). The table below reports ratios for the 3 funds.
| ILCV |
| SPYV |
| SPY |
| Price/Earnings TTM |
| 17.63 |
| 19.7 |
| 20.33 |
| Price/Book |
| 3.67 |
| 2.62 |
| 3.76 |
| Price/Sales |
| 1.68 |
| 1.86 |
| 2.38 |
| Price/Cash Flow |
| 12.5 |
| 14.1 |
| 15.08 |
Source: Fidelity.
The top 10 holdings, listed below with valuation ratios, represent 22.3% of asset value. Apple and Alphabet are in a 4-5% range. Risks related to other individual companies are low.
| Ticker |
| Name |
| Weight (%) |
| P/E TTM |
| P/E fwd |
| P/Sales TTM |
| P/Net Free Cash Flow |
| Yield% |
| Apple, Inc. |
| 4.40% |
| 25.66 |
| 25.26 |
| 6.22 |
| 42.48 |
| 29.17 |
| Alphabet, Inc. |
| 4.02% |
| 20.87 |
| 18.17 |
| 4.32 |
| 4.73 |
| 20.20 |
| Visa, Inc. |
| 1.98% |
| 31.93 |
| 26.45 |
| 15.58 |
| 13.46 |
| 32.66 |
| Broadcom, Inc. |
| 1.96% |
| 21.50 |
| 15.28 |
| 7.89 |
| 11.65 |
| 28.08 |
| AbbVie, Inc. |
| 1.89% |
| 23.53 |
| 14.09 |
| 4.78 |
| 16.08 |
| 19.53 |
| Johnson & Johnson |
| 1.78% |
| 22.86 |
| 14.65 |
| 4.30 |
| 5.31 |
| 74.17 |
| UnitedHealth Group, Inc. |
| 1.70% |
| 22.59 |
| 19.20 |
| 1.40 |
| 5.83 |
| 26.03 |
| Cisco Systems, Inc. |
| 1.54% |
| 18.03 |
| 13.13 |
| 3.82 |
| 4.89 |
| 22.03 |
| The Home Depot, Inc. |
| 1.54% |
| 17.89 |
| 18.84 |
| 1.93 |
| 194.51 |
| 81.96 |
| Comcast Corp. |
| 1.52% |
| 31.27 |
| 10.21 |
| 1.32 |
| 1.97 |
| 20.20 |
Scanning portfolio quality
Six holdings are risky regarding my preferred quality metrics. These are companies with at least two red flags among: negative ROA (return-on-assets), bad Piotroski score, bad Altman Z-score, unsustainable payout ratio, excluding financials and real estate, where these metrics are unreliable. Risky stocks weigh less than 5% of the portfolio, which is a good point. The weighted Altman Z-score, Piotroski F-score and ROA are significantly better than for the S&P 500 (see next table).
| DSTL |
| SPY |
| Altman Z-score |
| 4.42 |
| 3.41 |
| Piotroski F-score |
| 6.07 |
| 5.5 |
| ROA % TTM |
| 11.11 |
| 7.5 |
These metrics point to a portfolio quality superior to the benchmark.
Historical performance
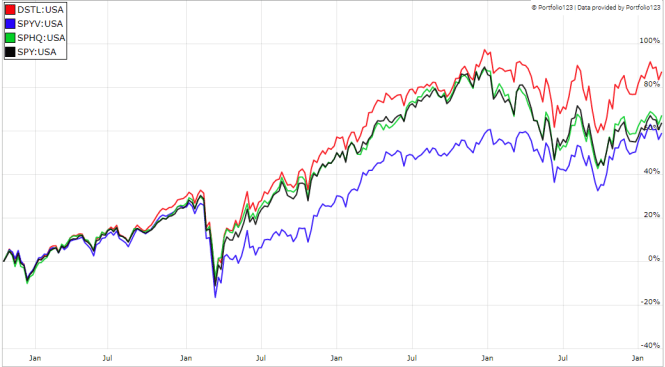
As DSTL is a value and quality fund, the next table compares it since inception (10/23/2018) with the SPDR Portfolio S&P 500 Value ETF ( SPYV ) and the Invesco S&P 500 Quality ETF (SPHQ). It outperforms them by over 3 percentage points in annualized return. The risk measured in maximum drawdown and volatility (standard deviation of monthly returns) is similar.
| Total Return |
| Annual Return |
| Drawdown |
| Sharpe ratio |
| Volatility |
| DSTL |
| 85.78% |
| 15.31% |
| -33.10% |
| 0.71 |
| 19.78% |
| SPY |
| 62.28% |
| 11.78% |
| -33.72% |
| 0.57 |
| 19.50% |
| SPYV |
| 55.94% |
| 10.76% |
| -36.89% |
| 0.53 |
| 19.69% |
| SPHQ |
| 65.20% |
| 12.24% |
| -31.60% |
| 0.6 |
| 18.59% |
DSTL vs SPYV, SPHQ, SPY since inception (Portfolio123)
Takeaway
Distillate Fundamental Stability & Value ETF holds a portfolio of 100 large and mid-cap companies based on cash flow yield, its stability over time and debt. It is not only a value fund, but also a quality fund. The portfolio is superior to the S&P 500 in aggregate valuation and quality metrics. About one third of assets is in technology. Unlike most value funds, it underweights financials. Since its inception, DSTL has beaten not only the large cap benchmark S&P 500, but also the S&P 500 Value Index and the S&P 500 Quality Index by over 3 percentage points in annualized return, with similar risks in drawdown and volatility. The portfolio has a high turnover, which is not an issue when it comes with excess return. In conclusion, SPHQ price history is short, but promising.
For further details see:
DSTL Efficiently Combines Value And Quality Styles