XOM - DTD: Almost Identical To DLN And No Specific Edge
2023-09-11 00:14:10 ET
Summary
- WisdomTree Total U.S. Dividend Fund is a broad market ETF filtered by a risk score and weighted on expected dividends.
- This fund is almost identical to DLN in strategy and behavior.
- It is cheaper than the benchmark regarding valuation ratios and similar in quality.
- It has outperformed its most popular competitors in 2023, and the 10-year dividend growth rate beats inflation.
- Yet, it has lagged the S&P 500 since inception and SCHD in the last 10 years.
This article series aims at evaluating ETFs (exchange-traded funds) regarding past performance and portfolio metrics. Reviews with updated data are posted when necessary.
DTD strategy and portfolio
WisdomTree Total U.S. Dividend Fund (DTD) started investing operations on 06/16/2006 and tracks the WisdomTree U.S. Dividend Index. It has a portfolio of 817 stocks, a distribution yield of 2.71%, and a total expense ratio of 0.28%. Distributions are paid monthly.
As described by WisdomTree ,
The Index measures the performance of U.S. companies, listed on a U.S. stock exchange, that pay regular cash dividends and meet other liquidity and capitalization requirements established by WisdomTree. The index is dividend weighted at the annual reconstitution in December to reflect the proportionate share of the aggregate cash dividends each component company is projected to pay in the coming year .
Eligible companies must be incorporated and headquartered in the U.S., have a market capitalization of at least $100 million and a 3-month median daily dollar volume of at least $100,000. Limited Partnerships (in particular MLPs) and Business Development Companies are excluded. A risk score is calculated based on profitability metrics and momentum. Companies in the bottom decile are excluded, as well as those in the bottom half and in the top 5% in dividend yield. Constituents are weighted annually based on total dividends, which is in favor of mega-cap companies. Capping rules are applied to limit the weight of constituents and sectors.
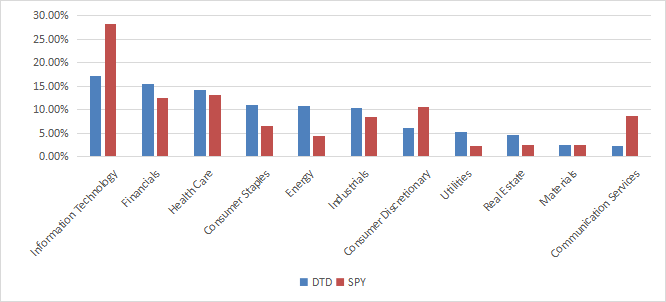
DTD invests mostly in large capitalization companies (71% of asset value). Information technology is the heaviest sector, but with a lower weight than in the S&P 500 ( SPY ): 17.1% vs. 28.2%. Compared to the large cap benchmark, DLN significantly overweights consumer staples, energy, utilities and real estate. It underweights technology, consumer discretionary and communication. As a result, the portfolio is more balanced across sectors than the S&P 500.
DTD sector breakdown (Chart: author; data: WisdomTree, SSGA)
The top 10 holdings, listed below with weights and fundamental ratios, represent 22.7% of asset value. The largest holding weighs 3.72%, so risks related to individual companies are moderate.
| Ticker |
| Name |
| Weight |
| EPS growth %TTM |
| P/E TTM |
| P/E fwd |
| Yield% |
| Microsoft Corp. |
| 3.72% |
| 0.42 |
| 34.07 |
| 30.02 |
| 0.82 |
| Apple, Inc. |
| 3.70% |
| -1.68 |
| 29.84 |
| 29.33 |
| 0.54 |
| Exxon Mobil Corp. |
| 3.35% |
| 36.57 |
| 9.11 |
| 12.41 |
| 3.19 |
| Chevron Corp. |
| 2.19% |
| 5.30 |
| 10.57 |
| 12.43 |
| 3.62 |
| AbbVie, Inc. |
| 1.98% |
| -31.10 |
| 30.58 |
| 13.48 |
| 3.98 |
| JPMorgan Chase & Co. |
| 1.78% |
| 24.77 |
| 9.24 |
| 9.06 |
| 2.78 |
| Merck & Co., Inc. |
| 1.52% |
| -81.42 |
| 88.89 |
| 35.80 |
| 2.71 |
| Broadcom Inc. |
| 1.50% |
| 41.21 |
| 26.45 |
| 20.35 |
| 2.15 |
| Cisco Systems, Inc. |
| 1.50% |
| 9.02 |
| 18.47 |
| 13.98 |
| 2.75 |
| Johnson & Johnson |
| 1.48% |
| -28.25 |
| 32.42 |
| 15.56 |
| 2.97 |
Historical performance
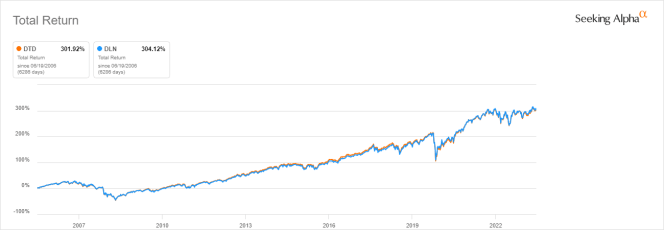
DTD is very close to DLN ( reviewed here ), another WisdomTree dividend fund. DLN selects 300 companies with larger capitalizations from DTD underlying index and slightly modifies the weighting methodology. DLN has more asset value and trading volumes. Their historical behaviors are almost identical:
DTD and DLN since inception (Seeking Alpha)
Since 7/1/2006, DTD has underperformed SPY and Vanguard dividend growth ETF ( VIG ) in total return and risk-adjusted performance (Sharpe ratio). It is ahead of SPDR S&P Dividend ETF ( SDY ).
| Total Return |
| Annual Return |
| Drawdown |
| Sharpe ratio |
| Volatility |
| DTD |
| 287.07% |
| 8.20% |
| -58.21% |
| 0.52 |
| 15.33% |
| SPY |
| 384.30% |
| 9.62% |
| -55.19% |
| 0.6 |
| 15.68% |
| VIG |
| 362.31% |
| 9.32% |
| -46.81% |
| 0.64 |
| 13.78% |
| SDY |
| 259.07% |
| 7.72% |
| -55.40% |
| 0.49 |
| 15.53% |
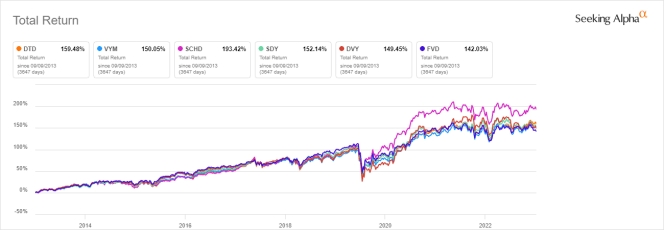
The next chart compares the 10-year total returns of DTD, SDY and four other popular dividend ETFs with yields between 2.5% and 4%:
- Vanguard High Dividend Yield Index ETF ( VYM )
- Schwab US Dividend Equity ETF ( SCHD )
- iShares Select Dividend ETF ( DVY )
- First Trust Value Line Dividend Index Fund ( FVD )
DTD is the second best performer after SCHD and shortly ahead of the other funds.
DTD vs. Competitors, last 10 years (Seeking Alpha)
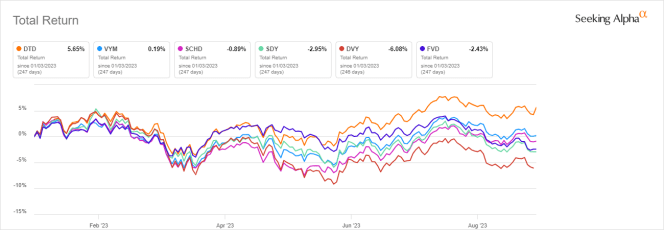
In 2023 to date, it is significantly ahead of the competition:
DTD vs. Competitors, year-to-date ( Seeking Alpha)
In previous articles, I have shown how three factors may help cut the risk in a dividend portfolio: Return on Assets , Piotroski F-score , and Altman Z-score .
The next table compares DTD since 7/1/2006 with a subset of the S&P 500: stocks with above-average dividend yield and ROA, good Altman Z-score and Piotroski F-score, and a sustainable payout ratio. It is rebalanced annually to make it comparable to a passive index.
| Total Return |
| Annual Return |
| Drawdown |
| Sharpe ratio |
| Volatility |
| DTD |
| 287.07% |
| 8.20% |
| -58.21% |
| 0.52 |
| 15.33% |
| Dividend quality subset |
| 510.43% |
| 11.10% |
| -43.59% |
| 0.69 |
| 15.59% |
Past performance is not a guarantee of future returns. Data Source: Portfolio123
The dividend quality subset beats DTD by about 3 percentage points in annualized total return and shows a lower risk in drawdown. However, the fund's performance is real, whereas the subset is simulated. My core portfolio holds 14 stocks selected in this subset (more info at the end of this post).
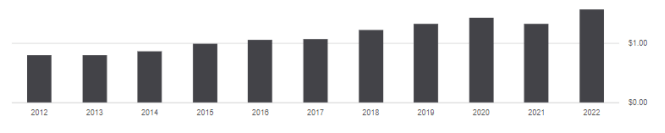
Annualized distributions have increased by 91.66% between 2012 and 2022, from $0.83 to $1.59 per share.
DTD distribution history (Seeking Alpha)
It beats the cumulative inflation (about 29%) by a wide margin, but it is far behind the 216% dividend growth of SCHD in the same time.
| DTD |
| VYM |
| SCHD |
| SDY |
| DVY |
| FVD |
| 2012 |
| 0.83 |
| 1.59 |
| 0.81 |
| 1.91 |
| 2.12 |
| 0.5 |
| 2022 |
| 1.59 |
| 3.25 |
| 2.56 |
| 3.2 |
| 4.14 |
| 0.83 |
| div. growth |
| 91.57% |
| 104.40% |
| 216.05% |
| 67.54% |
| 95.28% |
| 66.00% |
Scanning DTD portfolio
The portfolio is cheaper than the S&P 500 ( SPY ) regarding valuation ratios, as reported in the table below.
| DTD |
| SPY |
| Price/Earnings |
| 16.46 |
| 22.4 |
| Price/Book |
| 2.78 |
| 3.99 |
| Price/Sales |
| 1.85 |
| 2.55 |
| Price/Cash Flow |
| 11.5 |
| 15.81 |
DTD holds more than 800 stocks, but the top 400 represent 92% of the portfolio. I have scanned them with my quality metrics, considering that risky stocks are companies with at least 2 red flags among: bad Piotroski score, negative ROA, unsustainable payout ratio, bad or dubious Altman Z-score, excluding financials and real estate where these metrics are unreliable. With these assumptions, 37 of the top 400 holdings are risky. They weigh only 6.3% of asset value, which is a good point.
Based on my calculation, the fund's aggregate Altman Z-score, Piotroski F-score and ROA are a little bit above SPY's. These metrics point to a portfolio quality similar to the benchmark.
| DTD |
| SPY |
| Atman Z-score |
| 3.45 |
| 3.42 |
| Piotroski F-score |
| 6.12 |
| 5.58 |
| ROA % TTM |
| 8.71 |
| 7.61 |
Takeaway
WisdomTree Total U.S. Dividend Fund is a broad market dividend ETF with a large portfolio of 817 stocks. This fund is better diversified than the S&P 500 across sectors and holdings, but it still overweights large-cap companies due to its weighting methodology based on total dividends. It is cheaper than the benchmark regarding valuation ratios and similar in quality metrics. It has outperformed its most popular competitors in 2023 to date, and the 10-year dividend growth rate beats inflation. Nevertheless, it has underperformed the S&P 500 in total return since inception and SCHD in the last 10 years. It is not a "bad" fund, but as DLN has an almost identical strategy and track record, with more AUM and liquidity, there is no strong argument to choose DTD.
For further details see:
DTD: Almost Identical To DLN, And No Specific Edge