SPY - DURA: Expect This High-Quality 3.38% Yielding Dividend ETF To Outperform
2023-08-03 14:31:57 ET
Summary
- DURA features the rare combination of low-volatility, high dividends, and high quality. It competes well with SPHD and LVHD, and is a nice choice for defensive dividend investors.
- With an expected 3.38% yield, there are higher-paying options. Also, the ETF hasn't attracted new investors over the last six months, so it might not be the best long-term play.
- Still, I believe investors should begin considering low-volatility ETFs again since broad-market earnings revisions are trending downward. The bull market is finally losing steam.
- This article compares DURA's fundamentals alongside SPHD, LVHD, and SPY, and summarizes the latest semi-annual rebalancing that resulted in improved diversification.
Investment Thesis
Six months ago, I initiated coverage on the VanEck Morningstar Durable Dividend ETF ( DURA ), concluding that although low-volatility dividend ETFs likely wouldn't outperform again this year, it was a better choice compared to more popular peers like the Invesco S&P 500 High Dividend Low Volatility ETF ( SPHD ) and the Franklin U.S. Low Volatility High Dividend Index ETF ( LVHD ). While that prediction largely came true, the purpose of this article is to evaluate DURA's fundamentals alongside SPHD and LVHD and to consider if low-volatility ETFs are worth considering again. I think they are, and if you're looking to take some profits on the incredible gains put up by growth stocks this year, DURA is a reasonably safe and high-quality choice.
DURA Overview
Strategy Discussion
DURA tracks the Morningstar US Dividend Valuation Index , selecting constituents based on dividend yield, financial health, and valuation. Eligibility is based on three initial screens:
- The security must have paid a dividend over the last twelve months
- The security's dividend must be qualified income (e.g., no REITs)
- The security must have a fair value estimate assigned by Morningstar
Additional requirements include a dividend yield in the top 50% among all qualified dividend payers in the Morningstar US Market Index, a Distance to Default score in the top 50% of its peer group, and not being within the 30% most overvalued stocks, as measured by Morningstar's Star Score . For reference, the Distance to Default score measures financial stability using market data and financial reporting items, while the Star Score adjusts a company's price-to-fair value ratio by an uncertainty factor. Both scores are proprietary to Morningstar.
The number of securities selected at each semi-annual reconstitution in March and September is variable, constrained only by the eligibility criteria described above. The Index is dividend-dollar-weighted, where weight is based on the product of a company's dividend yield and shares outstanding. Finally, security weights are capped at 5%, and the ETF has a 0.29% expense ratio and $96 million in assets under management. The latter figure has been virtually unchanged since January, indicating the fund has not attracted new investors. This may concern you if you are looking for DURA to be a long-term holding.
Sector Exposures and Top Holdings
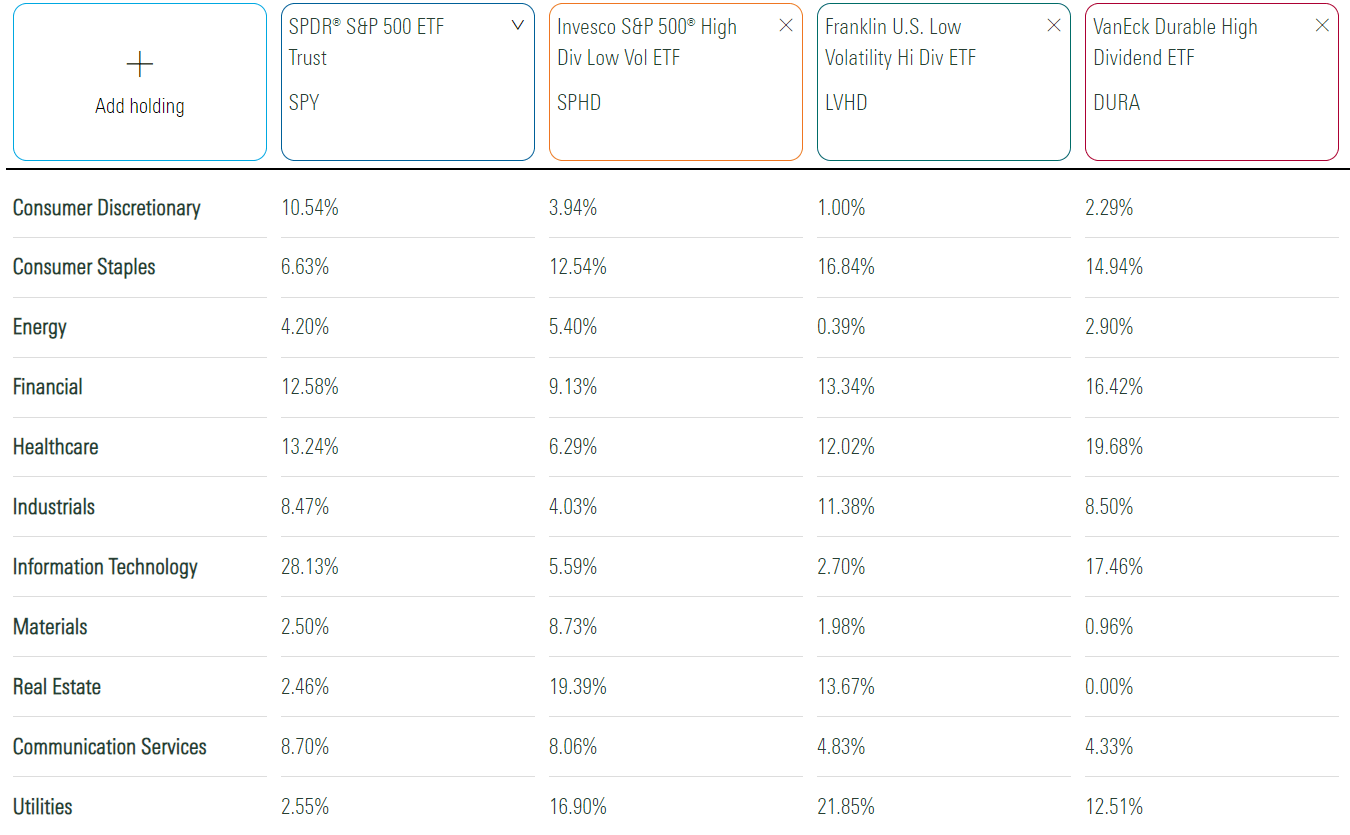
The following table highlights sector exposures for SPHD, LVHD, and DURA. I also included the SPDR S&P 500 ETF ( SPY ), which I'll use later to benchmark.
Morningstar
As discussed in my previous review, DURA differentiates itself from SPHD and LVHD with less exposure to the Utilities sector, a feature I preferred in January. The Utilities Select Sector SPDR ETF ( XLU ) is down 3.39% YTD through July and is the worst-performing large-cap sector. Meanwhile, Communication Services ( XLC ) and Technology ( XLK ) are the best, gaining 43.97% and 43.94%. In short, what worked in 2022 has yet to work in 2023.
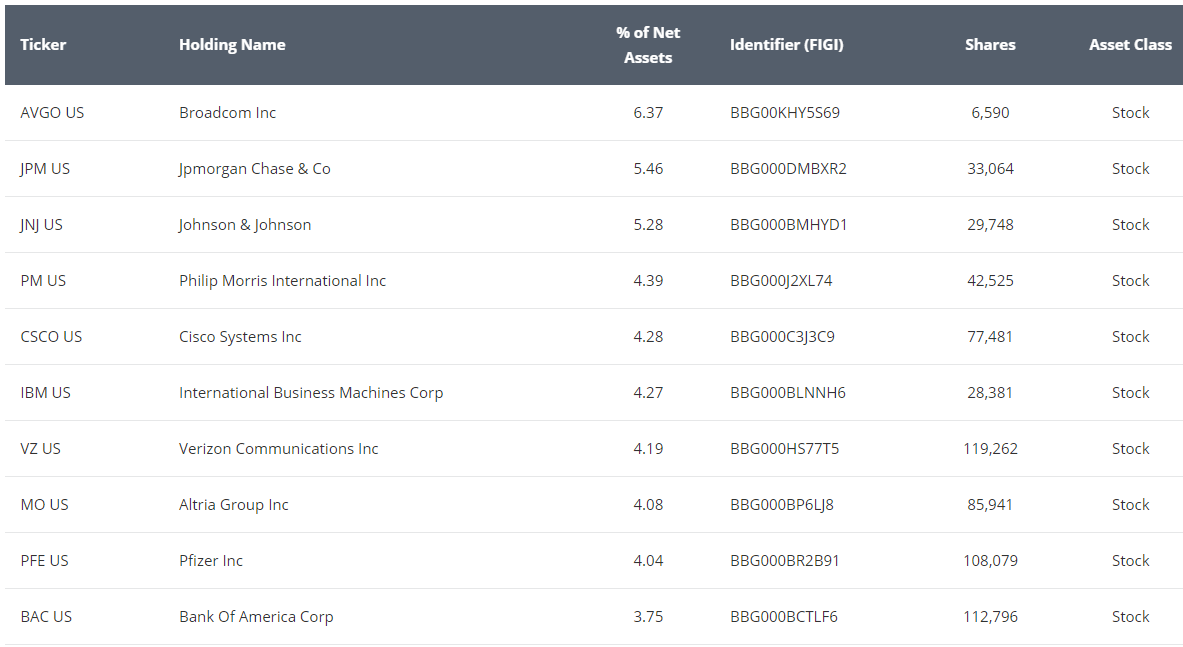
DURA also has no exposure to Real Estate securities. This limits dividend yield, but all of the dividend income is qualified. Still, DURA appears the least diversified at the sector level of the high-dividend ETFs. The same is valid at the company level, where the top ten account for 46% of the ETF.
VanEck
Broadcom ( AVGO ) is having a stellar year, up 64.54%, and is DURA's top holding. JPMorgan Chase ( JPM ) is up 17.21%, while Johnson & Johnson ( JNJ ) is down 4.39%. The industries these companies represent (Semiconductors, Diversified Banks, and Pharmaceuticals) also happen to be DURA's most influential, with weightings of 9.19%, 9.21%, and 9.33%, respectively. Therefore, they're a good representation of the ETF.
Portfolio Turnover
DURA had a 50% portfolio turnover rate last fiscal year. When its Index last reconstituted in March, it removed 16 stocks. I've listed them below alongside their weights as of January 29, 2023, totaling 21.94%.
- Merck & Co. ( MRK ): 5.72%
- Bristol-Myers Squibb ( BMY ): 3.74%
- Lockheed Martin ( LM ): 2.28%
- US Bancorp ( USB ): 2.07%
- Analog Devices ( ADI ): 1.38%
- Dominion Energy ( D ): 1.24%
- Illinois Tool Works ( ITW ): 1.22%
- Eaton Corp. ( ETN ): 1.13%
- Emerson Electric ( EMR ): 1.06%
- Allstate ( ALL ): 0.75%
- JM Smucker ( SJM ): 0.36%
- Skyworks Solutions ( SWKS ): 0.33%
- Janus Henderson Group ( JHG ): 0.22%
- Hubbell ( HUB B ): 0.19%
- National Instruments ( NATI ): 0.16%
- Federated Investors ( FHI ): 0.09%
The Index added 26 stocks with weights totaling 30.11% as of August 2, 2023, resulting in an increase of 10 holdings from 63 to 73.
- JPMorgan Chase ( JPM ): 5.46%
- Bank of America ( BAC ): 3.75%
- Abbott Laboratories ( ABT ): 2.40%
- Union Pacific ( UNP ): 2.34%
- Southern Co. ( SO ): 2.09%
- Duke Energy ( DUK ): 1.92%
- Raytheon Technologies ( RTX ): 1.87%
- Colgate-Palmolive ( CL ): 1.07%
- American Electric Power ( AEP ): 1.00%
- Sempra Energy ( SRE ): 0.92%
- Exelon Corp. ( EXC ): 0.88%
- Paychex ( PAYX ): 0.73%
- Sysco ( SYY ): 0.64%
- American International Group ( AIG ): 0.64%
- Bank of New York Mellon ( BK ): 0.62%
- WEC Energy Group ( WEC ): 0.60%
- DTE Energy ( DTE ): 0.47%
- PPL Corp. ( PPL ): 0.42%
- Ameren ( AEE ): 0.40%
- Evergy ( EVRG ): 0.35%
- CenterPoint Energy ( CNP ): 0.31%
- Garmin ( GRMN ): 0.31%
- Alliant Energy ( LNT ): 0.29%
- Broadridge Financial Solutions ( BR ): 0.24%
- OGE Energy ( OGE ): 0.21%
- Essential Utilities ( WTRG ): 0.17%
A total of 14 Utilities stocks were added, likely because they screened as undervalued. However, the total weight of the additions is just 10%. Remember that DURA is dividend-dollar-weighted, and most Utilities stocks are small in size, so they don't have as much influence as they would in SPHD, which is yield-weighted, and likely LVHD, which uses a proprietary scoring method based on a security's attractiveness on price and earnings volatility. Utilities rank well under such a method, which explains LVHD's 21.85% allocation to the sector.
Performance and Dividend Analysis
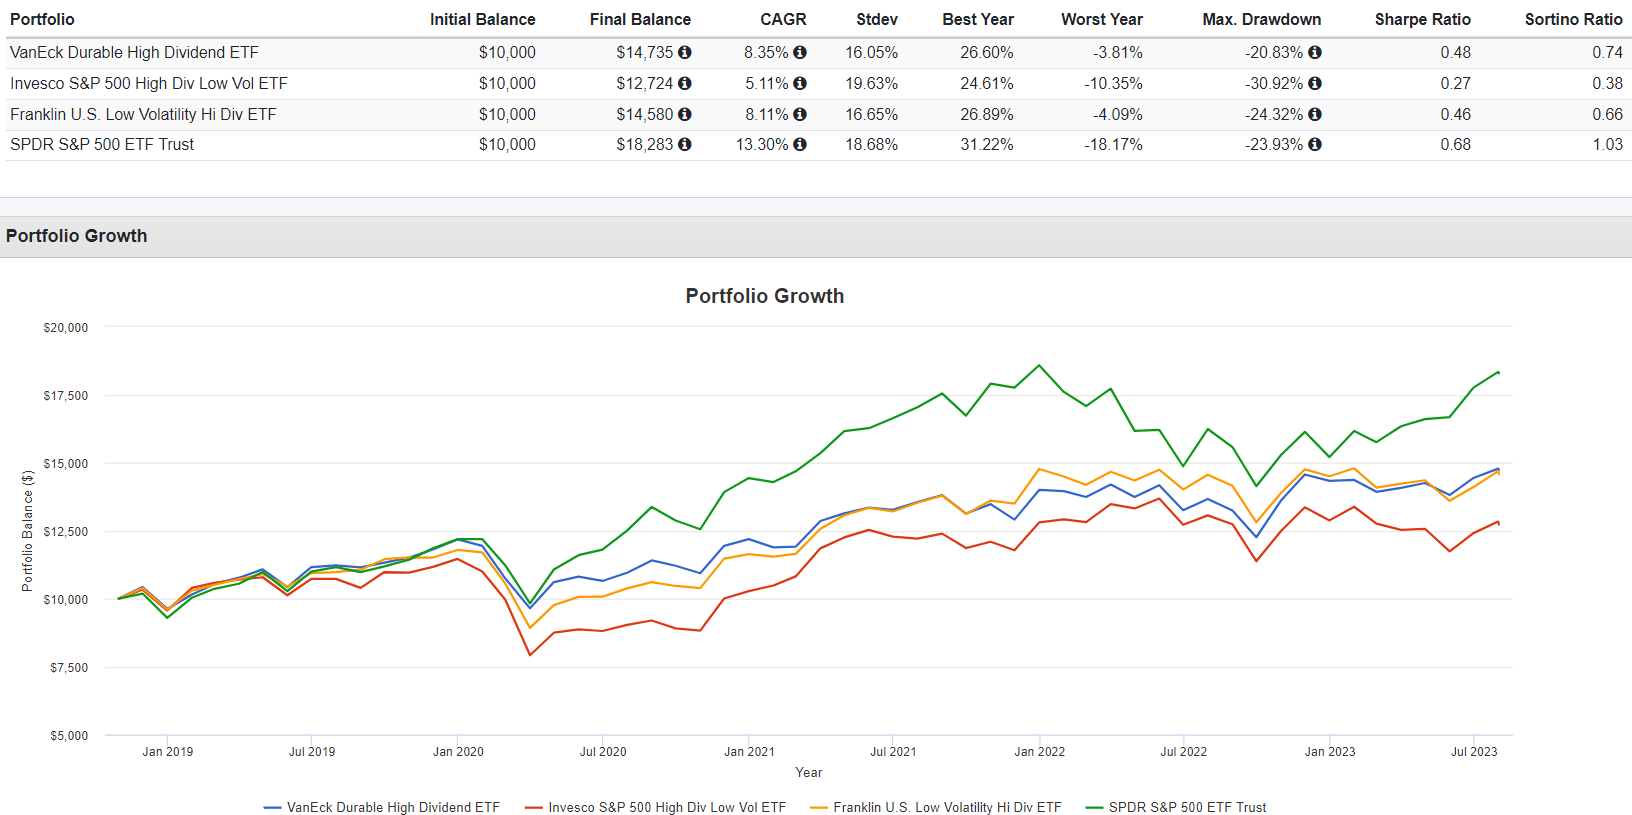
The following graph compares DURA's performance since its inception with SPHD, LVHD, and SPY. Apart from better returns vs. its direct competitors, notice how DURA's standard deviation and maximum drawdown figures are superior. This led to better risk-adjusted and downside risk-adjusted returns (Sharpe and Sortino Ratios), an essential goal for conservative investors.
Portfolio Visualizer
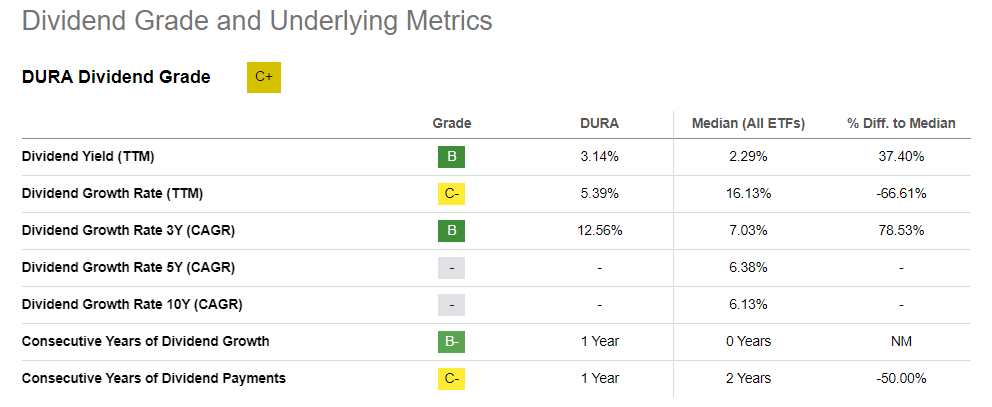
DURA's current dividend yield is 3.14% compared to 4.16% and 3.28% for SPHD and LVHD, so it may not satisfy your income needs. Due to its short track record, five- and ten-year dividend growth rates are unavailable, negatively impacting the "C+" Dividend Grade provided by Seeking Alpha. However, the constituents in January averaged an 8.70% five-year dividend growth rate; today, they average 8.20%.
Seeking Alpha
Predicting dividend growth for relatively new ETFs is challenging because a sharp increase in outstanding shares could dilute a quarter's dividend payment. Briefly, if an ETF has already collected all the distributions from the underlying holdings one month and won't pass those distributions (less expenses) onto its shareholders until later in the next month, then a spike in shares outstanding means more investors will have to share the same fixed distribution pot. It's not often an issue with established ETFs because the percentage change in shares outstanding is usually minor. However, new ETFs are prone to significant percentage changes. DURA experienced one last year, increasing shares outstanding by 18% from 2.08 million to 2.45 million from June 8 to June 15, resulting in an underwhelming July dividend payment. There is no impact from a total returns perspective, as the difference flows into the fund's NAV. However, it can be disappointing for income investors to see their dividend payments slashed for seemingly no good reason.
Seeking Alpha
DURA Fundamental Analysis
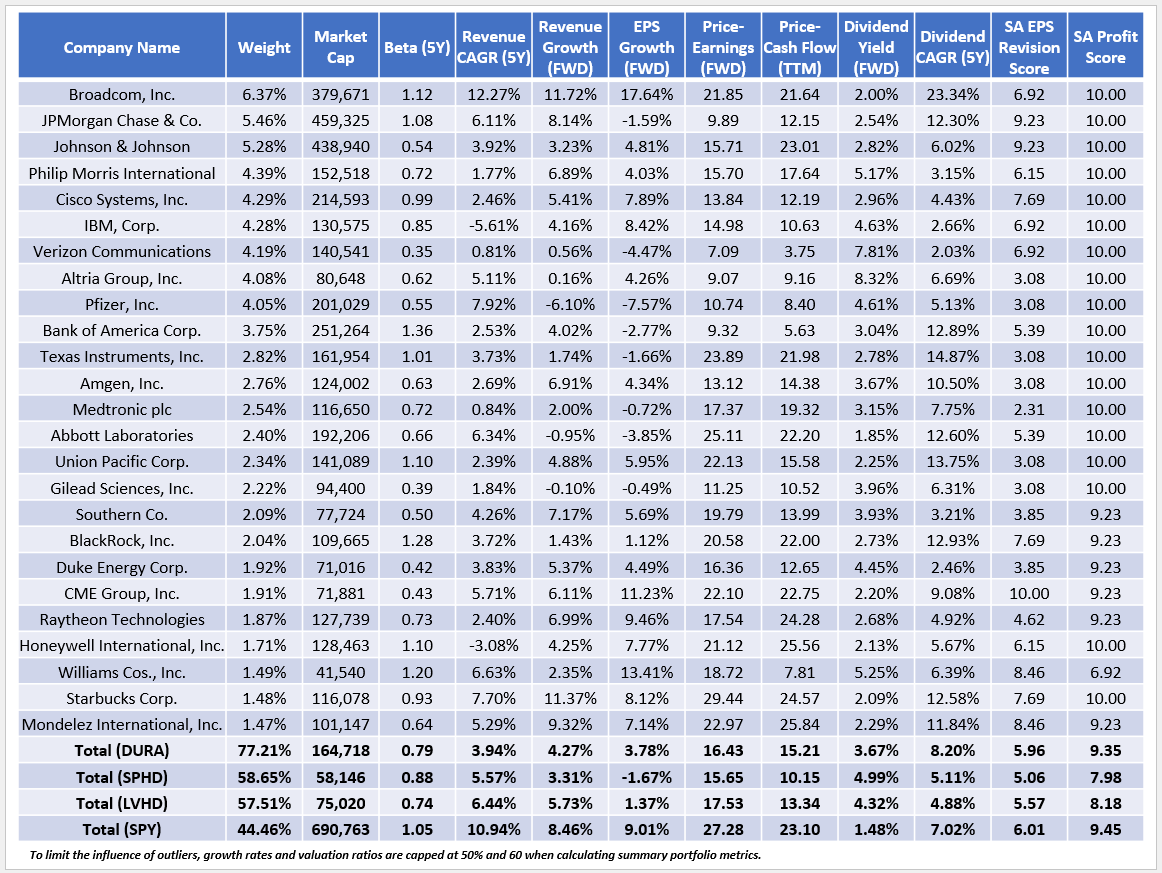
The following table highlights selected fundamental metrics for DURA's top 25 holdings, totaling 77.21% of the fund. I've also included summary metrics for SPHD, LVHD, and SPY in the bottom rows.
The Sunday Investor
DURA differentiates itself with a $165 billion weighted average market cap, 2-3x bigger than SPHD and LVHD. The 0.79 five-year beta is an attractive feature for defensive investors, and although it doesn't appear well-diversified at the company level, DURA allocates across 34 GICS industries vs. 23 and 34 for SPHD and LVHD. In addition, DURA has higher estimated EPS growth (3.78%) and trades at a comparable 16.43x forward earnings. Best of all, DURA's 9.35/10 Profit Score is unique among low-volatility ETFs. The median score is 8.32/10, and that's because most are overweight Utilities, which tend to earn low but stable returns.
DURA also has a solid 5.96/10 EPS Revision Score, substantially better than SPHD's 5.06/10 and a welcome reversal from January. I'm particularly interested in this metric because it's often a good gauge of market sentiment. SPY's spiked from 5.38/10 on April 11 to 6.09/10 on April 28 as the Q1 earnings season began. It peaked at 6.40/10 on May 30 but has since fallen to 6.09/10. This downward trend indicates a bull market losing steam, so it's prudent to consider low-volatility ETFs again. DURA is an excellent way to do this without sacrificing quality.
Finally, on dividends, DURA's constituents yield 3.67%. After adjusting for the fund's 0.29% expense ratio, the net yield should be approximately 3.38%, close to its trailing 3.14% yield. As mentioned, there hasn't been any growth in the last six months, so I expect shareholders to receive a boost when the ETF pays out next in early October.
Investment Recommendation
DURA is a low-volatility ETF expected to yield 3.38% and is a nice alternative to SPHD and LVHD, two popular but relatively low-quality dividend funds. I also expect good relative outperformance in the near term as earnings revisions and earnings surprises for the broader market trend downward. For these reasons, I've assigned a "buy" rating to DURA and will look to provide another update later this year.
For further details see:
DURA: Expect This High-Quality 3.38% Yielding Dividend ETF To Outperform