CA - Dynacor Group Is Strongly Poised For A Gold Bull Market
2023-06-15 18:20:55 ET
Summary
- Dynacor Group is a Canadian gold equivalent producer in Peru. The company produces gold from the mineral which it purchases from registered artisanal miners operating on the Tumipampa property.
- The company is well positioned based on the ongoing expansion of the facility's ore processing capacity and the rosy outlook for gold in the second half of 2023.
- However, the stock is not yet a buy, as its share price should continue to gain in attractiveness after July.
This analysis supports a Hold rating for Dynacor Group Inc. (DNG:CA) (DNGDF) stock and includes the possibility to buy some shares after the next month of July. This will be about the right time to strengthen a position in the company, as this analysis also suggests that a rise in the share price could follow another gold bull market should the latter event materialize sometime in the second half of 2023.
Rising expectations for gold prices are based on the trajectory of certain economic indicators (resilient core inflation on a monthly basis and unexpected rise in non-farm payrolls ) and how they may affect upcoming monetary policy from the Federal Reserve, whose interest rate decisions have recently dominated much of the sentiment around the precious metal.
Dynacor Group Inc is Expanding the Mill Capacity
Dynacor Group Inc. is engaged in the precious metals mining industry and owns the Tumipampa gold deposit, a 7,696-hectare mineral property in Peru. The company does not directly operate the gold deposit but obtains the mineral material from registered artisanal miners [ASM] that operate the deposit. This allows ASM to be more consistent with their mine material deliveries, which Dynacor Group Inc. then converts to gold at its Veta Dorada facility in Chala, Peru before selling the precious metal on the market. As a result of a project funded entirely from internally generated funds, the mill is now able to receive a larger and more stable supply of gold ore from the ASMs. The project started in the first quarter of 2021.
The Country Risk
Peru has friendly legislation towards mining activities as the country, which is among the richest in the world in terms of existing mineral resources, has an economy that largely depends on the export of the raw materials produced. The threat consists of geophysical issues such as seismic activity, which can sometimes cause business disruption if the country falls into the Pacific Ring of Fire. It is possible that the increase in the occurrence of extreme weather events due to climate change is leading analysts to assign a higher rating to the risk of geophysical events. According to global asset manager Sprott's 2023 mining risk heat map , Peru is at moderate risk.
The Operations at the Veta Dorada Facility
The Veta Dorada facility is currently processing over 460 tons of gold ore per day [tpd], compared to approximately 408 tpd being processed around this time in 2021, or compared to 326 tpd two years ago. This impressive improvement allowed the company to achieve a record 41,566 tons of gold ore which were processed by Veta Dorada in Q1 2023, representing a 13.3% year-on-year growth or a 41.7% increase vs. 29,327 tons of ore processed in the first quarter of 2021.
Also notable was the improvement in gold production, which rose 5.8% from 27,691 gold equivalent ounces [GEO] in Q1 2022 to 29,299 GEO in Q1 2023 and increased 33.3% from 21,975 GEO in Q1 2021.
The table below shows how first-quarter revenue has performed over the last three years as a function of GEO production and the average price the company likely earned by selling a gold equivalent ounce. The table also shows the average prices achieved by gold on the futures contracts market in Q1 2023, Q1 2022, and Q1 2021 , as benchmarks for the average realized gold prices. Note that gold equivalent production probably does not match sales volumes, but still gives an indication.
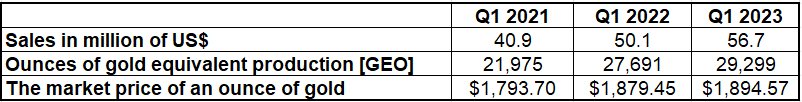
Source of data: Company's quarterly earnings reports and gold futures for average gold prices
The cost of sales has naturally increased over time from $35.61 million in Q1 2021 to $42.6 million in Q1 2022 and then to $48.9 million in Q1 2023, as the company had to deal with higher gold production that had to be delivered to the market. Also, general and administrative expenses increased from $1.208 million in Q1 2021 to $1.397 million in Q1 2022 and to $1.553 million in Q1 2023 as a result of ongoing efforts to grow the business.
The Profitability of Operations and the Impact on the Stock Price
Higher daily ore throughput combined with a higher gold price proved very beneficial to Dynacor Group Inc.'s EBITDA and operating cash flow, two metrics highly valued by investors.
EBITDA, a metric widely used by investors to gauge the profitability of operating capital-intensive industries such as gold production, was $6.9 million in Q1 2023 compared to $6.8 million in Q1 2022 and $4.6 million in Q1 2021. While operating cash flow was $5 million in Q1 2023, close to $5.2 million in Q1 2022, it increased significantly from $3.1 million in Q1 2021.
The impact on the stock price has obviously been positive as can be seen in the chart below where the stock's market value has increased in recent years, and it has managed to mimic the performance of the price of gold very well. The latter aspect is measured by a positive correlation [see cc of 0.74 in the table below] that clearly explains that Gold Futures - June 2023 (GCM3), the gold price benchmark, does roughly the same thing when Dynacor Group Inc. stock rises or falls.
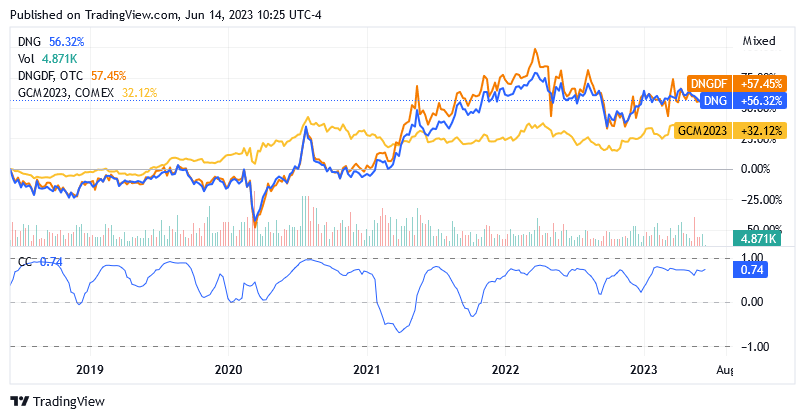
Source: Seeking Alpha
The correlation coefficient has a curve that mostly occupies the upper part of its chart (i.e., above the zero line), providing evidence that the two assets have been positively correlated over the past few years, with rare exceptions.
The Company Wants to Expand Further
However, analyzing the chart does not end with observing the positive correlation between the two assets. It also shows that in the first half of 2021, around the start of the project to expand the capacity of the Veta Dorada plant, the Dynacor Group Inc. stock price curve intersects the Gold Futures - June 2023 curve and positions itself steadily above the benchmark amid a general uptrend in gold prices.
With the significant increase in throughput at the Veta Dorada facility, Dynacor Group Inc. is poised to rise to a higher echelon in the mining industry and its stock is now attracting significantly more public attention than before. As such, Dynacor Group Inc. is now favored over many other small operators when looking to capitalize on gold price growth. The company can now sell much larger quantities of gold equivalent ounces and this ability also looks set for further improvement.
In fact, Dynacor intends to increase the efficiency of the Veta Dorada facility as well as the capacity of dedicated facilities for the containment of tailings (waste material). In addition, the company is equipping its mineral purchasing team with additional vehicles and expanding operations with more buildings for administrative and ore purchasing activities.
These investments are part of an annual budget of $7 million to $10 million, which is well within reach given the $5 million in operating cash flow generated by Dynacor Group in the first quarter of 2023 alone.
Plus, the company has a solid financial position that can support the business expansion project. It can rely on $30.7 million in cash or $30 million in net liquidity because it has $0.7 million in debt. An Interest Coverage Ratio of 90x indicates that the company can afford the outstanding debt as it can easily afford to pay the interest expense due on it. The ratio is calculated as a trailing 12-month operating income of $18 million divided by a trailing 12-month interest expense of $0.2 million. Figures are as of Q1 2023. Plus Altman Z-Score of 7.28 points to zero probability of bankruptcy within a few years (on this page , scroll down to the “Risk” section, which reports the Altman Z-Score). This ratio measures the probability that a company could go bankrupt. If it is less than or equal to 1.8, the risk is high, if it is between 1.8 and 3, the risk is moderate, and if it is more than or equal to 3, the risk is low or absent.
So, this stock appears to have excellent potential to benefit from a rally in the price of gold, which analysts at Trading Economics see topping $2,000 an ounce in late 2023 and early 2024, as illustrated in the Trading Economics chart.
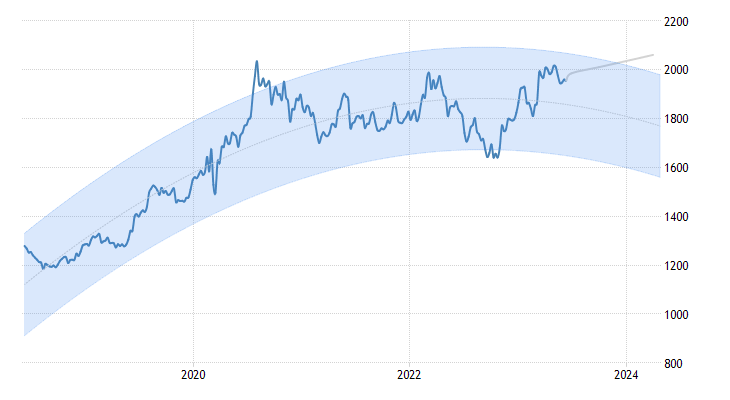
Source: Trading Economics
On the chart, look at the gray extension of the curve, which is the guess analysts make about how the curve might evolve.
Higher gold production combined with the expected bull market for gold will be very positive for the company's profitability provided operating expenses are kept under control. In my opinion, this will create favorable conditions for a potentially robust rise in the share price.
In terms of gold production, Dynacor Group Inc. should sell between 113,500 and 127,000 ounces of gold this year. This is based on the company's 2023 revenue projections of a 6.5% to 20% year-over-year increase to between $210 million and $235 million and assuming an average market gold price of $1,850 from the company's assumed price range of $1,800 to $1,900 per ounce.
A surge in cash flow could prompt the company to increase its monthly dividend, but the dividend is not a reason for owning Dynacor Group stock, nor is its share buyback program.
The dividend, which pays approximately CA$0.12 per share on an annual basis, is too small to justify an investment in this stock.
As for the share buyback program, it could experience a delay or interruption if, as this analysis predicts, the share price rises significantly after the expected gold bull market in the second half of 2023. The company repurchased 29,080 common shares in the first quarter of 2023, down from 285,836 in the first quarter of 2022.
The Stock Valuation
At the beginning of this analysis, it was suggested to just Hold shares of Dynacor Group Inc. ( DNG:CA ) ( OTCPK:DNGDF ), b ecause the stock could become even more attractive after July 26, i.e., after the interest rate decision by the US Federal Reserve.
As of this writing, the stock price was trading at CA$2.98 per share under the DNG:CA symbol on the Toronto stock exchange giving it a market cap of CA$114.13 million. The 52-week range is CA$2.50 to CA$3.30. Shares are trading below the 100-day simple moving average of CA$ 3.02 and the 50-day simple moving average of CA$ 3.04, but they are above the 200-day simple moving average of CA$ 2.92.
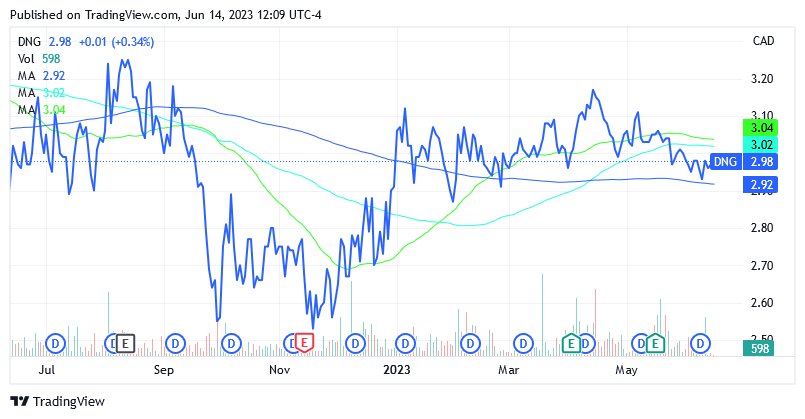
Source: Seeking Alpha
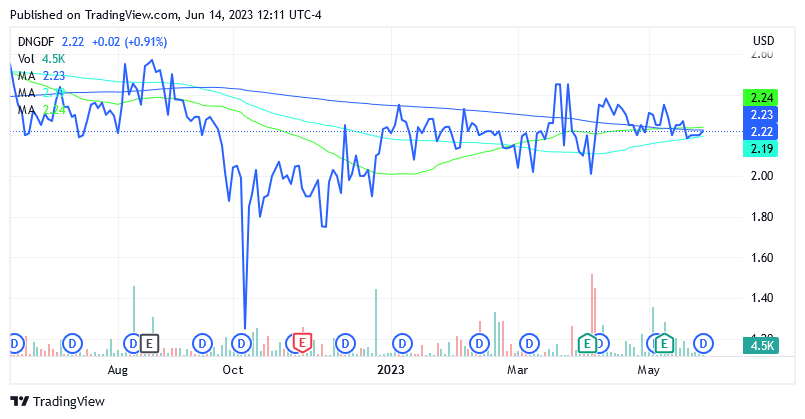
As of this writing, the stock price was trading at $2.22 per share under the DNGDF symbol on the US over-the-counter market giving it a market cap of $85.73 million. The 52-week range is $1.00 to $2.60. Shares are trading near the 100-day simple moving average of $2.19, near the 50-day simple moving average of $2.24, and near the 200-day simple moving average of $ 2.23.
Source: Seeking Alpha
These price levels could become more attractive after July 26 if the US Federal Reserve goes ahead with what is likely to be its latest rate hike in a bid to take another step in the fight against high inflation. At least that's what is perceived in some speeches by some of the governors of the top monetary authorities at the end of May, and it must also be said that these are not the most hawkish among the committee's governors.
Higher interest rates will make fixed income more attractive, and the precious metal will suffer from competition. Fewer investors will then flock to gold, resulting in a lower price for the metal and some negative pressure on the Dynacor Group Inc. stock due to the positive correlation mentioned above. After that, it may be more convenient to add shares of the Canadian gold company, so that the position will be better prepared for a new upward trend in the gold price, as analysts predict for the second half of 2023.
Analysts' estimates are based on the fact that the need to protect the value of portfolios from the negative impact of the risk of an economic recession, which most economists believe is becoming increasingly likely in the second part of 2023, will boost the demand for gold investments.
Conclusion
This Canadian gold equivalent producer is well positioned due to the ongoing expansion of the facility's ore processing capacity and the rosy outlook for gold in the second half of 2023.
Shares are not yet a buy, however, because according to this analysis they should continue to gain attractiveness after the end of July.
For further details see:
Dynacor Group Is Strongly Poised For A Gold Bull Market