NRGU - Energy Theme (Oil And Gas) Ready To Take Off In H2 Of 2023 (Technical Analysis)
2023-08-09 17:07:32 ET
Summary
- Oil & gas stocks are showing high relative strength. At the same time, spot prices in crude oil and natural gas are breaking out of big multi-month bases.
- I realise that the strength in uranium miners (my recent conviction buy call) may be part of a bigger, more powerful theme - energy markets.
- Oil & gas stocks have consolidated for more than a year after a strong bull run between 2020 to mid-2022, and may be ready to drive higher in 2H'2023.
Pullbacks in markets always provide valuable information, especially if the broad market remains in an uptrend - which is the case, with the indices still making higher lows.
This is because we get to identify the next batch of leading sectors and stocks that will likely outperform the market if and when the recovery comes.
When everything is going higher in tandem, it is difficult to spot relative strength. When the broad market is coming up, the ships that stand tall amidst the choppy waters will likely make it to shore first when the weather improves.
I have written about two sectors that I am focused on due to their relative strength - uranium miners and China technology stocks . My thoughts and the technical charts were covered in recent posts.
I continue to stand by my buy calls. However, it has come to my attention that the former theme (uranium miners) may be a subset of a larger, more powerful theme in play. I am seeing strength in the energy markets as a whole, and this includes oil & gas stocks.
Oil & gas stocks have remained under the radar for a long time, and we may now be on the cusp of a rotation of money into this sector.
First, let us look at how spot energy prices are doing, as these stocks will receive a tailwind if spot energy prices are breaking out higher.
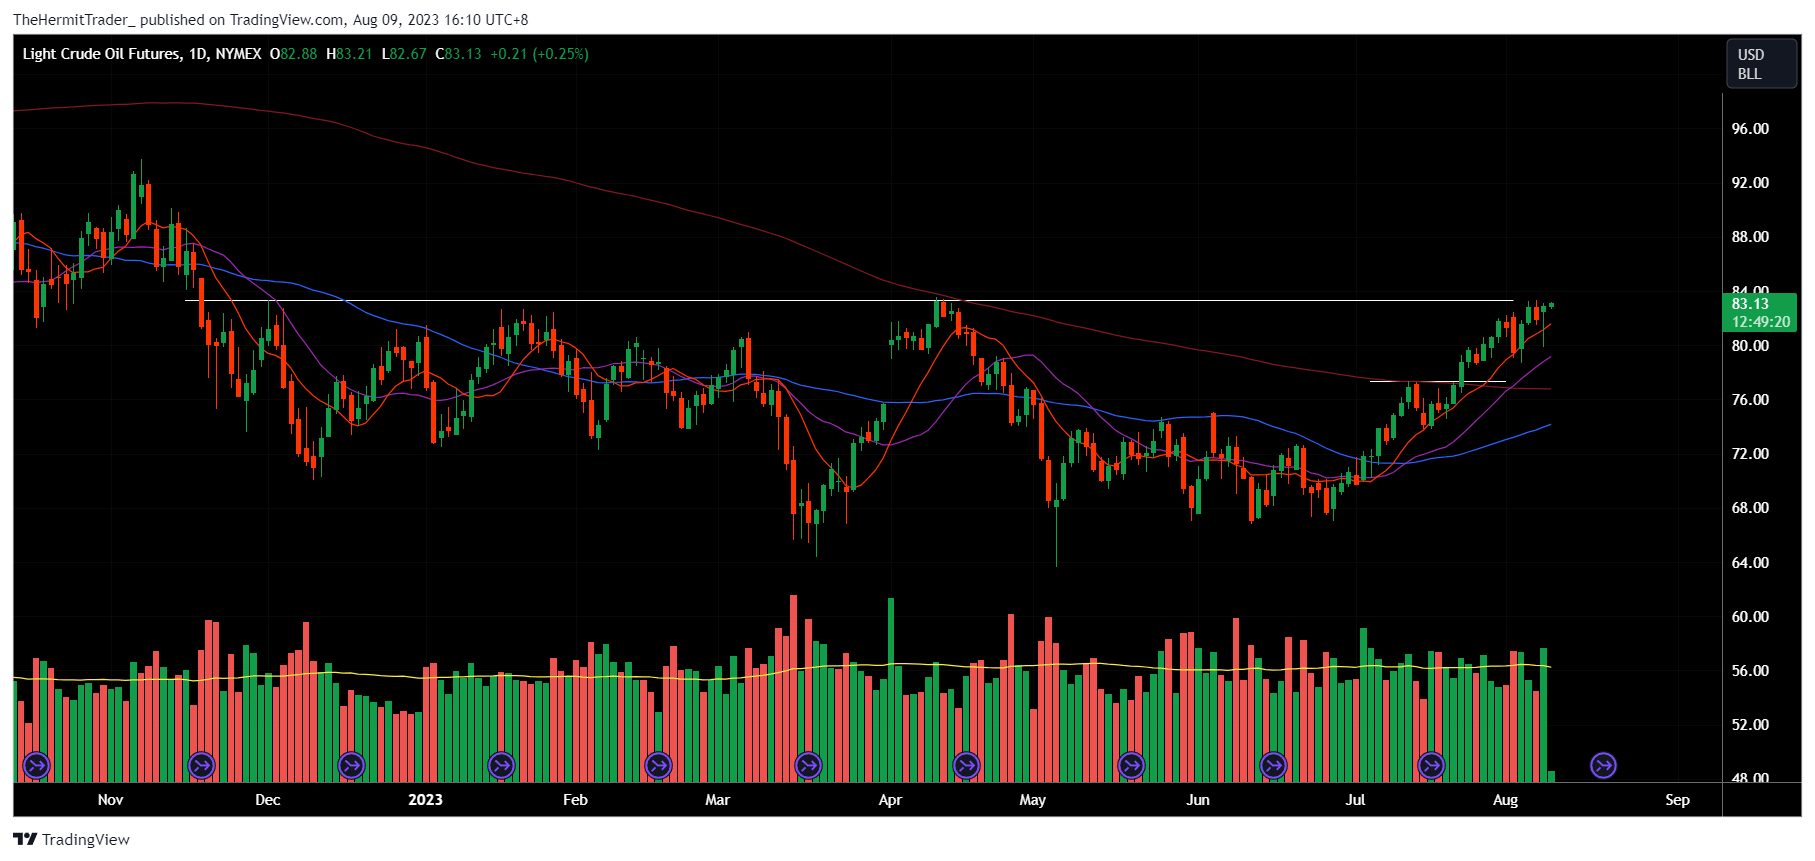
Crude oil ( USO ) - Prices are on the verge of breaking out of a massive 9-month base.
Daily Chart: Crude Oil
Natural Gas ( UNG ) ( BOIL ) - Spot prices have broken out higher from a 6-month base. Natural gas prices have plummeted more than 70% from their 2022 high, and may be in the process of bottoming out.
Daily Chart: Natural Gas
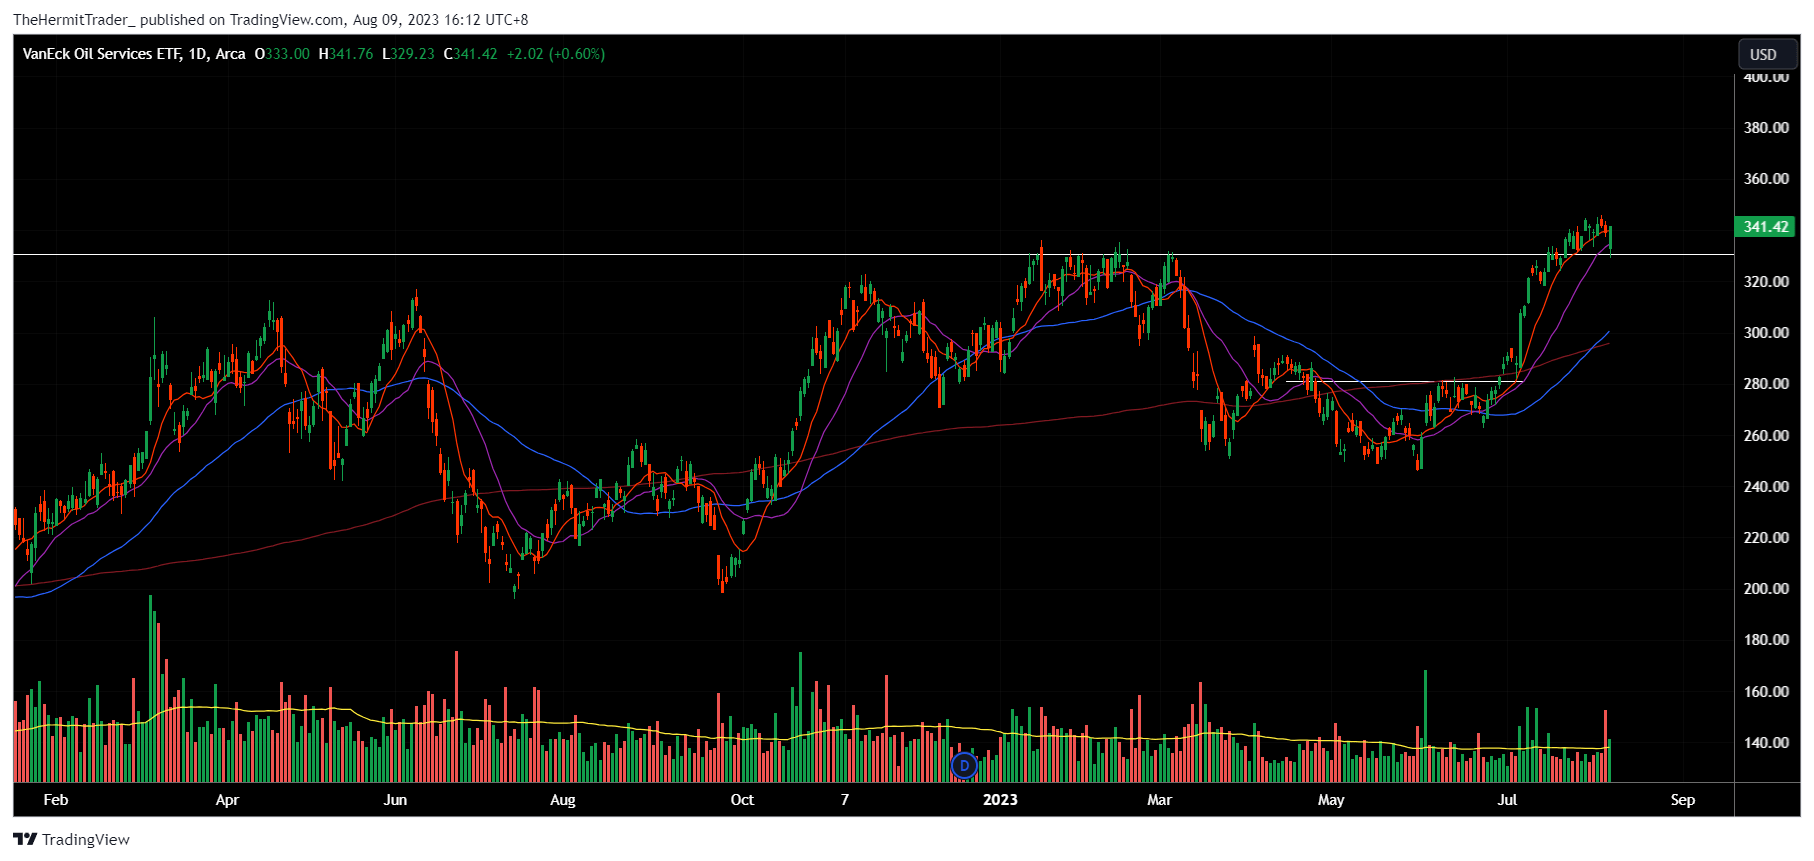
VanEck Oil Services ETF ( OIH ) - Many oil & gas ETFs are breaking out of big bases or are trading at near-term highs despite the recent market volatility, or both. OIH is trading at 52 week highs. Notice how prices swiftly recaptured above the 10 and 20 DMAs after an initial plunge on 8 August. Buyers are stepping in.
Daily Chart: OIH
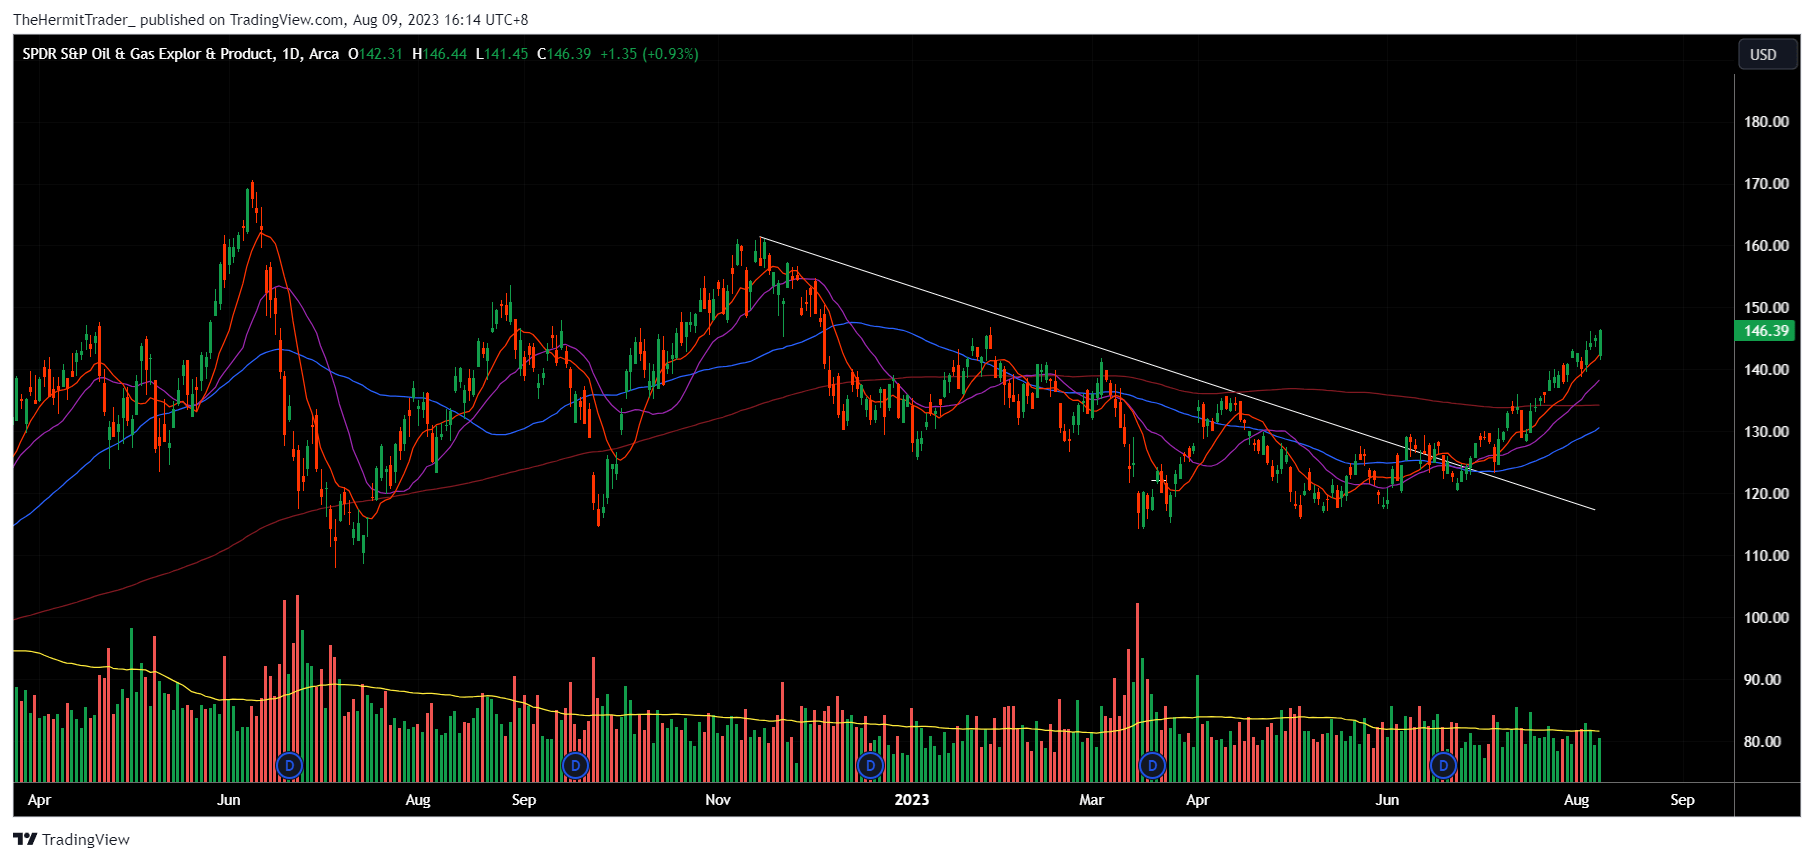
Oil & Gas Exploration ETF ( XOP ) - Explorers are also faring well, albeit not trading at 52-week highs unlike OIH. That said, the ETF is trading at near-term highs and above its key moving averages (10, 20, 50, 200 day), which is a stark contrast to many other sectors and stocks in the broad market.
Daily Chart: XOP
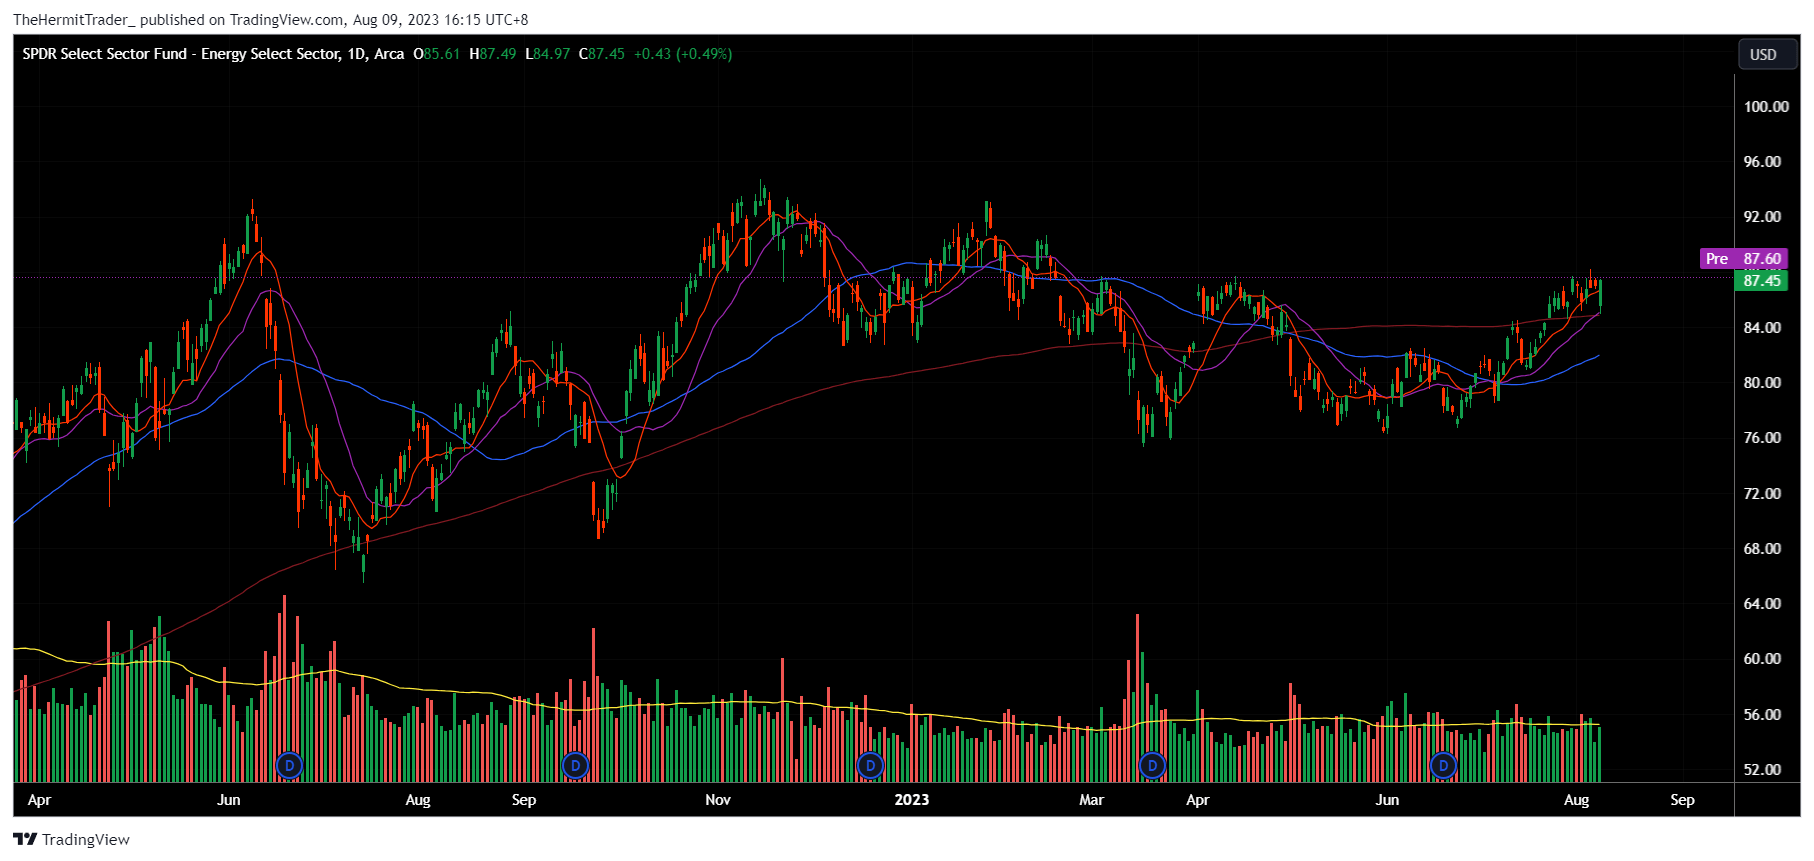
Energy Select ETF ( XLE ) - This ETF holds a larger percentage of large-cap energy stocks, compared to the above two. Out of the trio, XLE is perhaps the most sluggish, but its price chart is still showing a lot of strength compared to the broad market.
Daily Chart: XLE
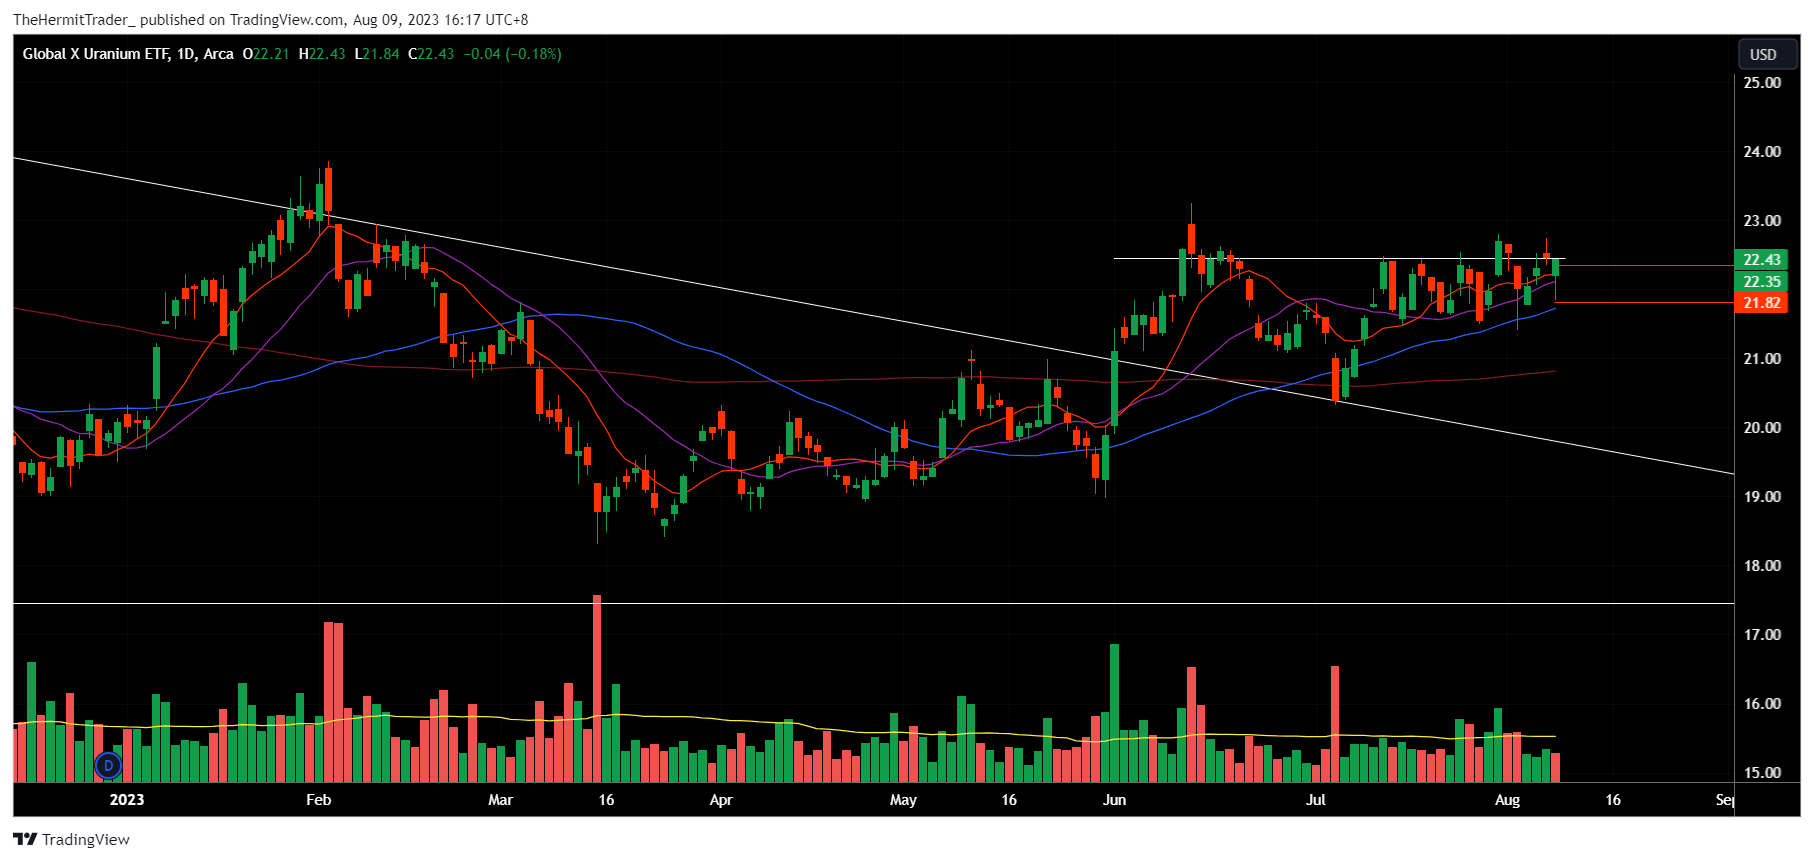
Uranium ETF ( URA ) - A swift update on the price action on URA; despite the recent market volatility, the ETF continues to build a near-term range, and put in a strong bullish reversal candle on 8 August. This means that price managed to stage a strong turnaround to recoup the majority of initial losses in the day. This is a sign that buyers are stepping in. Playing on the reversal, I took a long position at $22.35 on 8 August, with a stop loss at $21.82.
Daily Chart: URA
The reason why I believe the strength in uranium miners is subset of a larger more powerful theme is because of the strong positive correlation between oil & gas and uranium stocks.
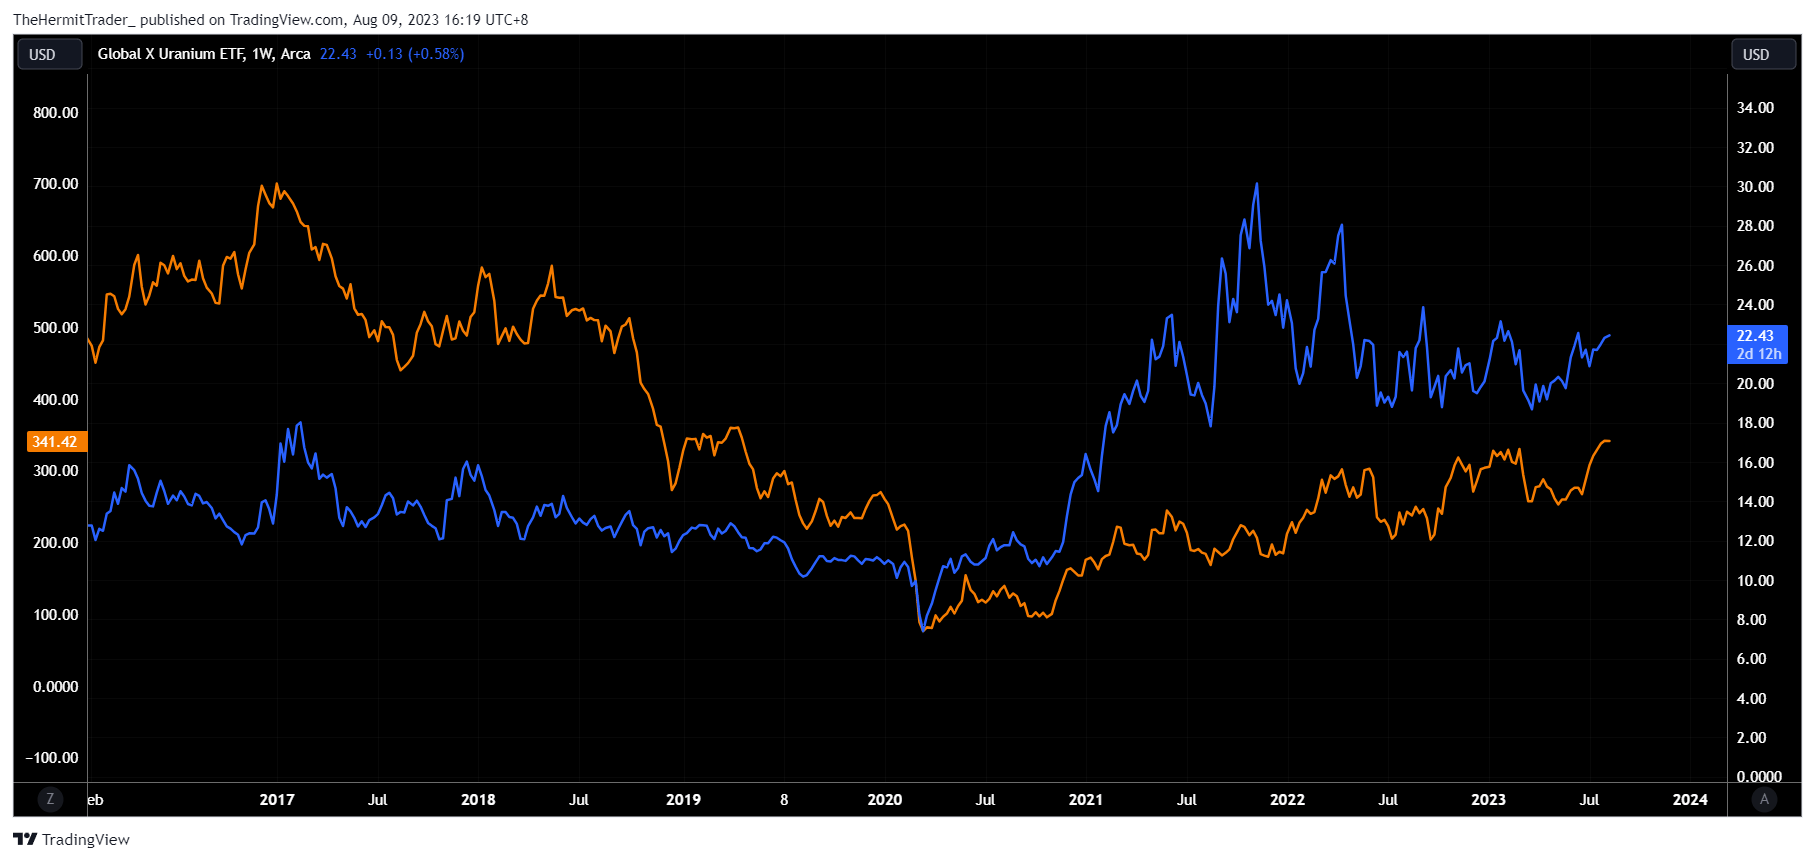
Below, I show the price charts of two ETFs - URA and OIH. We may observe that both energy markets move largely in tandem. Hence, the strength in uranium miners adds to my conviction that oil & gas stocks are poised to breakout higher, and vice versa.
Weekly Chart: URA (in blue) and OIH (in orange)
My style of trading involves me having a stop loss in place for every trade. Hence, when trading commodity-related stocks, I always prefer to trade ETFs.
This is because commodity stocks tend to pay dividends that are higher than stocks from most other sectors. This could lead to gaps in prices that prematurely trigger my stop loss orders.
In addition, trading the ETF removes the issue of price gaps from capital raises, share issuance, investments in other commodity stocks, etc., which from my experience, tends to occur more in commodity stocks than other sectors. I may be wrong on this, and perhaps this is my personal bias, but being in an ETF mitigates a lot of this risk.
Yes, the absolute price gains could be smaller, but I can have more confidence in putting on larger size, knowing that the aforementioned risks are mitigated, and overall liquidity is higher.
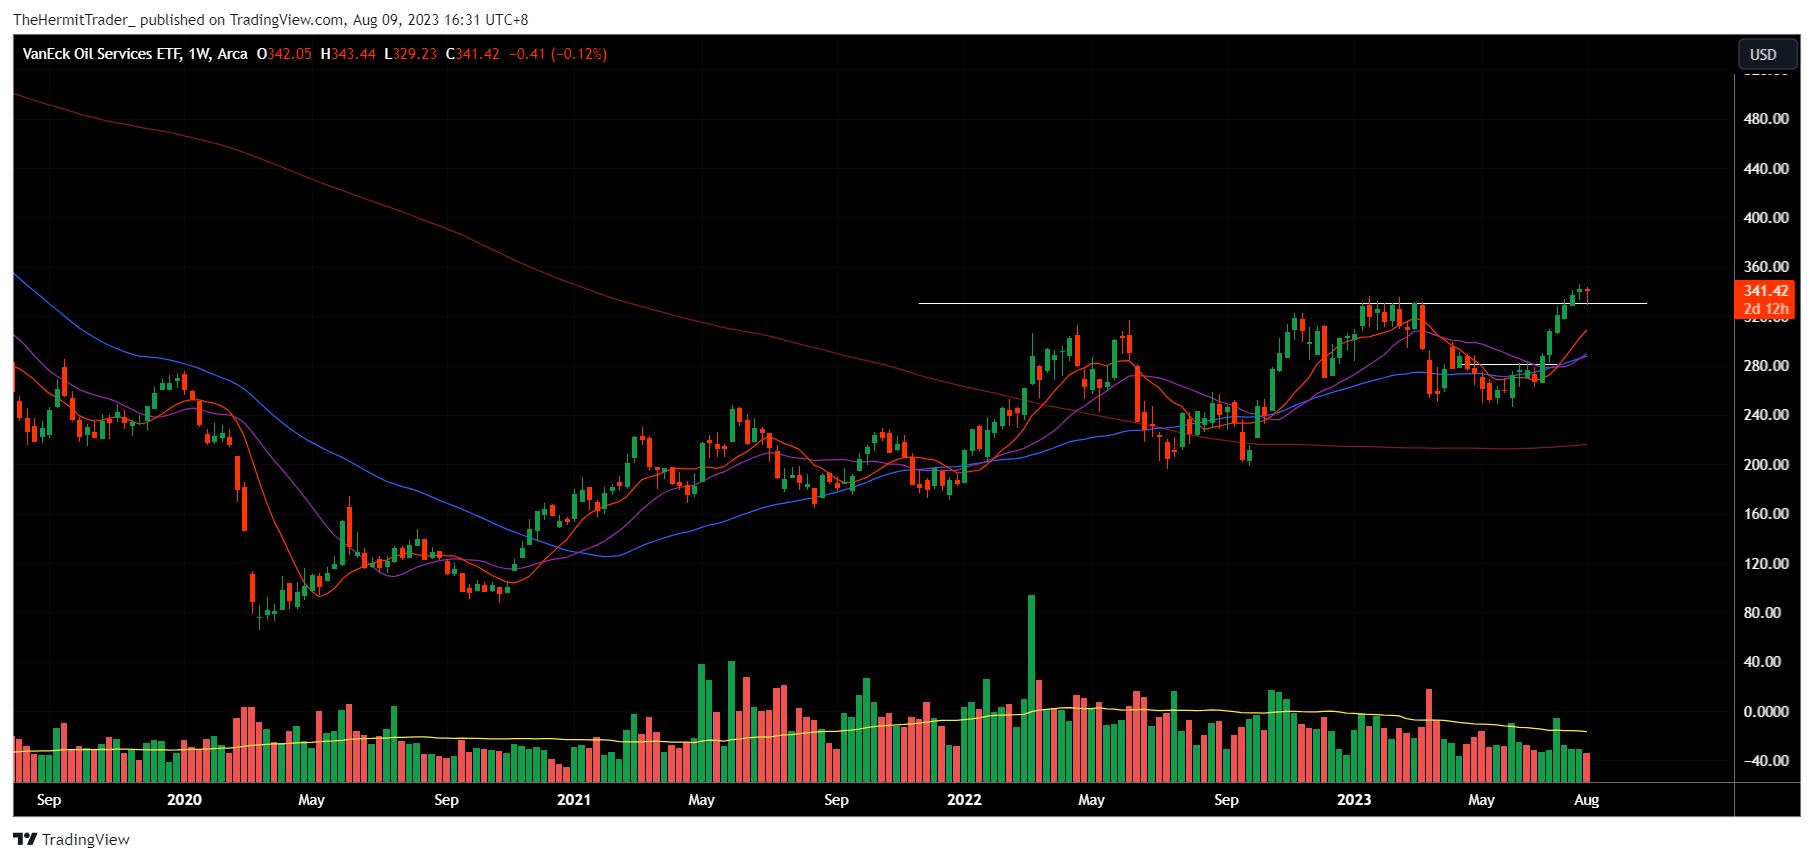
Out of the above three oil & gas ETFs I covered, my preference is OIH. This is because it is trading at 52-week highs, unlike XLE and XOP. This is a sign of relative strength in my view. This can be observed from its weekly chart below.
Weekly Chart: OIH
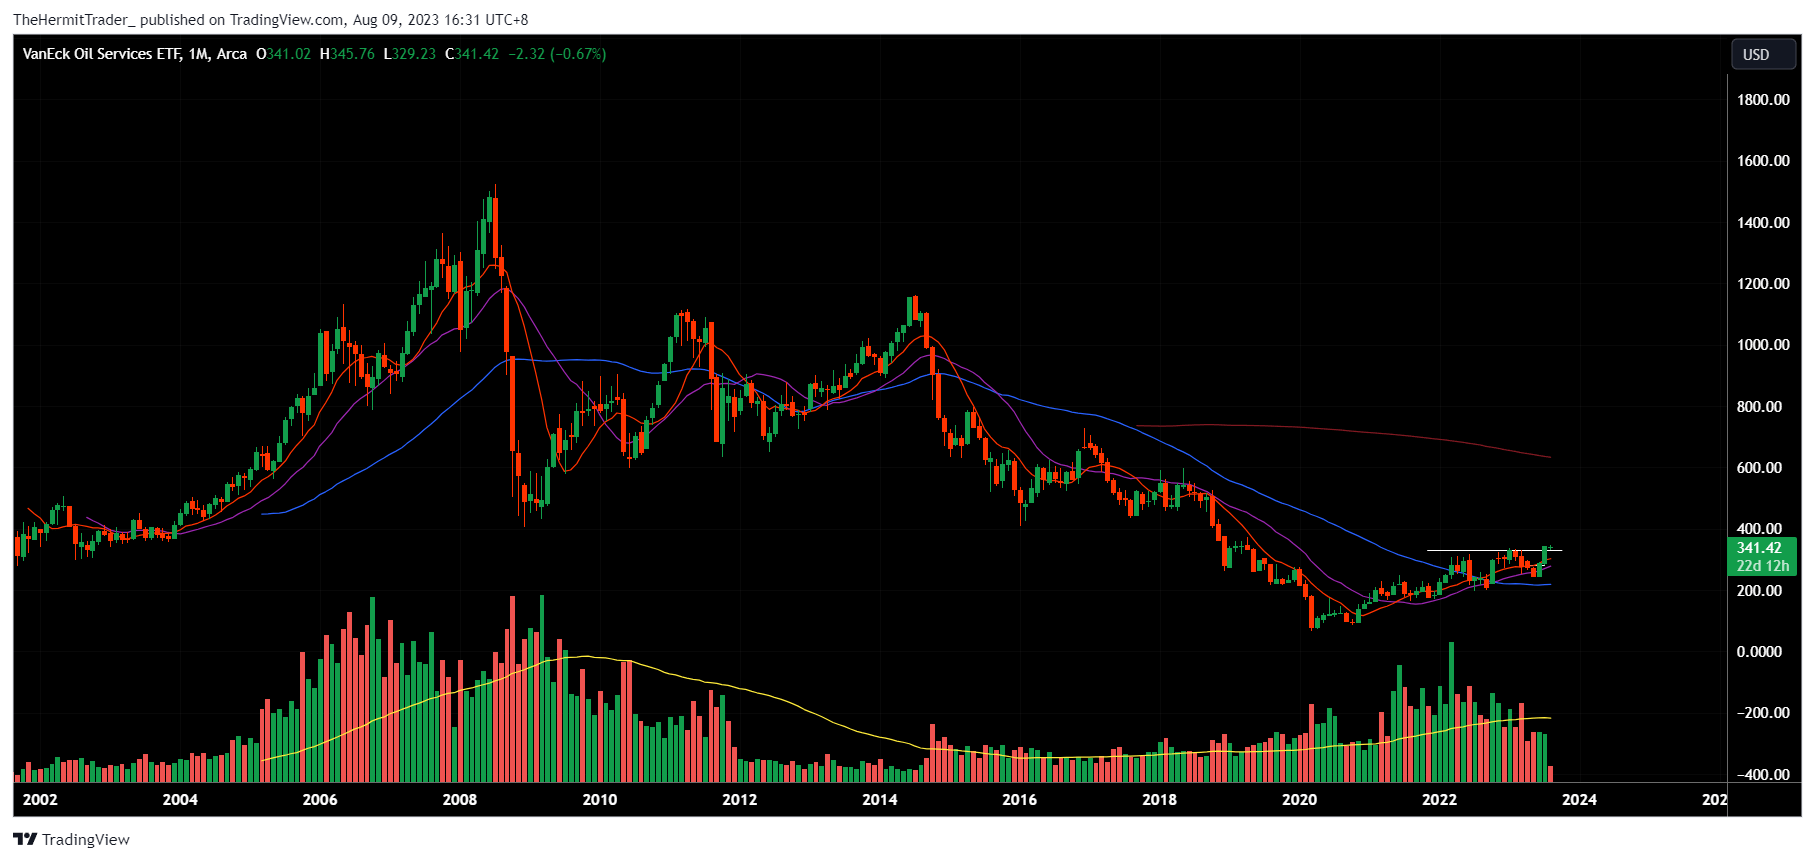
Zooming out to the longer-term monthly chart, we may observe that OIH is still more than 75% below its peak in 2008. It has been making higher lows since 2020, and looks to be bottoming out on a longer-term timeframe.
Monthly Chart: OIH
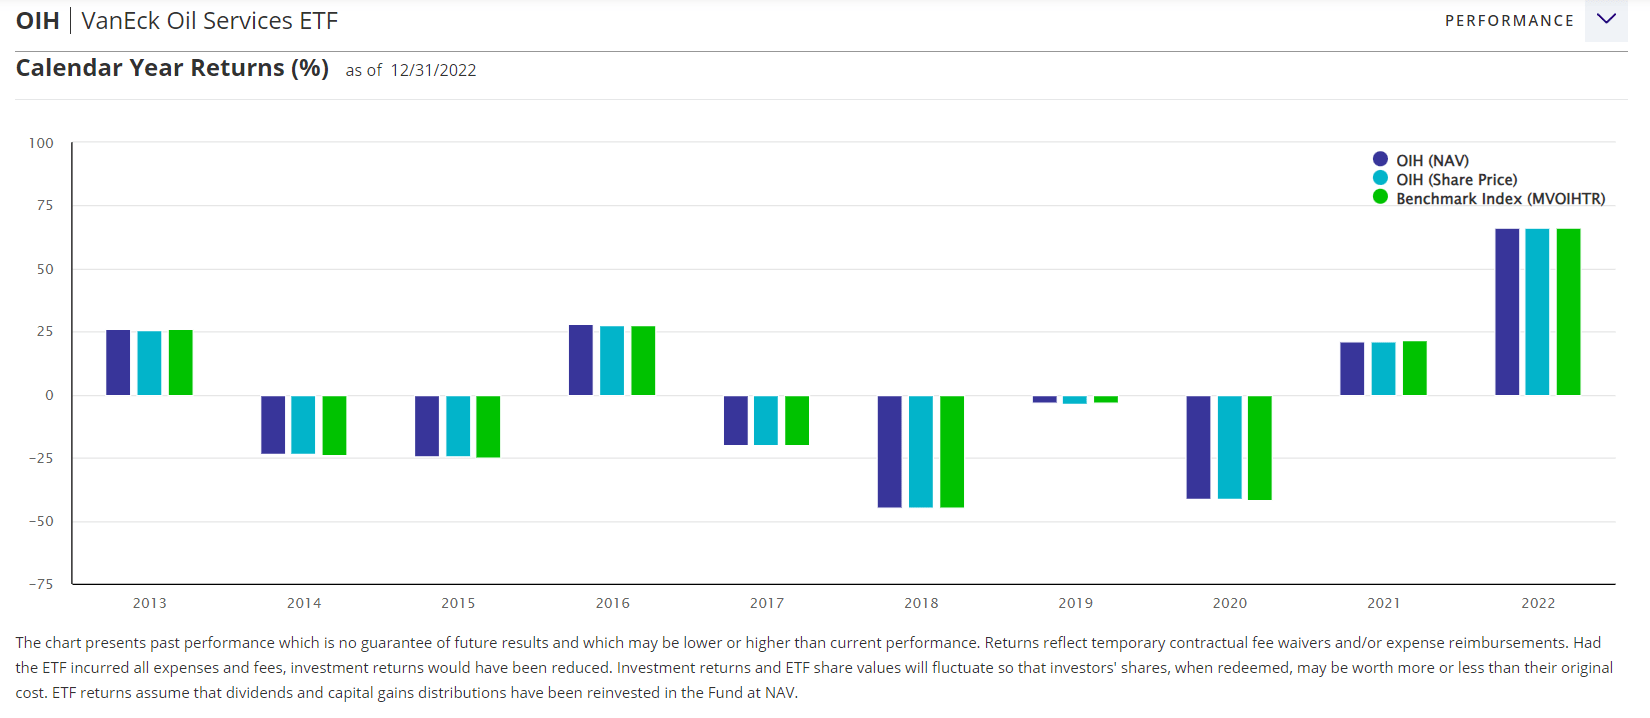
I believe 2022 was the breakout year for oil & gas, as seen in the snapshot of OIH's calendar year returns below. After the strong breakout, the sector has been consolidating for close to 1.5 years. Now, we may be seeing a resumption of its uptrend again.
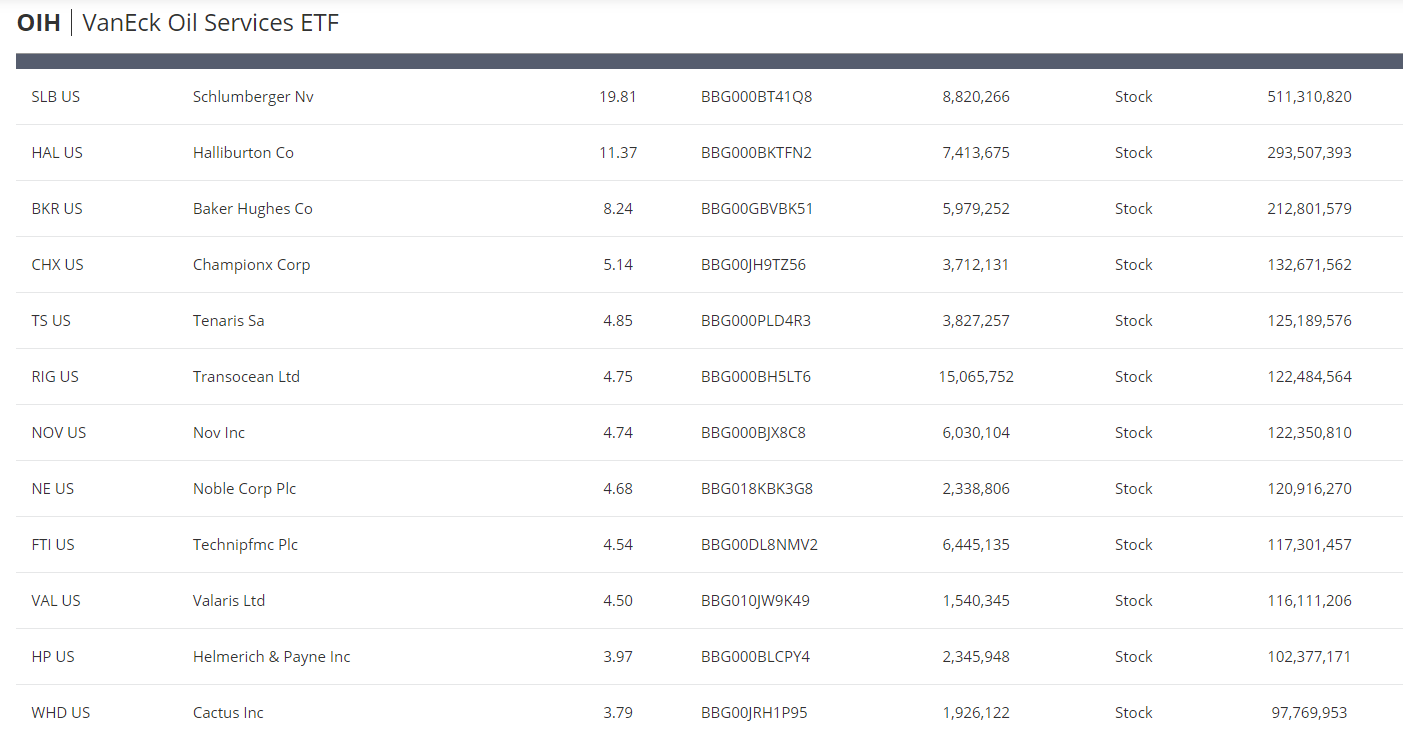
OIH's holdings include large-cap names like Schlumberger ( SLB ), Halliburton ( HAL ), and Baker Hughes ( BKR ). The top three holdings make up close to 40% of the ETF. Some may not be comfortable with this concentration risk, and if so, may consider the XOP ETF instead. The largest stock weight in XOP is 2.8%, which I personally feel may be too diluted to drive returns.
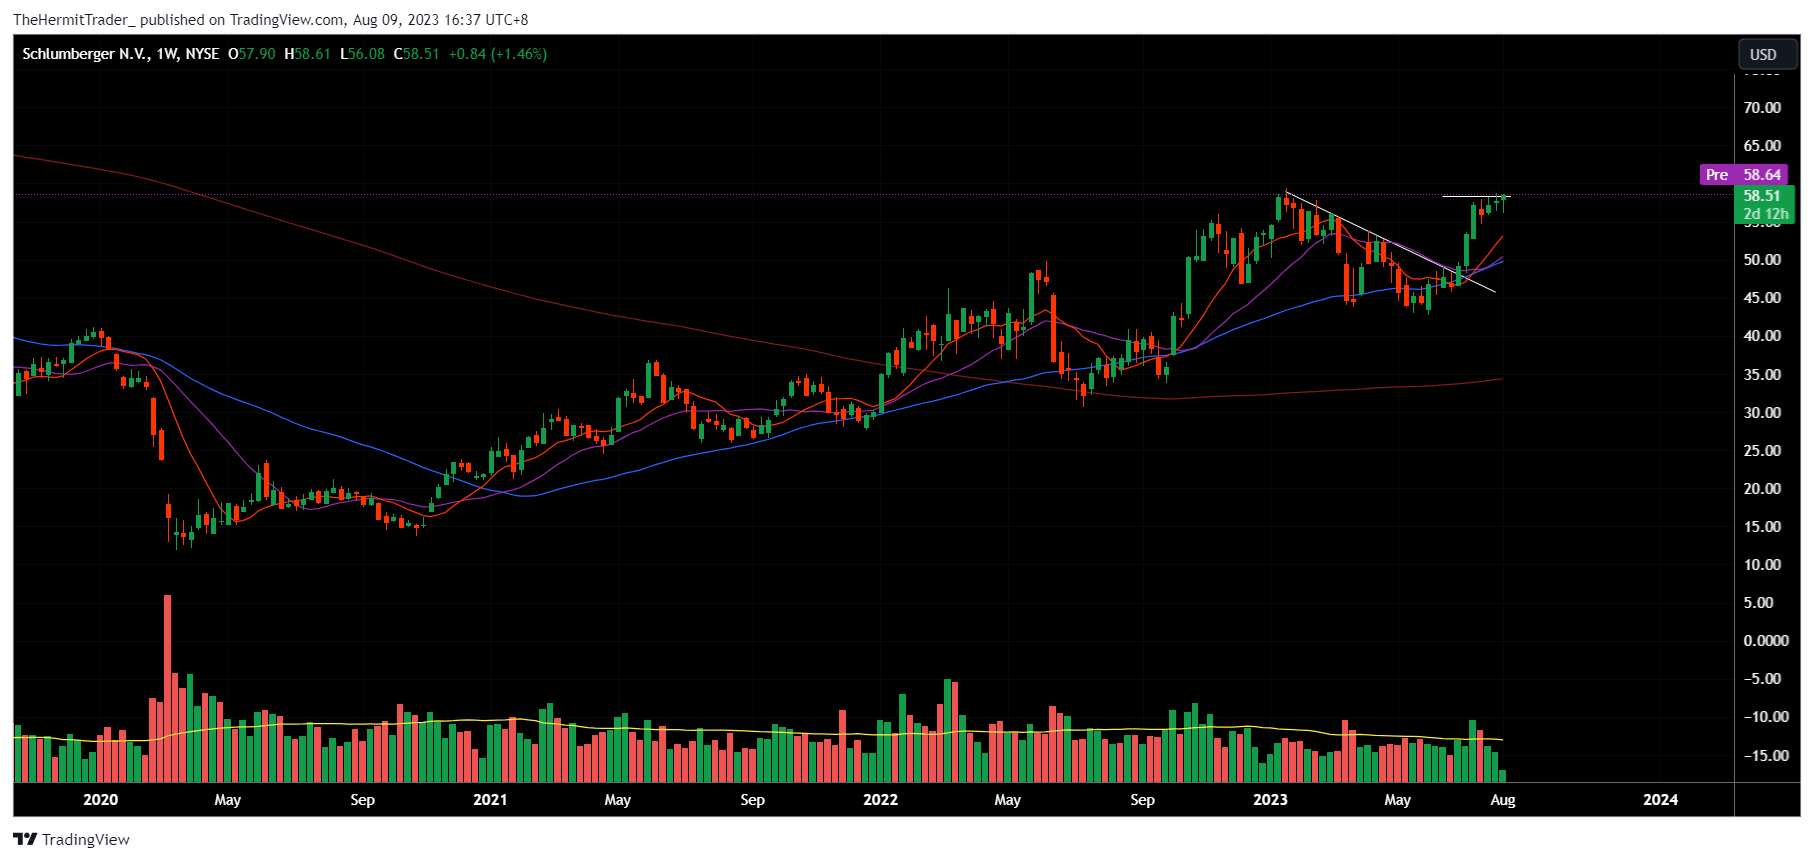
Looking at the weekly charts of SLB, HAL and BKR below, we may observe that they are leaders within the sector. OIH focuses on these names, while XOP's performance may be diluted by weak performing stocks.
Schlumberger ( SLB ) - Leading stock within the sector, trading at new 52-week highs. Very resilient uptrend.
Weekly Chart: SLB
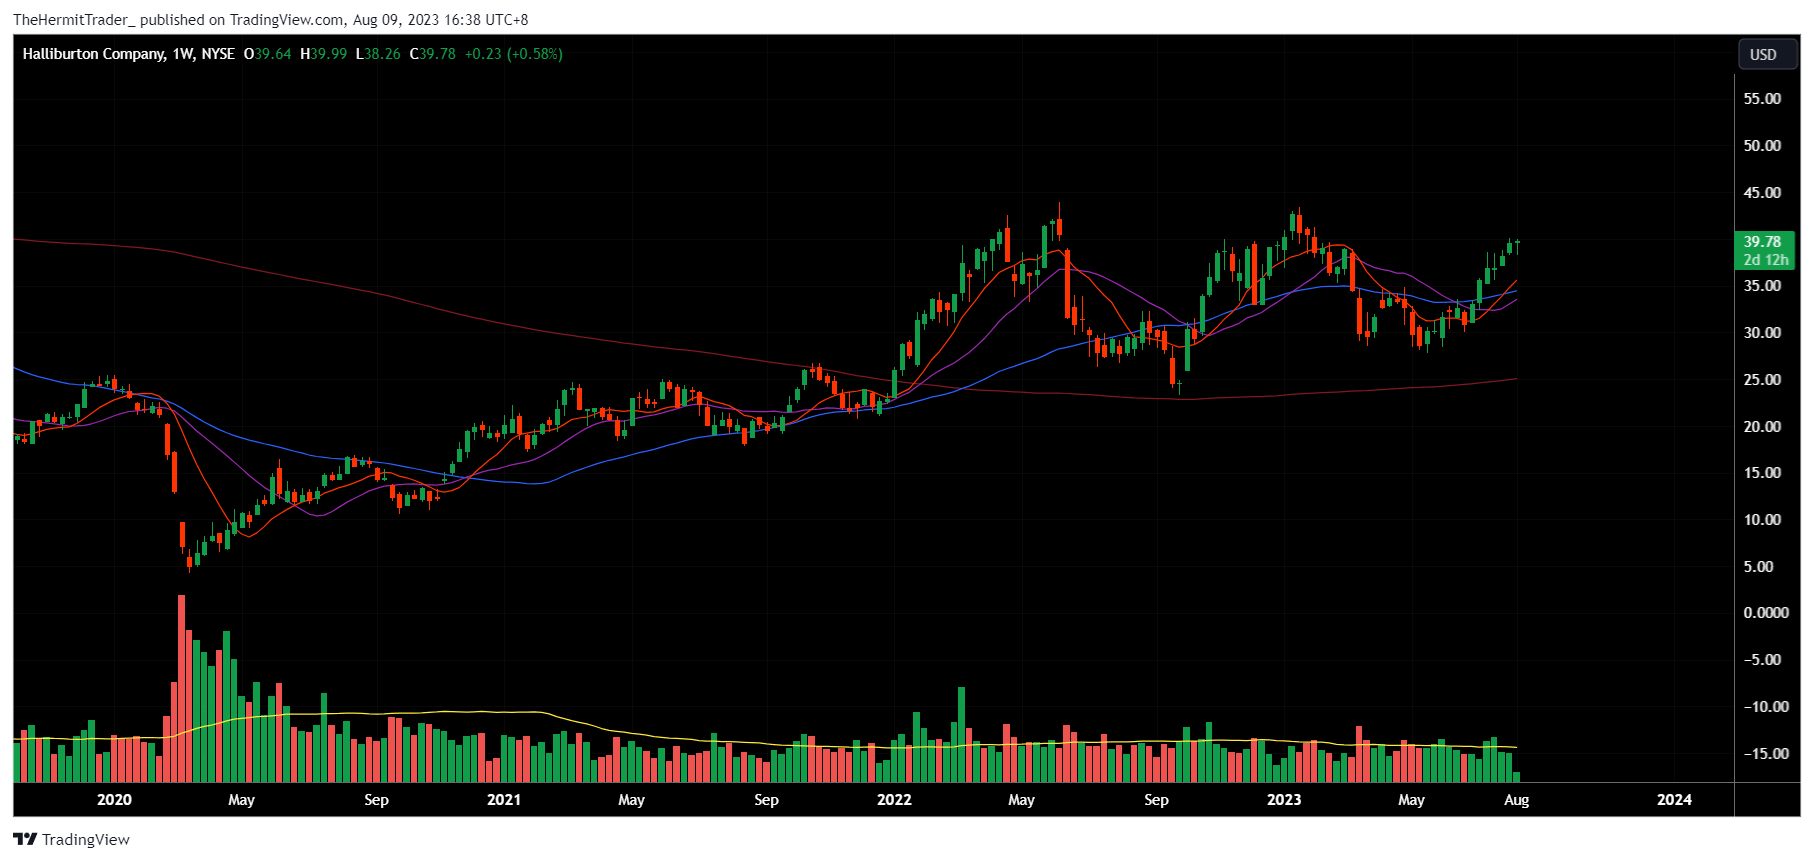
Halliburton ( HAL ) - Building a large multi-month base, and could breakout higher soon.
Weekly Chart: HAL
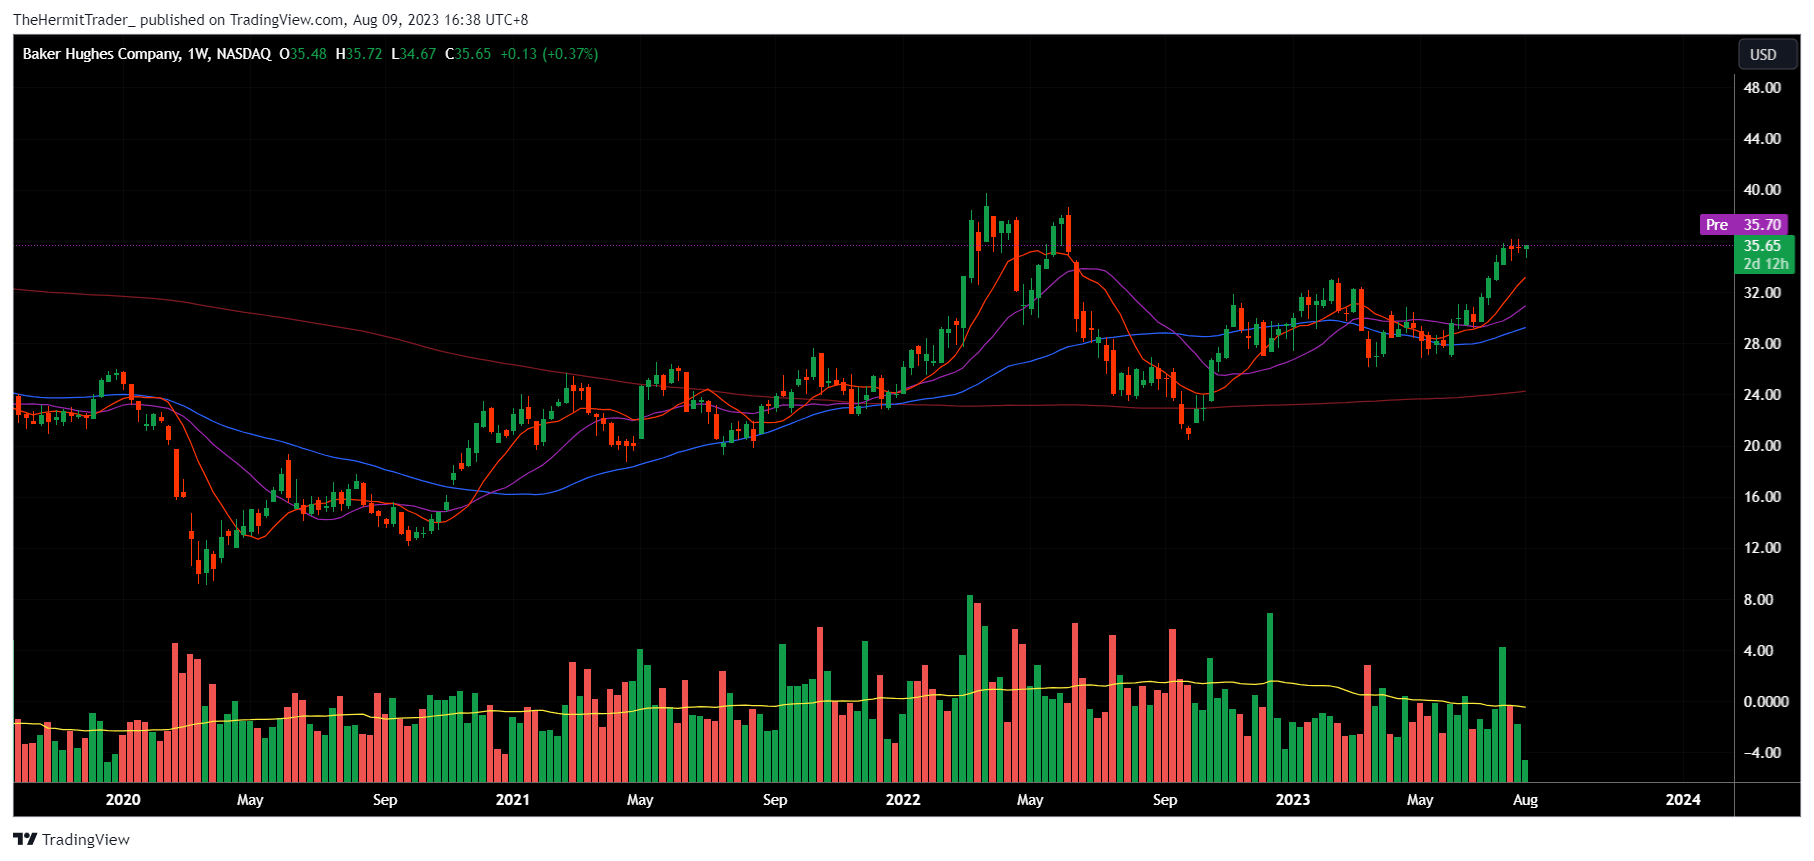
Baker Hughes ( BKR ) - Strong, resilient uptrend.
Weekly Chart: BKR
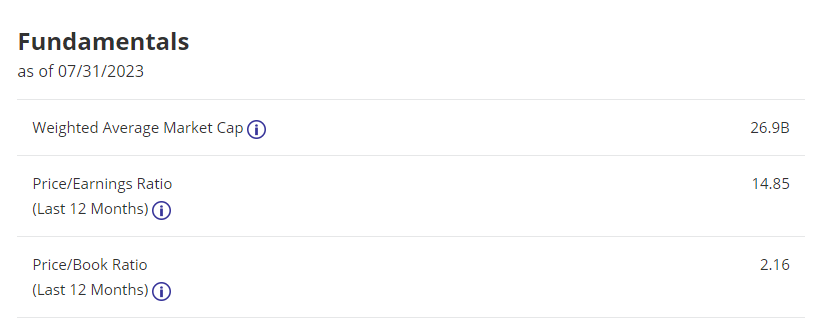
For those focusing on fundamentals (I focus primarily on price action and charts), OIH's PE ratio is inexpensive at 14.8x. Estimated dividend yield is at 0.85% , which is lower than XLE's at 3.7% and XOP's at 2.7%. Once again, those who are gunning for a dividend play can consider any of the other two ETFs.
Overall, I believe the energy theme could start seeing large capital inflows in the second half of 2023. The first half was largely dominated by mega-cap technology stocks, semiconductor stocks, and AI stocks. However, the price charts are now showing high potential for a rotation out of them and into energy stocks.
Energy stocks have rested for more than a year, consolidating their strong gains from 2020 to mid-2022. Now, they look ready to drive higher again. If and when the stock market is ready to recover, I believe we will see energy markets outperform.
For further details see:
Energy Theme (Oil And Gas) Ready To Take Off In H2 Of 2023 (Technical Analysis)