EXPE - Expedia: Strong Gross Booking Growth And Balance Sheet Metrics
2023-09-27 22:48:36 ET
Summary
- Expedia Group has shown strong growth in gross bookings and a lower long-term debt to total assets ratio.
- Recent performance shows an increase in gross bookings and revenue, with growth in lodging gross bookings being particularly impressive.
- The company's ability to fund further growth without having to increase long-term debt positions it for continued success.
Investment Thesis: I take a bullish view on Expedia Group given strong growth in gross bookings coupled with a lower long-term debt to total assets ratio.
In a previous article back in March, I made the argument that Expedia Group ( EXPE ) could see little growth in the short to medium term if we see revenue growth start to plateau going forward.
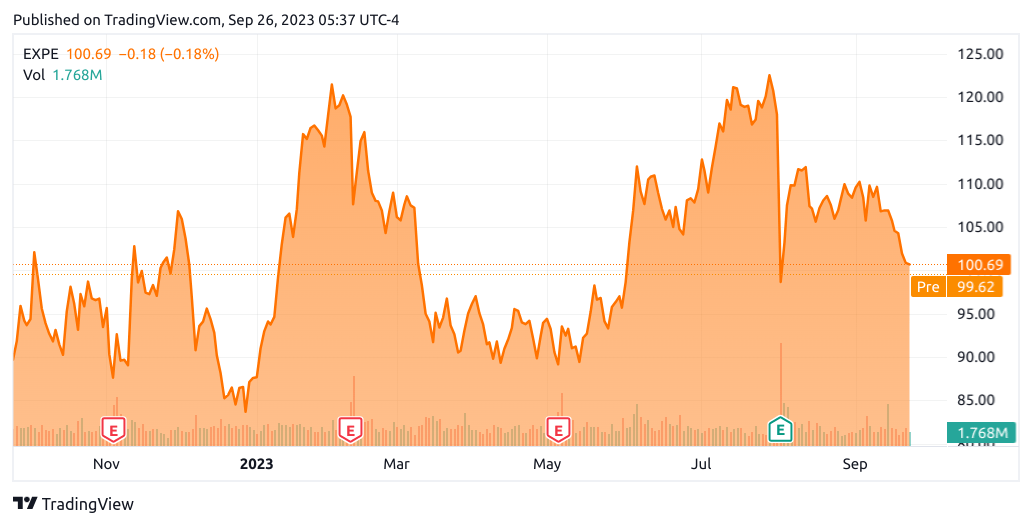
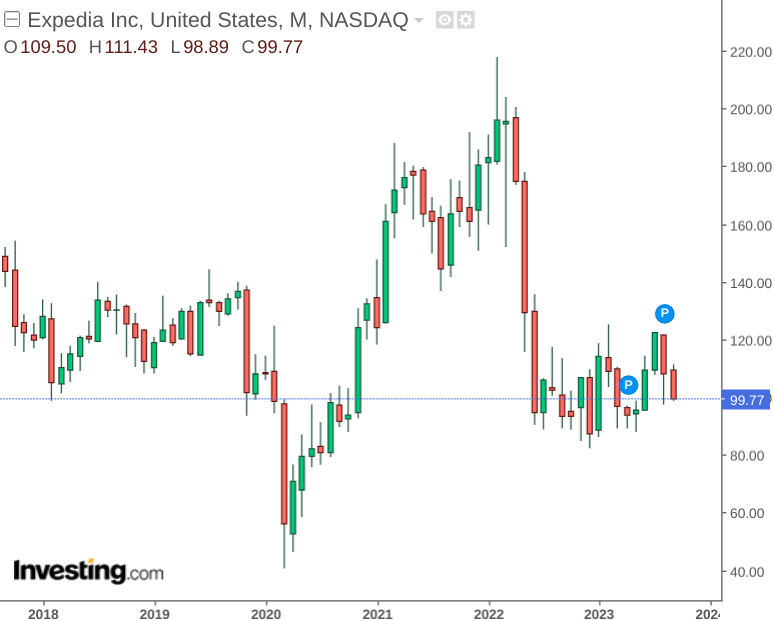
Since then, the stock has ascended to a price of $100.69 at the time of writing:
The purpose of this article is to assess whether Expedia Group has the ability to see continued growth from here taking recent performance into consideration.
Performance
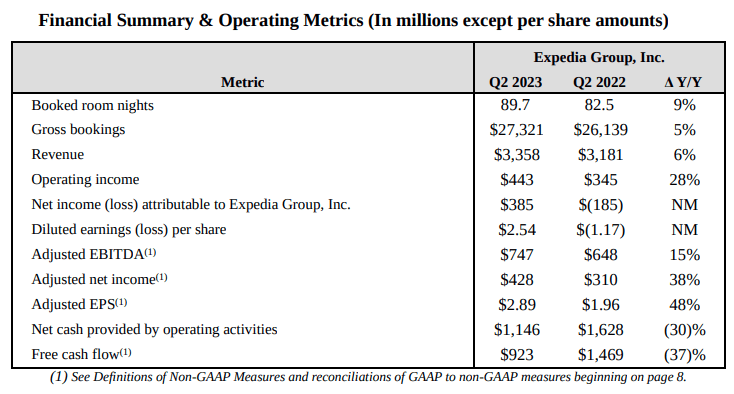
When looking at the most recent earnings results for Expedia Group, we can see that gross bookings were up by 5%, with revenue up by 6% and adjusted EPS up by 48%.
Expedia Group: Second Quarter 2023 Results
When looking at the trajectory of total gross bookings (agency and merchant) over a longer time period, we can see that in spite of a decline towards the end of 2022 - bookings are comfortably back near levels seen in 2019 (the year 2020 was excluded due to the effects of the COVID-19 pandemic):
Figures (in USD millions) sourced from Expedia Group Q4 2019 and Q2 2023 Earnings Releases. Heatmap generated by author using Python's seaborn visualisation library.
From this standpoint, the fact that gross bookings have reversed the downward trajectory that we were seeing from the latter half of last year is quite encouraging.
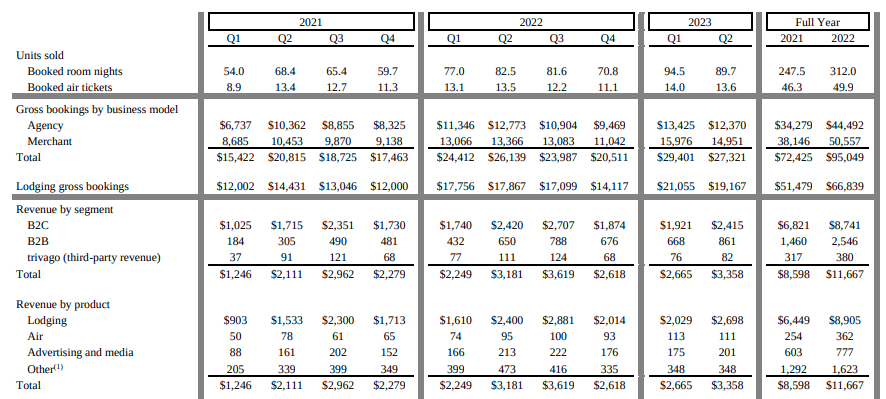
In particular, it is also notable that when analysing revenue by product - we can see that lodging revenue is at its highest since Q1 2021, and lodging gross bookings saw their highest-ever second quarter - up by 7% from that of Q2 2022.
Expedia Group: Second Quarter 2023 Results
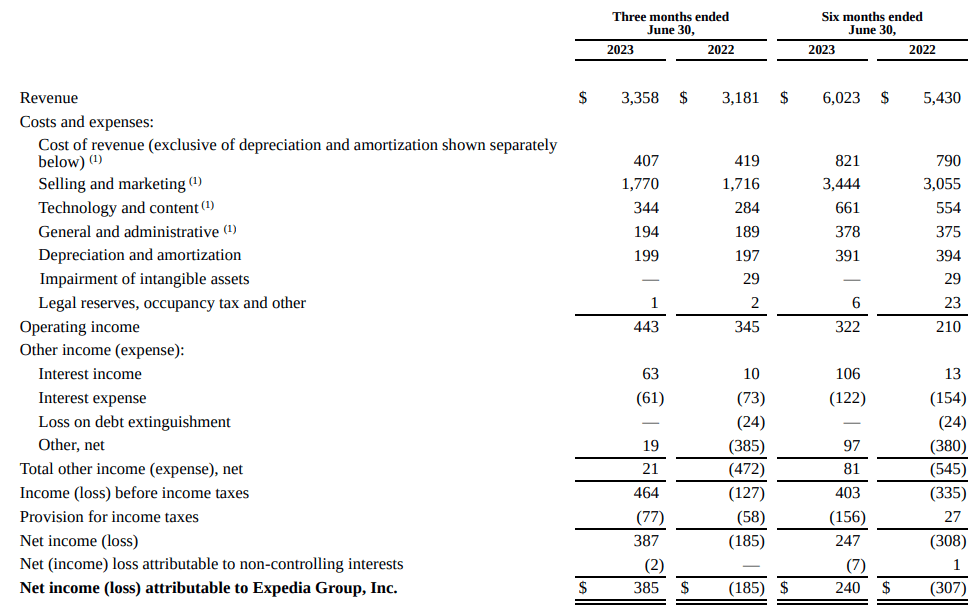
Moreover, with revenue having seen a 5.5% growth rate from Q2 2022 to Q2 2023 and cost of revenue having declined slightly over this period - we can see that operating income was positively impacted by growth in gross bookings - and this resulted in net income also rebounding strongly into positive territory.
Expedia Group: Second Quarter 2023 Results
In this regard, gross booking growth has had a favourable impact on the bottom line in the most recent quarter.
Balance Sheet and Cash Flow Metrics
From a balance sheet standpoint, we can see that the company's long-term debt to total assets ratio is down significantly from that of December due to an increase in total assets - which is encouraging:
| Metric |
| Sep 2019 |
| Sep 2022 |
| Dec 2022 |
| Jun 2023 |
| Long-term debt (excluding current maturities) |
| 4170 |
| 6237 |
| 6240 |
| 6247 |
| Total assets |
| 21381 |
| 21879 |
| 21561 |
| 25676 |
| Long-term debt to total assets ratio (%) |
| 19.50% |
| 28.51% |
| 28.94% |
| 24.33% |
Source: Figures sourced from Expedia Group Q3 2019, Q3 2022, Q4 2022, and Q2 2023 Earnings Releases. Figures provided in USD millions except the long-term debt to total assets ratio. Long-term debt to total assets ratio calculated by author.
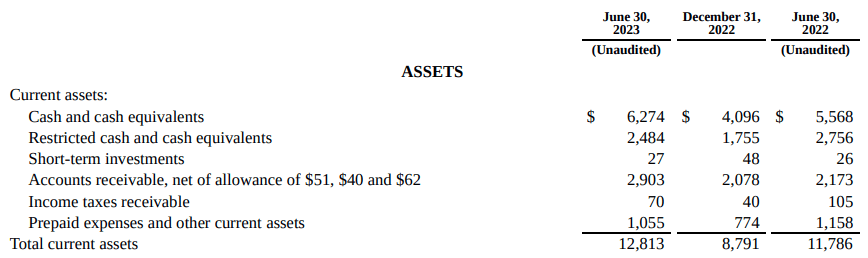
From a short-term standpoint, we can also see that the quick ratio (calculated as cash and cash equivalents plus accounts receivable all over current liabilities) has seen a slight increase but remains below 1 (indicating that the company does not possess sufficient liquid assets to fund its current liabilities).
| Metric |
| Dec 2022 |
| Jun 2023 |
| Cash and cash equivalents |
| 4096 |
| 6274 |
| Accounts receivable |
| 2078 |
| 2903 |
| Current liabilities |
| 10778 |
| 15429 |
| Quick ratio |
| 0.57 |
| 0.59 |
Source: Figures sourced from Expedia Group Q2 2023 Form 10-Q. Quick ratio calculated by author.
As regards cash flow, we can see that while Expedia saw a drop in free cash flow due to a drop in net cash provided by operating activities, we can see that the company still managed to increase cash and cash equivalents to $6.274 billion from $5.568 billion in June 2022 - representing an over 12% increase.
Cash and cash equivalents
Free cash flow
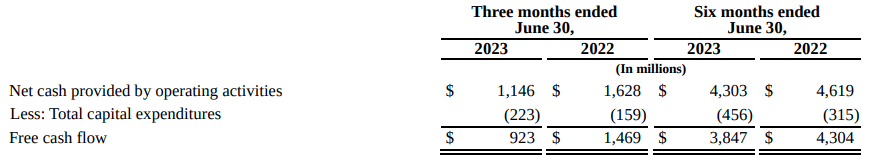
However, it is notable that when looking at the drop in net cash provided by operating activities on a six-month basis, we can see that the previous year's net cash had been inflated by a net gain on minority equity investments which had evaporated in the most recent quarter. However, net income itself has rebounded into positive territory over the period:
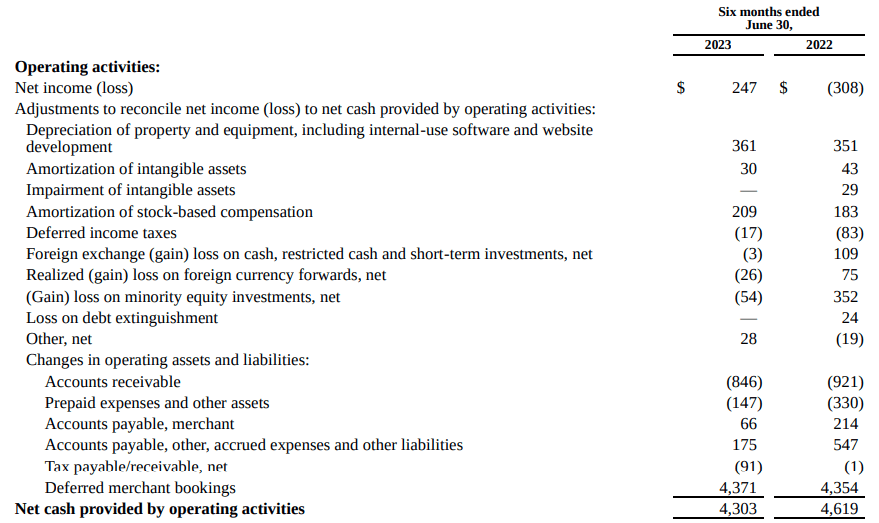
From this standpoint, Expedia Group has been demonstrating an improving cash position over the last year on the whole.
My Perspective
As regards my take on the above results and the implications for the growth trajectory of the stock going forward, the fact that gross bookings have rebounded to 2019 levels is quite welcoming, and what makes this more impressive is the fact that the company's long-term debt load has not had to increase during this time to facilitate such growth.
In this regard, I take the view that Expedia Group is in a good position to fund further growth while concurrently improving balance sheet metrics. While the quick ratio of Expedia Group remains significantly below 1, I take the view that investors will be willing to overlook this for as long as growth in revenue and gross bookings continues and long-term debt to total assets continues to decrease.
ycharts.com
We can see that with a P/E ratio of 17.57 (at a five-year low) and normalized diluted EPS of $5.285 (at a five-year high) - Expedia Group is trading at just above $100 per share.
However, we also observe that with a P/E ratio of just under 50x at the beginning of 2019 and earnings per share between $3-4 over the same period, we can see that the stock was trading between $120-140 over this period.
Should we see earnings growth continue, then I take the view that the P/E ratio is likely to rise above its current level of 17.57x - with a level of near 50x as seen in 2019 being more realistic. On this basis, I judge fair value to be within the $120-140 range as seen at the beginning of 2019.
Risks
In terms of the potential risks to Expedia Group at this time, it is likely that we could see lower gross bookings in Q3 and Q4 due to seasonality and less booking demand following the summer months. From this point of view, growth in the stock itself might be more modest as we head into the final quarter of 2023.
Additionally, given that gross bookings have rebounded to 2019 levels - Expedia is likely to come under more pressure to demonstrate that it has the ability to bolster bookings further. Failing this, the stock might see some downside if growth shows signs of plateauing in this regard.
As regards the Buy thesis specifically - a potential risk impacting this thesis is if we see a slowdown in cash flow growth in spite of continued growth in gross bookings. This could happen if capital expenditures continue rising in order to accommodate further booking growth but we do not see sufficient growth in net cash provided by operating activities to cover increased expenses.
Conclusion
To conclude, my overall view on Expedia Group is that strong growth in gross bookings coupled with a lower long-term debt to total assets ratio serves as evidence that the company is showing a strong recovery.
In particular, I revise my rating from Hold to Buy on the basis of:
- An improving cash flow position and a decline in the long-term debt to total assets ratio
- Improvement in total gross bookings
- Strong recovery in diluted earnings per share
Taking these factors into consideration, I now take a bullish view on Expedia Group.
For further details see:
Expedia: Strong Gross Booking Growth And Balance Sheet Metrics