MSFT - FDRR: Attractive Value And Quality Yet Lagging In Rising Rates
2023-09-19 08:00:00 ET
Summary
- Fidelity® Dividend ETF for Rising Rates holds dividend stocks showing a positive correlation to 10-year U.S. Treasury yields.
- The portfolio has better value and quality metrics than the benchmark.
- The FDRR ETF has lagged the S&P 500 and two popular quality dividend ETFs.
- Based on recent history, it seems classic quality dividend ETFs have a better chance to outperform in rising rates.
This article series aims at evaluating ETFs (exchange-traded funds) regarding the relative past performance of their strategies and metrics of their current portfolios. Reviews with updated data are posted from time to time.
FDRR strategy and portfolio
Fidelity® Dividend ETF for Rising Rates ( FDRR ) started investing operations on 09/12/2016 and tracks the Fidelity Dividend Index for Rising Rates Index. It has a portfolio of 110 stocks, a distribution yield of 2.92% and a total expense ratio of 0.29%. Distributions are paid quarterly.
As described in the prospectus by Fidelity ,
The Fidelity Dividend Index for Rising Rates is designed to reflect the performance of stocks of large and mid-capitalization dividend-paying companies that are expected to continue to pay and grow their dividends and have a positive correlation of returns to increasing 10-year U.S. Treasury yields.
FDRR invests mostly in U.S. based companies (92.6% of asset value), but also in Europe (5.9%) and a bit in Asia. Large companies represent about 82% of assets. Technology is the heaviest sector, and the fund’s sector breakdown is very close to the S&P 500 (SP500). Compared to the large cap benchmark, FDRR slightly underweights consumer discretionary and communication services.
FDRR sector breakdown (Chart: author; data: Fidelity, SSGA)
The top 10 holdings, listed below with fundamental ratios, represent 31.8% of asset value. The fund has a significant exposure to the top 2 names: Apple (8.50%) and Microsoft (7.55%). Risks related to other individual companies are low.
| Ticker |
| Name |
| Weight% |
| EPS growth %TTM |
| P/E TTM |
| P/E fwd |
| Yield% |
| Apple, Inc. |
| 8.5 |
| -1.68 |
| 29.41 |
| 28.89 |
| 0.55 |
| Microsoft Corp. |
| 7.55 |
| 0.42 |
| 34.10 |
| 30.07 |
| 0.82 |
| Broadcom Inc. |
| 2.52 |
| 41.21 |
| 26.28 |
| 20.22 |
| 2.16 |
| UnitedHealth Group, Inc. |
| 2.13 |
| 16.73 |
| 21.77 |
| 19.61 |
| 1.55 |
| Visa, Inc. |
| 2.13 |
| 16.71 |
| 31.13 |
| 27.81 |
| 0.75 |
| JPMorgan Chase & Co. |
| 1.91 |
| 24.77 |
| 9.57 |
| 9.34 |
| 2.69 |
| Johnson & Johnson |
| 1.9 |
| -28.25 |
| 32.71 |
| 15.76 |
| 2.95 |
| Cisco Systems, Inc. |
| 1.79 |
| 8.91 |
| 18.25 |
| 13.80 |
| 2.78 |
| Merck & Co., Inc. |
| 1.74 |
| -81.42 |
| 88.54 |
| 35.63 |
| 2.72 |
| AbbVie, Inc. |
| 1.66 |
| -31.10 |
| 31.24 |
| 13.77 |
| 3.89 |
Historical performance
Since 10/1/2016, FDRR has underperformed the S&P 500 and two popular quality dividend ETFs: Vanguard Dividend Appreciation ETF ( VIG ) and WisdomTree U.S. Quality Dividend Growth Fund ( DGRW ). It also shows a deeper maximum drawdown.
| Total Return |
| Annual.Return |
| Drawdown |
| Sharpe ratio |
| Volatility |
| FDRR |
| 98.66% |
| 10.37% |
| -36.52% |
| 0.63 |
| 16.35% |
| SPY |
| 132.04% |
| 12.86% |
| -33.72% |
| 0.76 |
| 16.54% |
| VIG |
| 119.77% |
| 11.98% |
| -31.72% |
| 0.77 |
| 14.81% |
| DGRW |
| 136.83% |
| 13.19% |
| -32.04% |
| 0.83 |
| 15.33% |
Data calculated with Portfolio123.
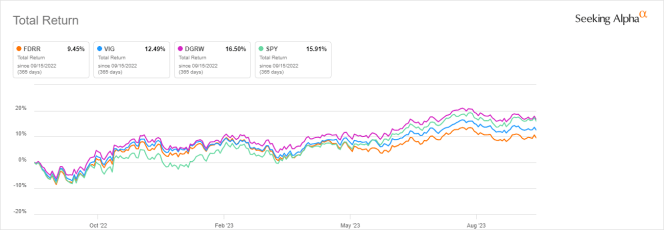
FDRR has also been the worst performer of this list in the last 12 months, despite the 10-year yield rising from 2.90% to 4.17%.
In previous articles, I have shown how three factors may help cut the risk in a dividend portfolio: Return on Assets , Piotroski F-score , and Altman Z-score .
The next table compares FDRR since 10/1/2016 with a subset of the S&P 500: stocks with above-average dividend yield and ROA, a good Altman Z-score, a good Piotroski F-score and a sustainable payout ratio. It is rebalanced annually to make it comparable with a passive index.
| Total Return |
| Annual.Return |
| Drawdown |
| Sharpe ratio |
| Volatility |
| FDRR |
| 98.66% |
| 10.37% |
| -36.52% |
| 0.63 |
| 16.35% |
| Dividend & quality subset |
| 123.82% |
| 12.28% |
| -36.22% |
| 0.71 |
| 17.02% |
Past performance is not a guarantee of future returns. Data Source: Portfolio123.
The dividend quality subset beats FDRR by 1.9 percentage points in annualized total return. However, the fund’s performance is real, and the subset is simulated. My core portfolio holds 14 stocks selected in this subset (more info at the end of this post).
The annual sum of distributions has increased from $0.89 per share in 2017 to $1.10 in 2022. It is a 23.6% growth, beating the cumulative inflation of about 20.4%, based on CPI. The annualized dividend growth rate during this period is 4.4%: it is positive, but not very attractive. In the same time, SPY shows an annualized dividend growth rate of 5.7%, and VIG is at 9.1%.
FDRR distribution history (Seeking Alpha)
Scanning FDRR portfolio
FDRR is cheaper than the S&P 500 ( SPY ) regarding valuation ratios, as reported in the table below.
| FDRR |
| SPY |
| Price/Earnings TTM |
| 15.44 |
| 22.4 |
| Price/Book |
| 2.6 |
| 3.99 |
| Price/Sales |
| 1.82 |
| 2.55 |
| Price/Cash Flow |
| 10.76 |
| 15.81 |
In my ETF reviews, risky stocks are companies with at least 2 red flags among: bad Piotroski score, negative ROA, unsustainable payout ratio, bad or dubious Altman Z-score, excluding financials and real estate where these metrics are unreliable. With these assumptions, risky stocks weigh about 10% of asset value, which is acceptable.
Based my calculation of aggregate metrics, the return on assets is much better than the benchmark, whereas the two accounting scores are not far from it. These metrics point to a portfolio quality superior to the S&P 500.
| FDRR |
| SPY |
| Altman Z-score |
| 4.15 |
| 3.5 |
| Piotroski F-score |
| 5.68 |
| 5.69 |
| ROA % TTM |
| 10.97 |
| 7.03 |
Takeaway
Fidelity Dividend ETF For Rising Rates holds dividend stocks showing a positive correlation to 10-year U.S. Treasury yields. The fund’s sector breakdown is very close to the S&P 500, but the portfolio shows better value and quality metrics than the benchmark. Nonetheless, FDRR has underperformed the S&P 500 and two popular quality dividend ETFs since inception, and also in the last 12 months, despite rising rates. The dividend growth rate is ahead of inflation, but behind the competition. Based on recent history, it seems classic quality dividend ETFs like VIG and DGRW have a better chance to outperform in rising rates.
For further details see:
FDRR: Attractive Value And Quality, Yet Lagging In Rising Rates