GOOGL - Fiduciary Management Q2 2023 Investment Letter
2023-07-14 04:30:00 ET
Summary
- Fiduciary Management, Inc. is an independent money management firm. FMI’s equity investing strategies apply a value discipline, with a focused approach firmly rooted in fundamental research.
- FMI’s Small Cap and International Strategies have comfortably outperformed their respective benchmarks despite the relative headwind.
- FMI’s Large Cap Strategy has outpaced the iShares Russell 1000 Value ETF1 but has not kept up with a top-heavy, tech-driven S&P 500 Index.
INVESTMENT STRATEGY OUTLOOK - June 30, 2023
Global equity markets continued to advance in the second quarter, despite slower economic growth, stubbornly elevated inflation, the steepest global interest-rate hiking cycle in four decades, and record debt levels. Remarkably, in the wake of the banking turmoil in the U.S. and Europe, animal spirits have reignited, with growth outperforming value by a wide margin in the first half of 2023, particularly in the U.S. Large Cap universe. Old habits die hard, though we don't believe the recent knee-jerk reaction will last. Year-to-date, FMI's Small Cap and International Strategies have comfortably outperformed their respective benchmarks despite the relative headwind. FMI's Large Cap Strategy has outpaced the iShares Russell 1000 Value ETF 1 but has not kept up with a top-heavy, tech-driven S&P 500 Index. While investors have lurched back to what's "working" with a renewed fear of missing out ((FOMO)), it may just be a matter of time before the select few stocks supercharging the S&P 500 normalize. FMI's second-quarter performance commentary is outlined below:
FMI Small Cap Equity
The FMI Small Cap Strategy gained approximately 6.0% (gross) / 5.8% (net), compared to an increase of 5.21% and 3.18% in the Russell 2000 Index and Russell 2000 Value Index, respectively. Relative to the Russell 2000, sectors that contributed to the performance included Finance, Distribution Services, and Producer Manufacturing, while Commercial Services, Retail Trade, and a lack of exposure to Health Technology detracted. A significant underweight in banking has benefited the relative comparison. Stock performance was driven by Beacon Roofing Supply Inc. ( BECN ), Simpson Manufacturing Co. Inc. ( SSD ), and Triton International Ltd. ( TRTN ) (being acquired by year-end), as Genpact Ltd. ( G ), BJ's Wholesale Club Holdings Inc. ( BJ ), and Robert Half Intl. Inc. ( RHI ) each lagged. Quality has been hard to come by in the Small Cap space in recent years, with extensive M&A activity by private equity thinning out the opportunity set. Disciplined stock picking through this environment has been critical.
FMI Large Cap Equity
The FMI Large Cap Strategy gained approximately 5.7% (gross) / 5.6% (net), compared to an increase of 8.74% and 4.08% in the S&P 500 and iShares Russell 1000 Value ETF¹, respectively. Relative to the S&P 500, sectors that were additive to the performance included Health Technology, Producer Manufacturing, and a lack of exposure to Energy Minerals, while Technology Services, Electronic Technology, and Retail Trade detracted. CarMax Inc. ( KMX ), Alphabet Inc. Cl A ( GOOGL ), and Masco Corp. ( MAS ) contributed, while Dollar General Corp. ( DG ), Northern Trust Corp. ( NTRS ), and CDW Corp. ( CDW ) each disappointed, despite what we feel are attractive long-term prospects. Approximately 80% of the S&P 500's year-to-date return has been generated by only ten stocks, while the iShares Russell 1000 Value ETF¹ ( IWD ) has lagged its growth counterpart by nearly 24%. Today, the S&P 500 is the most concentrated it has been since 1990, with the top five firms ([[AAPL]], [[MSFT]], [[AMZN]], [[GOOG]], [[NVDA]]) comprising ~24% of the index.
FMI All Cap Equity
The FMI All Cap Strategy gained approximately 4.3% (gross) / 4.2% (net), compared to an increase of 8.38% for the iShares Russell 3000 ETF¹ ( IWV ). Relative to the iShares Russell 3000¹, sectors that benefited performance included Health Technology, Distribution Services, and Consumer Non-Durables, while Electronic Technology, Retail Trade, and Commercial Services detracted. CarMax Inc., Alphabet Inc. Cl A, and Beacon Roofing added to performance, while Northern Trust Corp., Genpact Ltd., and BJ's Wholesale Club Holdings Inc., underperformed in the quarter. Similar to the S&P 500, year-to-date the Russell index has also been one-sided in performance and concentration levels.
FMI International Equity
The FMI International Strategies gained approximately 5.5% (gross) / 5.3% (net) on a currency hedged basis and 5.2% (gross) / 5.0% (net) currency unhedged, compared with the iShares Currency Hedged MSCI EAFE ETF¹ ( HEFA ) increase of 5.20% and iShares MSCI EAFE ETF¹ ( EFA ) of 3.25%. The iShares MSCI EAFE Value ETF¹ ( EFV ) gained 3.62% over the same period. Relative to the iShares MSCI EAFE ETF¹, sectors that aided performance included Retail Trade, Electronic Technology, and Health Technology, while Commercial Services, Consumer Non-Durables, and Consumer Durables weighed. Top individual contributors included B&M European Value Retail S.A. ( BMRRY ), Ferguson plc ( FERG ), and Sodexo S.A. ( SDXOF ), as Nabtesco Corp. ( NCTKF ), DBS Group Holdings Ltd. ( DBSDF ), and DKSH Holding AG ( DKSHF ) did not keep pace. A recovery in several healthcare holdings (Koninklijke Philips N.V. ( PHG ), Fresenius Medical Care AG & Co. KGaA ( FMS ), Smith & Nephew plc ( SNN )) has also helped the relative performance in the period. USD appreciation was a slight tailwind for FMI's currency-hedged portfolio.
Melt-Up
Markets move in cycles and today investors are throwing money hand-over-fist at the technology sector. Generative artificial intelligence ((AI)) has lit the sector ablaze. While generative AI has the potential to be a game-changer for many industries, it is in the early stages of adoption, and it will likely be some time before the long-term opportunities and risks are fully understood. Though there is no shortage of hype, the commercial revenue projections over the next five years could be overblown. In the U.S., the ten largest U.S.-listed tech companies by market value have generated an average year-to-date return of 74%, compared with an S&P 500 equal-weighted index that has gained just 7%! As illustrated in the graphic on the left, the top-performing themes in the U.S. speak to the speculative nature of the market.
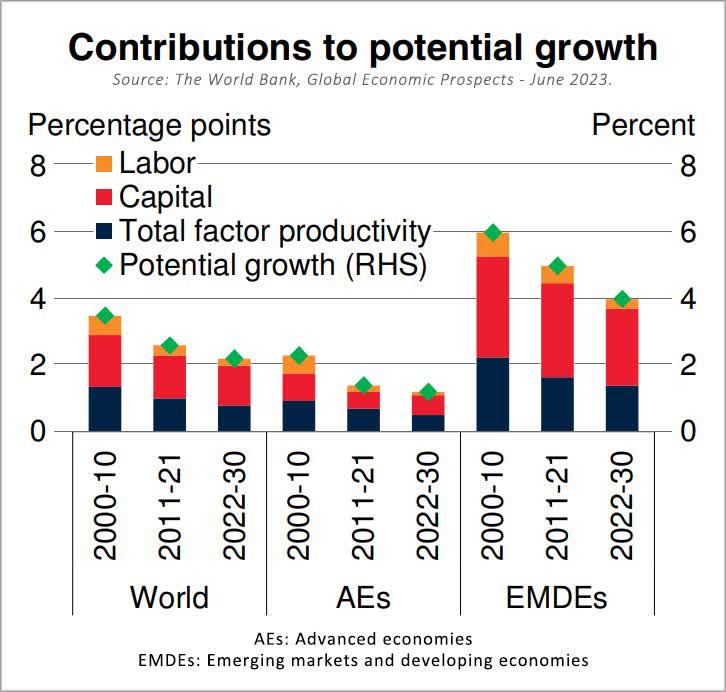
As a percentage of the S&P 500, technology represents almost three times the sector's size in the U.S. economy (10.3% of GDP). We find it interesting that despite all the advances in technology in recent decades, productivity and economic growth have been below historical levels, both in the U.S. and globally, and are expected to weaken further (see World Bank projections on the left). How can this be the case if new technology is so great? We suspect part of the explanation is that there's been heavy technology investment in entertainment (social media, gaming, streaming, virtual reality, etc.), which does little to make people more productive. Generative AI could certainly change the path of travel.
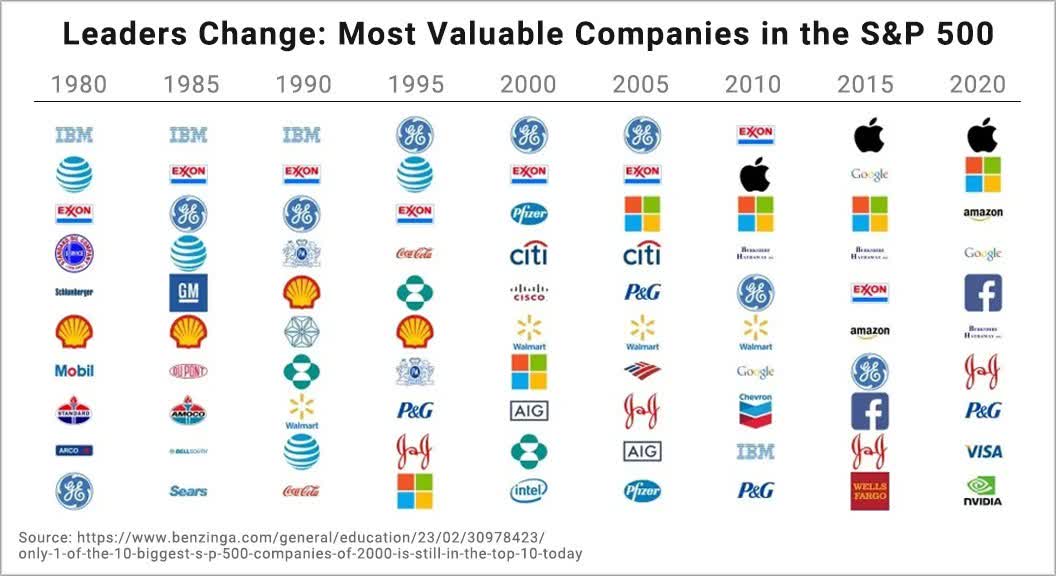
An important question that investors ought to consider: are the winners of today going to be the winners of tomorrow? History would prove skeptical, as can be observed in the graphic below. Only one out of the top ten companies in the S&P 500 in 2000 was still in the top ten 20 years later. Historically, leaders change over time. Success invites competition and innovation can lead to disintermediation. Despite what may appear to be strong competitive positioning and growth prospects, any stock can get too expensive, and any trade can become overcrowded. In the 1970s, the "Nifty Fifty" was believed to be the best of the best; no price was too high for these businesses, and everyone piled in. In the 2000 tech bubble, many companies were also thought to be unassailable. In times of euphoria, lessons from the past are quickly forgotten.
Rather than pay up for popular stocks, FMI purchases what we view as high-quality compounders that trade at attractive absolute valuations, where the success of the investment is not reliant on meeting extremely high growth expectations, discounting cash flows at ultra-low discount rates, or sustaining elevated valuation multiples.
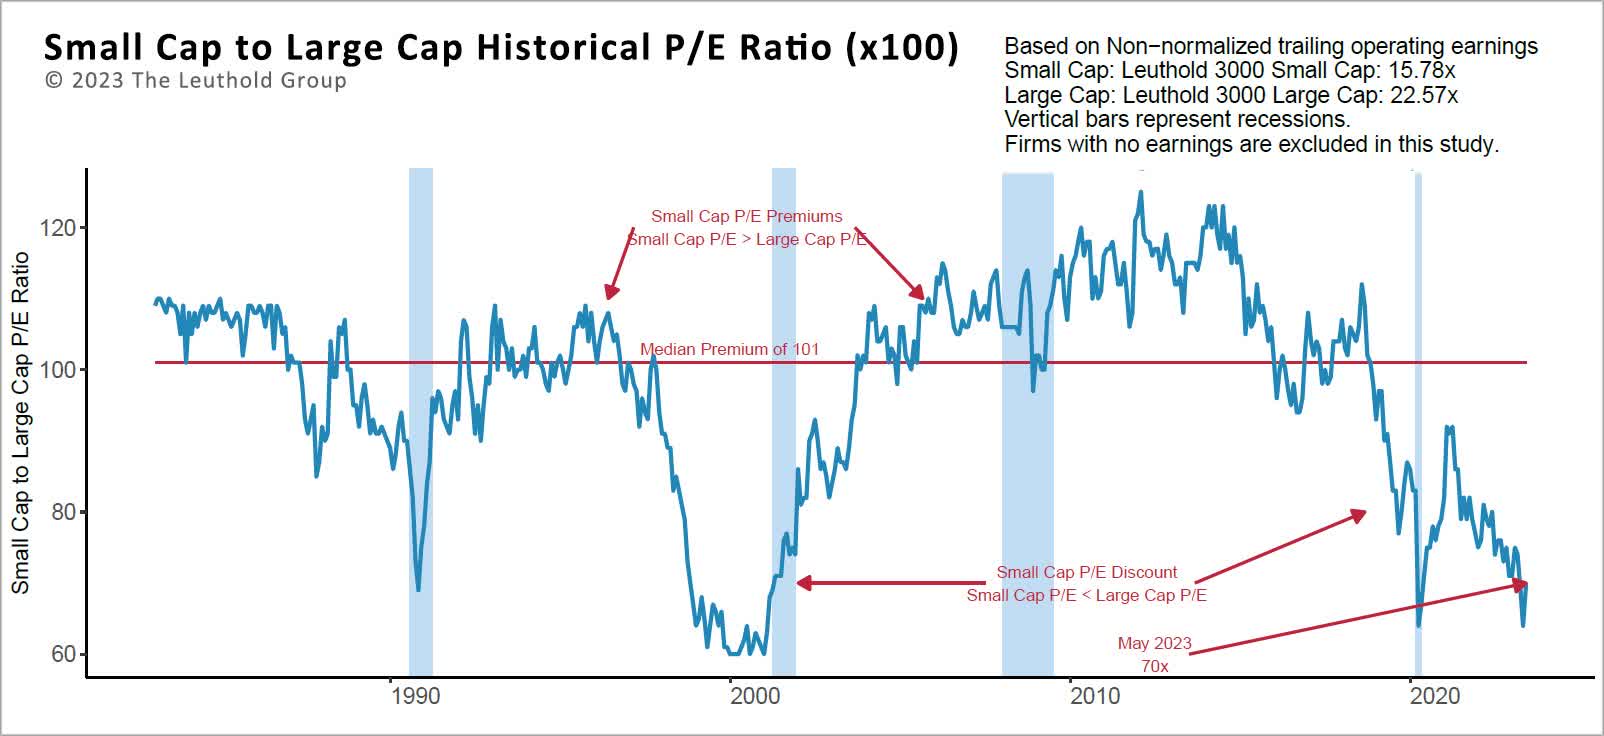
Despite the recent performance in U.S. Small Cap and International equities, relative valuations in U.S. Large Cap are still (and have become more) stretched. The valuation divergences are approaching historical highs. As illustrated above, profitable U.S. Small Cap stocks are trading close to the largest discount to U.S. Large Cap stocks in over 40 years.
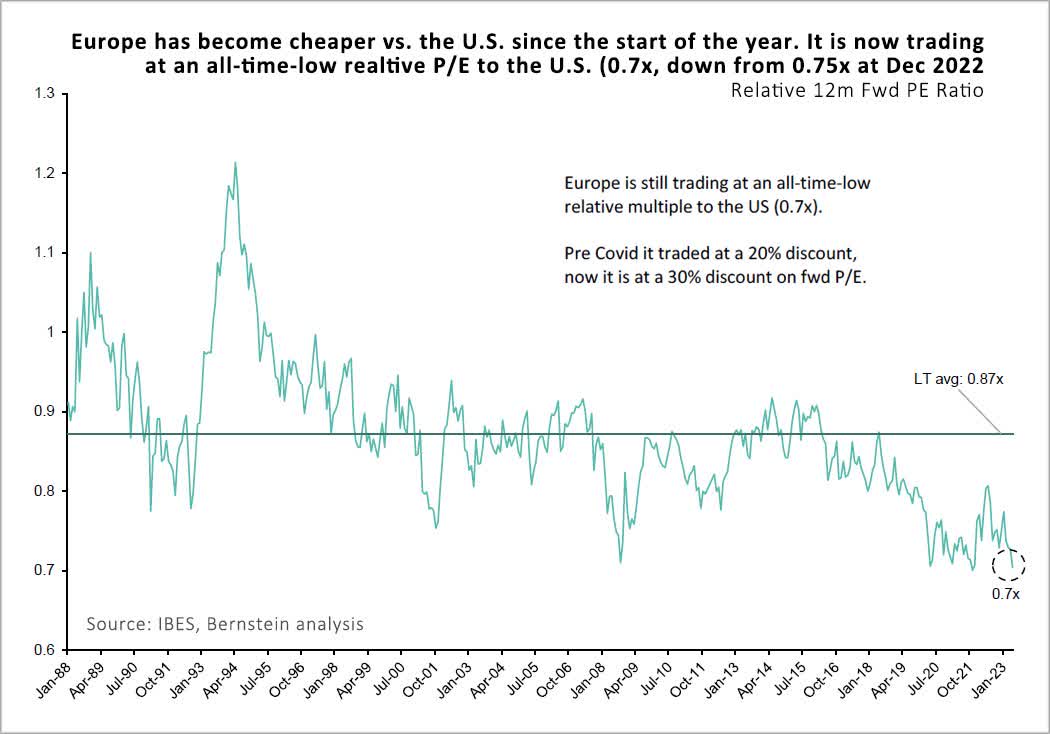
Similarly, European stocks now trade at an all-time discount to the U.S. (illustrated below). To be fair, economic growth in the U.S. has been much stronger than in Europe over the last 15 years, so some of this discount is warranted. Per the Financial Times, "In 2008 the EU's economy was somewhat larger than America's: $16.2tn versus $14.7tn. By 2022, the US economy had grown to $25tn, whereas the EU and the UK together had only reached $19.8tn. America's economy is now nearly one-third bigger." GDP projections in the coming years are a lot more comparable, with the U.S. expected to grow 1.6% in 2023 and 1.0% in 2024, while the Eurozone is expected to grow 0.9% and 1.5%, respectively, according to the OECD. At the very least, a ~30% cheaper valuation should give investors in European equities some margin for error.
Ironically, despite slowing earnings growth, significant concentration risk, and what we view as expensive valuations, investors continue to funnel into the S&P 500. We think the S&P 500 carries a lot more risk than is commonly perceived. Furthermore, just as passive inflows can add fuel to the fire in a rising market, passive outflows can have the reverse effect during a decline. Investors appear to be capitulating on sensible value ideas and chasing the few growth stocks that have been winning in the stock market. They take comfort in the crowd behavior and want to own what's been doing well. Despite the history, they can't help themselves.
Virtues of Value Investing
Value investing has nearly a 100-year history of success, with academic studies and empirical evidence supporting the case for long-term outperformance. That said, we are currently in one of the worst periods for value on record, as a confluence of factors has benefited growth and momentum investing, including years of suppressed interest rates (and discount rates), large-scale central bank asset purchases (quantitative easing, or QE), and a massive shift from active to passive investing, among others. An absence of price discovery and a lack of regard for valuation has led to significant asset price inflation. Fortunately, the backdrop is changing as interest rates are normalizing, QE has largely come to an end (Japan is an exception), and the shift to passive may be maturing, all of which should bode well for stock picking.
We have great confidence that a value-oriented approach will win out in the end. Why? Human nature. Inevitably, fear and greed will play a role in investor behavior. On the way up, investors become too optimistic, gain comfort in numbers (herd behavior), and chase the best-performing stocks, which can lead to long periods where a stock or the market can become significantly overpriced. Conversely, amidst volatility, investors can be overly pessimistic and overwhelmed by the fear of losing money. Risk aversion takes hold and selling begets selling. Again, business fundamentals are disregarded, this time leading to depressed valuations that are well below intrinsic value. Over a full cycle, markets are relatively efficient: eventually investors come to their senses and valuations settle in around fair value. While unnerving, dislocations can create exciting opportunities, but most investors aren't patient. As we have highlighted in prior letters, the DALBAR 2 studies show that the average investor consistently underperforms the market, doing the wrong things at the wrong times. Flows tend to follow the performance.
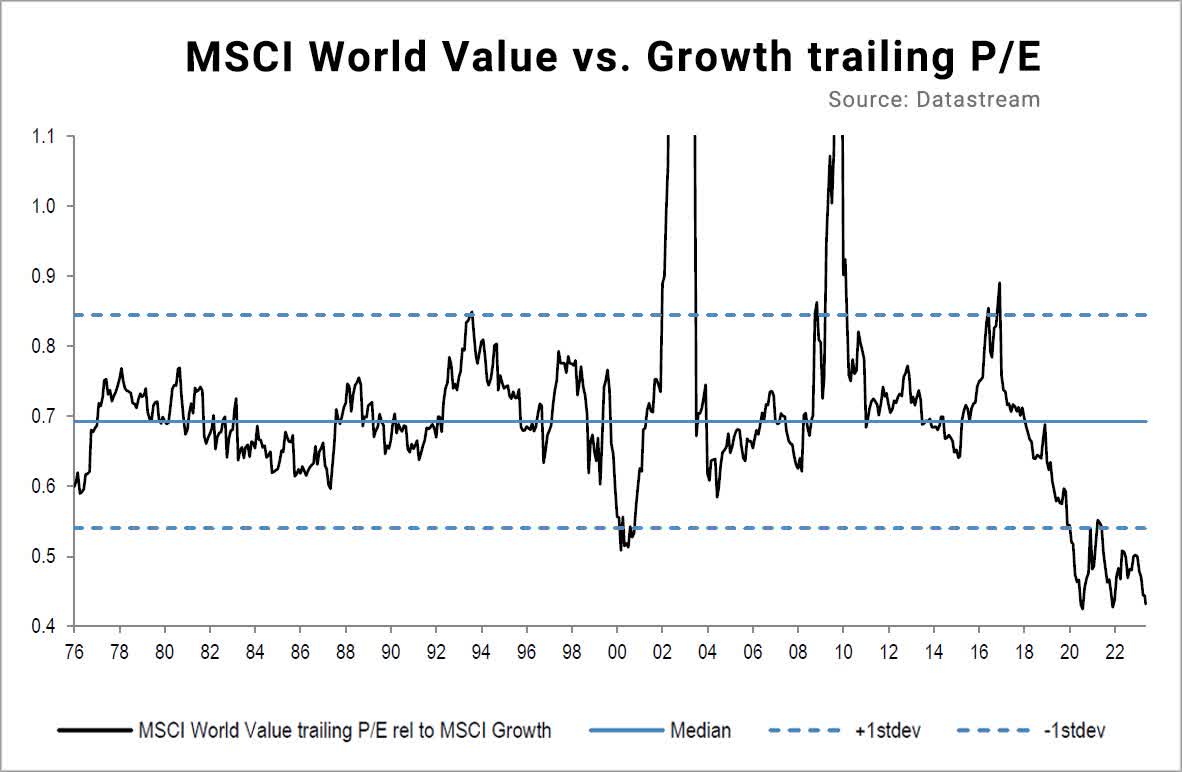
We continue to believe that a disciplined approach, which is rooted in fundamental analysis and uses valuation as its guidepost, provides an opportunity to outperform over the long term. As illustrated below, the valuation premium for growth versus value is near a 50-year high (using price-to-earnings) - almost a 2-standard deviation move. Any semblance of a reversion to the mean should lead to much better days ahead for those with a value orientation. Though it's impossible to know, it feels like we are in the later innings of the cycle for U.S. Large Caps, while U.S. Small Caps and International Large Caps appear less distended.
Across the world, we believe value investing's recent struggles are the exception, not the rule. With a normalization of interest rates, profitability, and valuations should matter over time. We own a collection of high-quality businesses, with strong balance sheets, that trade at a discount to the market and our estimates of intrinsic value, giving us confidence in our opportunity to outperform in the coming years.
Below we highlight several portfolio holdings where we are finding value:
Robert Half International - Small Cap/All Cap
RHI is the market leader in professional staffing for small and medium-sized businesses. The company has a premier temporary and permanent placement franchise in the field of accounting (Accountemps) and finance, while its Protiviti business has become a strong domestic and international consultancy. RHI's reinvestment in technology, including its national database, candidate performance scoring, and proprietary AI and matching capabilities are driving share gains versus fragmented competition. The business model is asset-light and generates consistently strong returns on capital, industry-leading margins, and free cash flow. The less cyclical Protiviti business accounts for 30% of income. Capital allocation at RHI has been focused on reinvestment, share repurchases, and dividend increases. These factors should result in less overall cyclicality in EPS going forward. The shares are off 40% from their 2022 highs. We feel that the discounted valuation is reflective of current recession worries, which could lower demand for labor. Additionally, there are concerns about AI and the disruption that it could have on accounting. Our view is that the sentiment around the latter appears overdone, as demand for accountants has increased over time despite major advances in productivity tools.
CDW Corporation - Large Cap/All Cap
CDW is a simple business with strong returns on capital, serving a growing global information technology ((IT)) industry. As a reseller of IT solutions, the company gives investors exposure to technology growth without subjecting them to the short product cycles, cutthroat competition, and poor capital allocation decisions that are typically inherent in technology investments. While the largest player in the industry, CDW only commands a small ~5% share of the North American IT market. We believe they can capture more market share moving forward as their size and scale create competitive advantages, making them difficult to compete against, particularly for the smaller regional players that make up the majority of the market. The company's margins should also expand over time as they sell more software, services, and solutions to end customers. CDW's fundamentals currently reflect a slowdown in North American corporate IT spending; we believe this will prove to be a cyclical headwind that will dissipate over time. Strong execution along with a recovery in customer spending should give CDW the ability to generate double-digit earnings per share growth annually over our investment time horizon. We believe the shares are trading at a reasonable multiple on depressed earnings.
Roche Holdings (ROG-CH) - International
Roche ( RHHBY ) is the world's largest biotechnology company and the global leader in in-vitro diagnostics. In an industry that struggles to earn its cost of capital, Roche is an outlier. Roche's superior return profile has benefited from a superior R&D organization and family control, which we believe has allowed management to take a long-term view and avoid the large, value-destructive acquisitions that have hurt peer returns. Despite the R&D organization's long track record of success, there have been a few recent pipeline drug setbacks that have weighed on the stock and depressed the valuation. We view these as temporary setbacks which are common for an R&D organization that focuses on first-in-class or best-in-class drugs in areas of significant unmet need. Importantly, we forecast revenue growth through 2027 based solely on the existing drug portfolio and diagnostics business without any contribution from pipeline drugs. Any pipeline drug contribution would add to this underlying growth, and our research suggests there are a handful of meaningful opportunities. The market is underappreciating this durable revenue growth outlook. We feel that the current valuation is very attractive for this high-quality company.
-------
Thank you for your continued support of Fiduciary Management, Inc.
Small Cap Equity Composite 12/31/2012 ? 12/31/2022
| Year |
| Total Return Gross of |
| Total Return Net of |
| *Benchmark Return % |
| Number of Portfolios |
| Dispersion % |
| Three Year Ex?Post Standard Deviation |
| Total Composite Assets End of Period |
| Total Firm Assets End of Period |
| Percentage of Firm Assets % |
| Composite |
| *Benchmark |
| ($ millions) |
| ($ millions) |
| 2013 |
| 33.43 |
| 32.33 |
| 38.82 |
| 180 |
| 1.04 |
| 0.1251 |
| 0.1645 |
| $2,801.8 |
| $19705.3 |
| 0.1422 |
| 2014 |
| 7.99 |
| 7.06 |
| 4.89 |
| 178 |
| 0.39 |
| 0.0965 |
| 0.1312 |
| $3,006.5 |
| $21001.1 |
| 0.1432 |
| 2015 |
| ?5.72 |
| ?6.52 |
| ?4.41 |
| 171 |
| 0.34 |
| 0.1118 |
| 0.1398 |
| $2,597.2 |
| $21042.9 |
| 0.1234 |
| 2016 |
| 21.65 |
| 20.65 |
| 21.31 |
| 171 |
| 0.46 |
| 0.1202 |
| 0.1577 |
| $2,596.0 |
| $22626.7 |
| 0.1147 |
| 2017 |
| 15.42 |
| 14.49 |
| 14.65 |
| 171 |
| 0.84 |
| 0.1112 |
| 0.1391 |
| $2,774.0 |
| $25322 |
| 0.1096 |
| 2018 |
| ?8.10 |
| ?8.83 |
| ?11.01 |
| 160 |
| 0.74 |
| 0.1173 |
| 0.1579 |
| $2,220.4 |
| $19833.6 |
| 0.112 |
| 2019 |
| 27.14 |
| 26.17 |
| 25.53 |
| 119 |
| 1.83 |
| 0.1244 |
| 0.1571 |
| $2,415.0 |
| $22609.9 |
| 0.1068 |
| 2020 |
| 4.40 |
| 3.60 |
| 19.96 |
| 104 |
| 1.49 |
| 0.2115 |
| 0.2527 |
| $2,079.2 |
| $16284.2 |
| 0.1277 |
| 2021 |
| 31.74 |
| 30.77 |
| 14.82 |
| 102 |
| 0.6 |
| 0.2111 |
| 0.2335 |
| $2,294.9 |
| $17068.4 |
| 0.1345 |
| 2022 |
| ?4.98 |
| ?5.70 |
| ?20.40 |
| 96 |
| 0.29 |
| 0.2276 |
| 0.2602 |
| $2,173.9 |
| $13021.5 |
| 0.1669 |
*Benchmark: Russell 2000 Index®
Returns reflect the reinvestment of dividends and other earnings.
The above table reflects past performance. Past performance does not guarantee future results. A client's investment return may be lower or higher than the performance shown above. Clients may suffer an investment loss.
Fiduciary Management, Inc. claims compliance with the Global investment Performance Standards (GIPS®) and has prepared and presented this report in compliance with the GIPS standards. Fiduciary Management, Inc. has been independently verified for the periods 12/31/1993 ? 12/31/2022. A firm that claims compliance with the GIPS standards must establish policies and procedures for complying with all the applicable requirements of the GIPS standards. Verification provides assurance on whether the firm's policies and procedures related to composite and pooled fund maintenance, as well as the calculation, presentation, and distribution of performance, have been designed in compliance with the GIPS standards and have been implemented on a firm?wide basis. The Small Cap Equity Composite has had a performance examination for the periods 12/31/1993 ? 12/31/2022. The verification and performance examination reports are available upon request.
FMI was founded in 1980 and is an independent investment counseling firm registered with the SEC and the State of Wisconsin. The firm manages over $13.0 billion in assets of pension and profit-sharing trusts, mutual funds, Taft?Hartley funds, insurance company portfolios, endowments, and personal trusts. The firm includes both institutional and mutual fund businesses. Although the firm has participated in wrap programs, it is a separate and distinct business and is excluded from firm?wide assets.
The FMI Small Cap Equity Composite was created and incepted in January 1980. These accounts primarily invest in small to medium-capitalization US equities.
The FMI Small Cap Equity Composite reflects time?weighted and asset?weighted returns for all discretionary accounts, with a market value greater than $500,000 as of month end. A small percentage of composite assets (typically ranging from 0?5%) historically has been invested in unmanaged fixed-income securities at the direction of account holders. From December 31, 1993 thru September 30, 2002, all accounts included were managed for at least one quarter, from October 1, 2002, to present all accounts were managed for at least one month. All returns are calculated using United States Dollars and are based on monthly valuations using trade date accounting. All accounts in this composite are fee-paying. Gross of fees returns are calculated gross of management fees, gross of custodial fees, gross of withholding taxes, and net of transaction costs. Net of fees returns are calculated net of actual management fees and transaction costs and gross of custodial fees and withholding taxes. Dispersion is calculated using the equal-weighted standard deviation of all accounts in the composite for the entire period. As of 12/31/2011, the trailing three-year annualized ex?post standard deviation for the Composite and Benchmark are required to be stated per GIPS®. FMI uses gross returns to calculate these.
Currently, the advisory fee structure for the FMI Small Cap Equity Composite portfolios is as follows:
Up to $25,000,000 0.85%
$25,000,001?$50,000,000 0.80%
$50,000,001?$100,000,000 0.70%
$100,000,001 and above 0.60%
The firm generally requires a minimum of $3 million in assets to establish a discretionary account. High Net Worth individuals may establish an account with a minimum of $1,000,000, however, the firm reserves the right to charge a minimum dollar fee for High Net Worth individuals depending on the client servicing involved. The minimum account sizes do not apply to new accounts for which there is a corporate, family, or other substantial relationship to existing accounts. In addition, the firm reserves the right to waive the minimum account size and minimum annual fee under certain circumstances. A complete list and description of all firm composites and FMI-distributed mutal funds are available upon request. Policies for valuing portfolios, calculating performance, and preparing compliant presentations are available upon request.
The Russell 2000 Index® measures the performance of the small?cap segment of the U.S. equity universe. The Russell 2000 Index is a subset of the Russell 3000® Index representing approximately 8% of the total market capitalization of that index. It includes approximately 2,000 of the smallest securities based on a combination of their market cap and current index membership. The Small Cap Equity composite uses the Russell 2000 Index® as its primary index comparison.
GIPS® is a registered trademark of CFA Institute. CFA Institute does not endorse or promote this organization, nor does it warrant the accuracy or quality of the content contained herein.
Large Cap Equity Composite 12/31/2012 ? 12/31/2022
| Year |
| Total Return Gross of Fees % |
| Total Return Net of Fees % |
| *Benchmark Return % |
| Number of Portfolios |
| Dispersion % |
| Three Year Ex?Post Standard Deviation |
| Total Composite Assets End of Period ($ millions) |
| Total Firm Assets End of Period ($ millions) |
| Percentage of Firm Assets % |
| Composite |
| *Benchmark |
| 2013 |
| 31.87 |
| 31.10 |
| 32.39 |
| 685 |
| 0.31 |
| 11.38% |
| 11.94% |
| $ 15,785.5 |
| $ 19,705.3 |
| 80.11% |
| 2014 |
| 13.52 |
| 12.81 |
| 13.69 |
| 725 |
| 0.25 |
| 8.54% |
| 0.0898 |
| $ 16,084.1 |
| $ 21,001.1 |
| 76.59% |
| 2015 |
| ?1.54 |
| ?2.16 |
| 1.38 |
| 655 |
| 0.27 |
| 9.94% |
| 10.48% |
| $ 14,304.1 |
| $ 21,042.9 |
| 67.98% |
| 2016 |
| 14.85 |
| 14.16 |
| 11.96 |
| 636 |
| 0.32 |
| 10.48% |
| 10.59% |
| $ 12,562.9 |
| $ 22,626.7 |
| 55.52% |
| 2017 |
| 19.90 |
| 19.24 |
| 21.83 |
| 628 |
| 0.32 |
| 9.70% |
| 0.0992 |
| $ 12,722.2 |
| $ 25,322.0 |
| 50.24% |
| 2018 |
| ?3.07 |
| ?3.62 |
| ?4.38 |
| 540 |
| 0.29 |
| 9.85% |
| 10.80% |
| $ 9,901.1 |
| $ 19,833.6 |
| 49.92% |
| 2019 |
| 24.58 |
| 23.94 |
| 31.49 |
| 371 |
| 0.42 |
| 9.95% |
| 11.93% |
| $ 10,493.0 |
| $ 22,609.9 |
| 46.41% |
| 2020 |
| 11.32 |
| 10.70 |
| 18.40 |
| 266 |
| 0.55 |
| 17.09% |
| 18.53% |
| $ 8,684.6 |
| $ 16,284.2 |
| 53.33% |
| 2021 |
| 19.33 |
| 18.77 |
| 28.71 |
| 219 |
| 0.32 |
| 17.08% |
| 17.17% |
| $ 9,177.4 |
| $ 17,068.4 |
| 53.77% |
| 2022 |
| ?13.29 |
| ?13.71 |
| ?18.11 |
| 177 |
| 0.33 |
| 19.94% |
| 20.87% |
| $ 6,054.5 |
| $ 13,021.5 |
| 46.50% |
*Benchmark: S&P 500 Index®
Returns reflect the reinvestment of dividends and other earnings.
The above table reflects past performance. Past performance does not guarantee future results. A client's investment return may be lower or higher than the performance shown above. Clients may suffer an investment loss.
Fiduciary Management, Inc. claims compliance with the Global investment Performance Standards (GIPS®) and has prepared and presented this report in compliance with the GIPS standards. Fiduciary Management, Inc. has been independently verified for the periods 12/31/1993 ? 12/31/2022. A firm that claims compliance with the GIPS standards must establish policies and procedures for complying with all the applicable requirements of the GIPS standards. Verification provides assurance on whether the firm's policies and procedures related to composite and pooled fund maintenance, as well as the calculation, presentation, and distribution of performance, have been designed in compliance with the GIPS standards and have been implemented on a firm?wide basis. The Large Cap Equity Composite has had a performance examination for the periods 12/31/2000 ? 12/31/2022. The verification and performance examination reports are available upon request.
FMI was founded in 1980 and is an independent investment counseling firm registered with the SEC and the State of Wisconsin. The firm manages over $13.0 billion in assets of pension and profit-sharing trusts, mutual funds, Taft?Hartley funds, insurance company portfolios, endowments, and personal trusts. The firm includes both institutional and mutual fund business. Although the firm has participated in wrap programs, it is a separate and distinct business and is excluded from firm?wide assets.
The FMI Large Cap Equity Composite was created and incepted on 12/31/2000. These accounts primarily invest in medium to large-capitalization US equities.
The FMI Large Cap Equity Composite reflects time?weighted and asset?weighted returns for all discretionary accounts with a market value greater than $500,000 as of month end beginning January 1, 2012. From December 31, 2000 thru September 30, 2002 all accounts included were managed for at least one quarter, from October 1, 2002 to present all accounts were managed for at least one month. All returns are calculated using United States Dollars and are based on monthly valuations using trade date accounting. All accounts in this composite are fee paying. Gross of fees returns are calculated gross of management fees, gross of custodial fees, gross of withholding taxes and net of transaction costs. Net of fees returns are calculated net of actual management fees and transaction costs and gross of custodial fees and withholding taxes. Dispersion is calculated using the equal weighted standard deviation of all accounts in the composite for the entire period. As of 12/31/2011, the trailing three year annualized ex?post standard deviation for the Composite and Benchmark are required to be stated per GIPS®. FMI uses gross returns to calculate these.
Currently, the advisory fee structure for the FMI Large Cap Equity Composite portfolios is as follows:
Up to $25,000,000 0.55%
$25,000,001?$50,000,000 0.50%
$50,000,001?$100,000,000 0.45%
$100,000,001 and above 0.35%
The firm generally requires a minimum of $3 million in assets to establish a discretionary account. High Net Worth individuals may establish an account with a minimum of $1,000,000, however, the firm reserves the right to charge a minimum dollar fee for High Net Worth individuals depending on the client servicing involved. The minimum account sizes do not apply to new accounts for which there is a corporate, family, or other substantial relationship to existing accounts. In addition, the firm reserves the right to waive the minimum account size and minimum annual fee under certain circumstances. A complete list and description of all firm composites and FMI-distributed mutual funds are available upon request. Policies for valuing portfolios, calculating performance, and preparing compliant presentations are available upon request.
The S&P 500 Index® is widely regarded as the best single gauge of the U.S. equities market. This index includes 500 leading companies in leading industries of the U.S. economy. Although the S&P 500® focuses on the large-cap segment of the market, with approximately 75% coverage of U.S. equities, it is also an ideal proxy for the total market. The Large Cap Equity composite uses the S&P 500 Index® as its primary index comparison.
GIPS® is a registered trademark of CFA Institute. CFA Institute does not endorse or promote this organization, nor does it warrant the accuracy or quality of the content contained herein.
All Cap Equity Composite 12/31/2012 ? 12/31/2022
| Year |
| Total Return Gross of Fees % |
| Total Return Net of Fees % |
| *Benchmark Return % |
| Number of Portfolios |
| Dispersion % |
| Three-Year Ex?Post Standard |
| Total Composite Assets End of Period ($ millions) |
| Total Firm Assets End of Period Period ($ millions) |
| Percentage of Firm Assets % |
| Composite |
| *Benchmark |
| 2013 |
| 29.61 |
| 28.70 |
| 33.01 |
| 35 |
| 0.69 |
| 11.72% |
| 12.29% |
| $ 211.6 |
| $ 19,705.3 |
| 1.07% |
| 2014 |
| 12.65 |
| 11.91 |
| 12.41 |
| 41 |
| 0.31 |
| 8.43% |
| 9.17% |
| $ 268.0 |
| $ 21,001.1 |
| 1.28% |
| 2015 |
| ?0.14 |
| ?0.82 |
| 0.33 |
| 42 |
| 0.45 |
| 9.70% |
| 10.55% |
| $ 263.7 |
| $ 21,042.9 |
| 1.25% |
| 2016 |
| 16.71 |
| 15.90 |
| 12.63 |
| 39 |
| 0.37 |
| 10.50% |
| 10.97% |
| $ 275.9 |
| $ 22,626.7 |
| 1.22% |
| 2017 |
| 18.56 |
| 17.75 |
| 20.97 |
| 35 |
| 0.35 |
| 9.66% |
| 10.17% |
| $ 258.8 |
| $ 25,322.0 |
| 1.02% |
| 2018 |
| ?5.05 |
| ?5.70 |
| ?5.42 |
| 34 |
| 0.38 |
| 10.08% |
| 11.15% |
| $ 212.8 |
| $ 19,833.6 |
| 1.07% |
| 2019 |
| 27.65 |
| 26.87 |
| 30.66 |
| 20 |
| 0.83 |
| 10.29% |
| 12.09% |
| $ 208.5 |
| $ 22,609.9 |
| 0.92% |
| 2020 |
| 7.19 |
| 6.59 |
| 20.55 |
| 21 |
| 0.49 |
| 18.11% |
| 19.24% |
| $ 206.6 |
| $ 16,284.2 |
| 1.27% |
| 2021 |
| 23.72 |
| 23.02 |
| 25.53 |
| 18 |
| 0.36 |
| 18.19% |
| 17.79% |
| $ 225.9 |
| $ 17,068.4 |
| 1.32% |
| 2022 |
| ?10.66 |
| ?11.16 |
| ?19.28 |
| 16 |
| 0.48 |
| 20.58% |
| 21.39% |
| $ 180.4 |
| $ 13,021.5 |
| 1.39% |
*Benchmark: iShares Russell 3000 ETF®
Returns reflect the reinvestment of dividends and other earnings.
The above table reflects past performance. Past performance does not guarantee future results. A client's investment return may be lower or higher than the performance shown above. Clients may suffer an investment loss.
Fiduciary Management, Inc. claims compliance with the Global investment Performance Standards (GIPS®) and has prepared and presented this report in compliance with the GIPS standards. Fiduciary Management, Inc. has been independently verified for the periods 12/31/1993 ? 12/31/2022. A firm that claims compliance with the GIPS standards must establish policies and procedures for complying with all the applicable requirements of the GIPS standards. Verification provides assurance on whether the firm's policies and procedures related to composite and pooled fund maintenance, as well as the calculation, presentation, and distribution of performance, have been designed in compliance with the GIPS standards and have been implemented on a firm?wide basis. The All Cap Equity Composite has had a performance examination for the periods 12/31/2007 ? 12/31/2022. The verification and performance examination reports are available upon request.
FMI was founded in 1980 and is an independent investment counseling firm registered with the SEC and the State of Wisconsin. The firm manages over $13.0 billion in assets of pension and profit-sharing trusts, mutual funds, Taft?Hartley funds, insurance company portfolios, endowments, and personal trusts. The firm includes both institutional and mutual fund businesses. Although the firm has participated in wrap programs, it is a separate and distinct business and is excluded from firm?wide assets.
The FMI All Cap Equity Composite was created and incepted on 12/31/2007. These accounts primarily invest in small, medium, and large capitalization US equities.
The FMI All Cap Equity Composite reflects time?weighted and asset?weighted returns for all discretionary accounts. From December 31, 2007, all accounts were managed for at least one month. All returns are calculated using United States Dollars and are based on monthly valuations using trade date accounting. All accounts in this composite are fee-paying. Gross of fees returns are calculated gross of management fees and custodial fees and net of transaction costs. Net of fees returns are calculated net of actual management fees and transaction costs and gross of custodial fees and withholding taxes. Dispersion is calculated using the equal-weighted standard deviation of all accounts in the composite for the entire period. As of 12/31/2011, the trailing three-year annualized ex?post standard deviation for the Composite and Benchmark are required to be stated per GIPS®. FMI uses gross returns to calculate these.
Currently, the advisory fee structure for the FMI All Cap Equity Composite portfolios is as follows:
Up to $25,000,000 0.65%
$25,000,001?$50,000,000 0.55%
$50,000,001?$100,000,000 0.50%
$100,000,001 and above 0.45%
The firm generally requires a minimum of $3 million in assets to establish a discretionary account. High Net Worth individuals may establish an account with a minimum of $1,000,000, however, the firm reserves the right to charge a minimum dollar fee for High Net Worth individuals depending on the client servicing involved. The minimum account sizes do not apply to new accounts for which there is a corporate, family, or other substantial relationship to existing accounts. In addition, the firm reserves the right to waive the minimum account size and minimum annual fee under certain circumstances. A complete list and description of all firm composites and FMI-distributed mutual funds are available upon request. Policies for valuing investments, calculating performance, and preparing GIPS Reports are available upon request.
iShares Russell 3000 ETF® seeks to track the investment results of the Russell 3000® Index (the "Underlying Index"), which measures the performance of the broad U.S. equity market, as defined by FTSE Russell (the "Index Provider" or "Russell"). The Underlying Index is a float?adjusted capitalization?weighted index of the approximately 3,041 largest public issuers domiciled in the U.S. and its territories, as determined by Russell. The Underlying Index includes large?, mid?, and small capitalization companies and may change over time. The All Cap Equity composite uses the Russell 3000 Index® as its primary index comparison. In September 2022, the benchmark was changed from the Russell 3000 Index® to iShares Russell 3000 ETF® for all periods.
GIPS® is a registered trademark of CFA Institute. CFA Institute does not endorse or promote this organization, nor does it warrant the accuracy or quality of the content contained herein.
International Equity Hedged Composite 12/31/2012 ? 12/31/2022
| Year |
| Total Return Gross of Fees % |
| Total Return Net of Fees % |
| *Benchmark Return % |
| Number of Portfolios |
| Dispersion % |
| Three-Year Ex?Post Standard Deviation |
| Composite Assets End of Period ($ millions) |
| Total Firm Assets End of Period ($ millions) |
| Percentage of Firm Assets % |
| Composite |
| *Benchmark |
| 2013 |
| 25.89 |
| 24.95 |
| 21.39 |
| < 5 |
| 0.00 |
| 9.78 |
| 16.17 |
| $ 165.8 |
| $ 19,705.3 |
| 0.84% |
| 2014 |
| 5.66 |
| 4.87 |
| ?6.20 |
| < 5 |
| 0.00 |
| 7.49 |
| 13.20 |
| $ 771.6 |
| $ 21,001.1 |
| 3.67% |
| 2015 |
| 4.24 |
| 3.46 |
| ?1.00 |
| < 5 |
| 0.00 |
| 8.14 |
| 12.46 |
| $ 2,832.9 |
| $ 21,042.9 |
| 13.46% |
| 2016 |
| 11.04 |
| 10.23 |
| 1.38 |
| < 5 |
| 0.38 |
| 7.39 |
| 12.00 |
| $ 5,946.2 |
| $ 22,626.7 |
| 26.28% |
| 2017 |
| 16.51 |
| 15.70 |
| 25.10 |
| < 5 |
| 0.02 |
| 7.04 |
| 11.03 |
| $ 8,209.3 |
| $ 25,322.0 |
| 32.42% |
| 2018 |
| ?8.63 |
| ?9.27 |
| ?13.81 |
| < 5 |
| 0.06 |
| 7.22 |
| 10.82 |
| $ 6,287.8 |
| $ 19,833.6 |
| 31.70% |
| 2019 |
| 18.11 |
| 17.29 |
| 22.03 |
| < 5 |
| 0.08 |
| 8.30 |
| 10.97 |
| $ 7,522.0 |
| $ 22,609.9 |
| 33.27% |
| 2020 |
| 0.98 |
| 0.25 |
| 7.58 |
| < 5 |
| 0.27 |
| 17.52 |
| 17.63 |
| $ 3,576.9 |
| $ 16,284.2 |
| 21.97% |
| 2021 |
| 15.81 |
| 14.95 |
| 11.46 |
| < 5 |
| 0.00 |
| 17.57 |
| 16.54 |
| $ 3,541.7 |
| $ 17,068.4 |
| 20.75% |
| 2022 |
| ?8.51 |
| ?9.19 |
| ?14.36 |
| < 5 |
| 0.00 |
| 19.30 |
| 20.20 |
| $ 3,291.8 |
| $ 13,021.5 |
| 25.28% |
*iShares MSCI EAFE ETF®
Returns reflect the reinvestment of dividends and other earnings.
The above table reflects past performance. Past performance does not guarantee future results. A client's investment return may be lower or higher than the performance shown above. Clients may suffer an investment loss.
Fiduciary Management, Inc. claims compliance with the Global investment Performance Standards (GIPS®) and has prepared and presented this report in compliance with the GIPS standards. Fiduciary Management, Inc. has been independently verified for the periods 12/31/1993 ? 12/31/2022. A firm that claims compliance with the GIPS standards must establish policies and procedures for complying with all the applicable requirements of the GIPS standards. Verification provides assurance on whether the firm's policies and procedures related to composite and pooled fund maintenance, as well as the calculation, presentation, and distribution of performance, have been designed in compliance with the GIPS standards and have been implemented on a firm?wide basis. The International Equity Hedged Composite has had a performance examination for the periods 12/31/2010 ? 12/31/2022. The verification and performance examination reports are available upon request.
FMI was founded in 1980 and is an independent investment counseling firm registered with the SEC and the State of Wisconsin. The firm manages over $13.0 billion in assets of pension and profit-sharing trusts, mutual funds, Taft?Hartley funds, insurance company portfolios, endowments, and personal trusts. The firm includes both institutional and mutual fund businesses. Although the firm has participated in wrap programs, it is a separate and distinct business and is excluded from firm?wide assets.
The International Equity Hedged Composite was created and incepted on 12/31/2010. Prior to 01/01/2020, this composite was referred to as The International Equity Hedged Composite. This composite invests mainly in a limited number (usually between 25?40) of large capitalization (namely, companies with more than $5 billion market capitalization) foreign companies.
The International Equity Hedged Composite reflects time?weighted and asset?weighted returns for all discretionary accounts. All returns are calculated using United States Dollars and are based on monthly valuations using trade date accounting. All accounts in this composite are fee-paying. Gross of fees returns are calculated as gross of management fees, gross of custodial fees, gross of withholding taxes, and net of transaction costs. Net of fees returns are calculated net of actual management fees and transaction costs and gross of custodial fees and withholding taxes. Dispersion is calculated using the equal-weighted standard deviation of all accounts in the composite for the entire period. As of 12/31/2011, the trailing three year annualized ex?post standard deviation for the Composite and Benchmark are required to be stated per GIPS®. FMI uses gross returns to calculate these.
Currently, the advisory fee structure for the International Equity Hedged Composite portfolios is as follows:
Up to $25,000,000 0.70%
$25,000,001?$50,000,000 0.65%
$50,000,001?$100,000,000 0.60%
$100,000,001 and above 0.55%
The firm generally requires a minimum of $25 million in assets to establish a discretionary account. The minimum account sizes do not apply to new accounts for which there is a corporate, family, or other substantial relationship to existing accounts. In addition, the firm reserves the right to waive the minimum account size and minimum annual fee under certain circumstances. A complete list and description of all firm composites and FMI-distributed mutual funds are available upon request. Policies for valuing portfolios, calculating performance, and preparing compliant presentations are available upon request.
The iShares MSCI EAFE ETF® seeks to track the investment results of the MSCI EAFE Index (the "Underlying Index"), which has been developed by MSCI Inc. (the
"Index Provider" or "MSCI"). The Underlying Index is a free float?adjusted, market capitalization?weighted index designed to measure large? and midcapitalization equity market performance of developed markets outside of the U.S. and Canada. The Underlying Index includes stocks from Europe, Australasia, and the Far East and, as of July 31, 2021, consisted of securities from the following 21 developed market countries or regions: Australia, Austria, Belgium, Denmark, Finland, France, Germany, Hong Kong, Ireland, Israel, Italy, Japan, the Netherlands, New Zealand, Norway, Portugal, Singapore, Spain, Sweden, Switzerland and the United Kingdom (the "U.K."). AThe MSCI EAFE Net Index ((USD))® is a free float?adjusted market capitalization index that is designed to measure the equity market performance of developed markets, excluding the US & Canada. The MSCI EAFE Net Index ((USD))® consists of the following 21 developed market country indices: Australia, Austria, Belgium, Denmark, Finland, France, Germany, Hong Kong, Ireland, Israel, Italy, Japan, the Netherlands, New Zealand, Norway, Portugal, Singapore, Spain, Sweden, Switzerland, and the United Kingdom. It is reported in local currency and net of hedges. The International Equity Hedged composite uses the iShares MSCI EAFE ETF® as its primary benchmark comparison. In September 2022, the benchmark was changed from MSCI EAFE Net Index ((USD))® to iShares MSCI EAFE ETF® for all periods.
GIPS® is a registered trademark of CFA Institute. CFA Institute does not endorse or promote this organization, nor does it warrant the accuracy or quality of the content contained herein.
Fiduciary Management Inc.
International Equity Unhedged Composite 12/31/2019 ? 12/31/2022
| Year |
| Total Return Gross of Fees % |
| Total Return Net of Fees % |
| *Benchmark Return % |
| Number of Portfolios |
| Dispersion % |
| Three-Year Ex?Post Standard Deviation Composite *Benchmark |
| Total Composite Assets End of Period ($ millions) |
| Total Firm Assets End of Period ($ millions) |
| Percentage of Firm Assets % |
| 2020 |
| 4.88 |
| 4.09 |
| 7.58 |
| < 5 |
| 0.00 |
| n/a |
| n/a |
| $ 56.7 |
| $ 16,284.2 |
| 0.35% |
| 2021 |
| 10.43 |
| 9.64 |
| 11.46 |
| < 5 |
| 0.00 |
| n/a |
| n/a |
| $ 108.6 |
| $ 17,068.4 |
| 0.64% |
| 2022 |
| ?16.23 |
| ?16.84 |
| ?14.36 |
| < 5 |
| 0.30 |
| 22.12 |
| 20.20 |
| $ 80.7 |
| $ 13,021.5 |
| 0.62% |
*iShares MSCI EAFE ETF®
Returns reflect the reinvestment of dividends and other earnings.
The above table reflects past performance. Past performance does not guarantee future results. A client's investment return may be lower or higher than the performance shown above. Clients may suffer an investment loss
Fiduciary Management, Inc. claims compliance with the Global Investment Performance Standards (GIPS®) and has prepared and presented this report in compliance with the GIPS standards. Fiduciary Management, Inc. has been independently verified for the periods 12/31/1993 ? 12/31/2022. A firm that claims compliance with the GIPS standards must establish policies and procedures for complying with all the applicable requirements of the GIPS standards. Verification provides assurance on whether the firm's policies and procedures related to composite and pooled fund maintenance, as well as the calculation, presentation, and distribution of performance, have been designed in compliance with the GIPS standards and have been implemented on a firm?wide basis. The International Equity Unhedged Composite has had a performance examination for the periods 12/31/2019 ? 12/31/2022. The verification and performance examination reports are available upon request.
FMI was founded in 1980 and is an independent investment counseling firm registered with the SEC and the State of Wisconsin. The firm manages over $13.0 billion in assets of pension and profit-sharing trusts, mutual funds, Taft?Hartley funds, insurance company portfolios, endowments, and personal trusts. The firm includes both institutional and mutual fund businesses. Although the firm has participated in wrap programs, it is a separate and distinct business and is excluded from firm?wide assets.
The International Equity Unhedged Composite was created and incepted on 12/31/2019. This composite invests mainly in a limited number (usually between 2540) of large capitalization (namely, companies with more than $5 billion market capitalization) foreign companies.
The International Equity Unhedged Composite reflects time?weighted and asset?weighted returns for all discretionary accounts. All returns are calculated using United States Dollars and are based on monthly valuations using trade date accounting. All accounts in this composite are fee-paying. Gross of fees returns are calculated as gross of management fees, gross of custodial fees, gross of withholding taxes, and net of transaction costs. Net of fees returns are calculated net of actual management fees and transaction costs and gross of custodial fees and withholding taxes. Dispersion is calculated using the equal-weighted standard deviation of all accounts in the composite for the entire period. Dispersion is not shown when there are five or fewer accounts in the composite for the year. As of 12/31/2021, 36 months of performance is not available; therefore the three-year annualized ex?post standard deviation is not presented for the composite or the benchmark.
Currently, the advisory fee structure for the International Equity Unhedged Composite portfolios is as follows:
Up to $25,000,000 0.70%
$25,000,001?$50,000,000 0.65%
$50,000,001?$100,000,000 0.60%
$100,000,001 and above 0.55%
The firm generally requires a minimum of $25 million in assets to establish a discretionary account. The minimum account sizes do not apply to new accounts for which there is a corporate, family, or other substantial relationship to existing accounts. In addition, the firm reserves the right to waive the minimum account size and minimum annual fee under certain circumstances. A complete list and description of all firm composites and FMI-distributed mutual funds are available upon request. Policies for valuing portfolios, calculating performance, and preparing compliant presentations are available upon request.
The iShares MSCI EAFE ETF® seeks to track the investment results of the MSCI EAFE Index (the "Underlying Index"), which has been developed by MSCI Inc. (the "Index Provider" or "MSCI"). The Underlying Index is a free float?adjusted, market capitalization?weighted index designed to measure large? and mid?capitalization equity market performance of developed markets outside of the U.S. and Canada. The Underlying Index includes stocks from Europe, Australasia, and the Far East and, as of July 31, 2021, consisted of securities from the following 21 developed market countries or regions: Australia, Austria, Belgium, Denmark, Finland, France, Germany, Hong Kong, Ireland, Israel, Italy, Japan, the Netherlands, New Zealand, Norway, Portugal, Singapore, Spain, Sweden, Switzerland and the United Kingdom (the "U.K."). AThe MSCI EAFE Net Index ((USD))® is a free float?adjusted market capitalization index that is designed to measure the equity market performance of developed markets, excluding the US & Canada. The MSCI EAFE Net Index ((USD))® consists of the following 21 developed market country indices: Australia, Austria, Belgium, Denmark, Finland, France, Germany, Hong Kong, Ireland, Israel, Italy, Japan, the Netherlands, New Zealand, Norway, Portugal, Singapore, Spain, Sweden, Switzerland, and the United Kingdom. It is reported in local currency and net of hedges. The International Equity Hedged composite uses the iShares MSCI EAFE ETF® as its primary benchmark comparison. In September 2022, the benchmark was changed from MSCI EAFE Net Index ((USD))® to iShares MSCI EAFE ETF® for all periods.
GIPS® is a registered trademark of the CFA Institute. CFA Institute does not endorse or promote this organization, nor does it warrant the accuracy or quality of the content contained herein.
¹Source: Bloomberg - returns do not reflect management fees, transaction costs, or expenses. Performance is based on market price returns. Beginning 8/10/20, market price returns are calculated using the closing price. Prior to 8/10/20, market price returns were calculated using a midpoint bid/ask spread at 4:00 PM ET.
² DALBAR Products and Services: QAIB
Editor's Note: The summary bullets for this article were chosen by Seeking Alpha editors.
For further details see:
Fiduciary Management Q2 2023 Investment Letter