SPY - FNDX: Key Insights Into This $10B Fundamentals-Based Fund
Summary
- FNDX holds 700+ U.S. large-cap stocks weighted by leverage-adjusted sales, retained operating cash flow, and shareholder yield. Its expense ratio is 0.25% and the ETF has $10 billion in assets.
- I prefer forward-looking metrics, but FNDX trades at 17.79x forward earnings and is well-diversified across sectors and industries. Still, its 16.6% exposure to Technology stocks is too high.
- As a result, FNDX has poor earnings momentum and is at risk of a short-term correction. The sector's recent rally is unsupported by the latest earnings reports and analyst revisions.
- This article compares FNDX's fundamentals against IWD, IWB, and IWF, three Russell 1000 Index ETFs tracking the value, blended, and growth segments. In my view, IWD looks superior.
Investment Thesis
The Schwab Fundamental U.S. Large Company ETF ( FNDX ) has outperformed its benchmark by 8% since my bullish rating last March. It's unsurprising, as 2022 was the year when fundamentals finally mattered again. FNDX and a host of other fundamentals-based funds outperformed their market-cap-weighted benchmarks. With this article, I aim to update readers on how well FNDX is positioned against three ETFs tracking the value, blended, and growth segments of the Russell 1000 Index. It's still a solid fund worth holding, but it's not superior to the straightforward Russell 1000 Value Index.
FNDX Overview
Strategy Discussion
FNDX tracks the Russell RAFI US Large Company Index, selecting and weighting securities using three fundamental measures described below.
- Average five-year sales adjusted for financial leverage
- Average five-year operating cash flow less dividends and buybacks
- Average five-year dividends and buybacks
For each company, these scores are averaged and multiplied by its investability weight, resulting in the free float-adjusted fundamental weight for the security. Companies ranking above the 87.5% percentile by cumulative fundamental weight are considered large-caps.
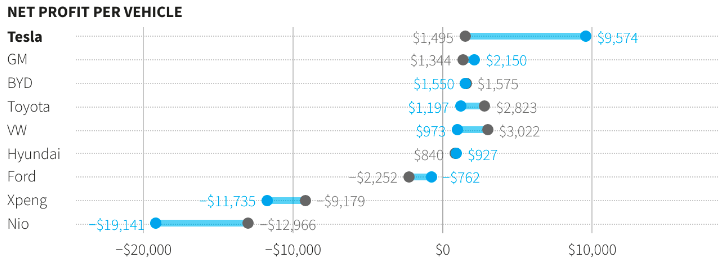
These screens are geared toward value investors. The adjustment for financial leverage disadvantages growth companies that often rely on debt to grow. Debt is often acceptable but may be problematic with high interest rates. The operating cash flow and dividend and buybacks screen also favor value-oriented companies. Growth stocks often don't pay substantial dividends, instead choosing to reinvest profits into the business. Finally, the most promising companies may not generate positive operating cash flow. To illustrate, Tesla ( TSLA ) sold few cars several years ago and had the lowest operating margins. Today, its net profit per vehicle is industry-leading, allowing the company to decrease prices to increase market share.
It's a concern for Indexes that rely primarily on historical metrics. Tesla is an extreme example, and I don't consider it "fundamentally sound" necessarily. However, I find forward-looking metrics more valuable. I'll examine several of them in my industry-level analysis later.
Sector Exposures and Top Ten Holdings
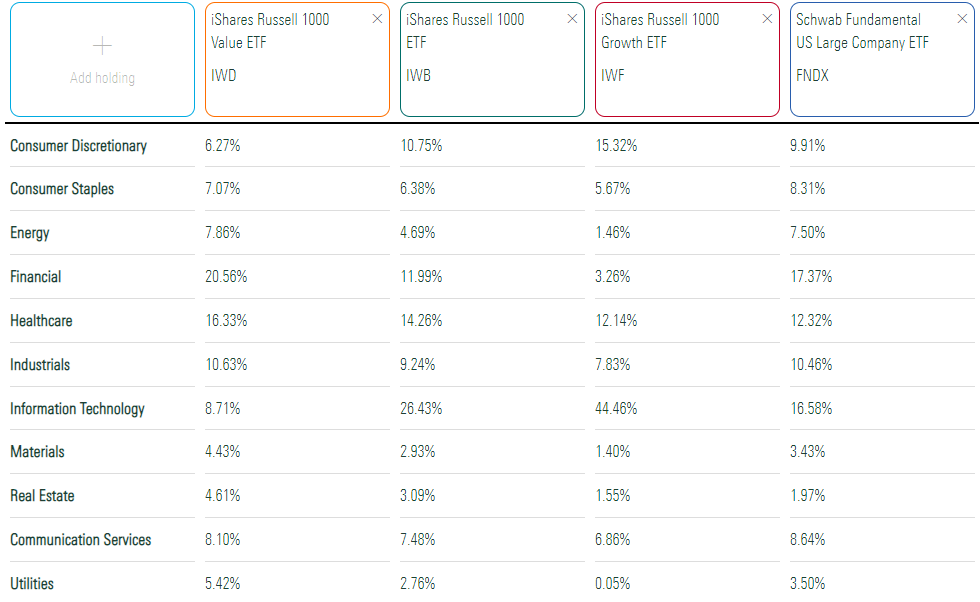
The following table highlights the sector exposures for FNDX and three Russell 1000 Index ETFs: IWD , IWB , and IWF , representing the value, blend, and growth segments.
FNDX is well-balanced across all sectors and is most similar to IWD, though it has 8% more Technology exposure. Energy is solid at 7.5%, but I am concerned this will reduce once the Index reconstitutes next month. Last year's turnover rate was only 11%, so I expect nothing drastic since the screens are based on five years. Still, it's hard to ignore how well Energy stocks like Exxon Mobil ( XOM ) and Chevron ( CVX ) have performed lately. S&P Dow Jones Indices considered them growth stocks after its Indexes reconstituted in December, and we may see something similar here.
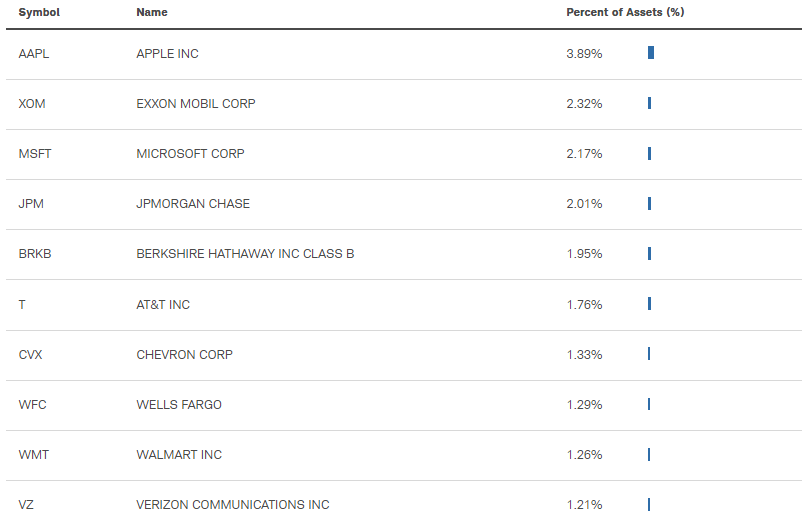
FNDX's top ten holdings are below. Apple ( AAPL ) and Microsoft ( MSFT ) are the portfolio's #1 and #3 holdings, but their weights are limited to a combined 6.06% compared to 11.13% in the Russell 1000 Index. You'll find that most Russell 1000 securities are included, but the portfolio is value-tilted.
Performance Analysis
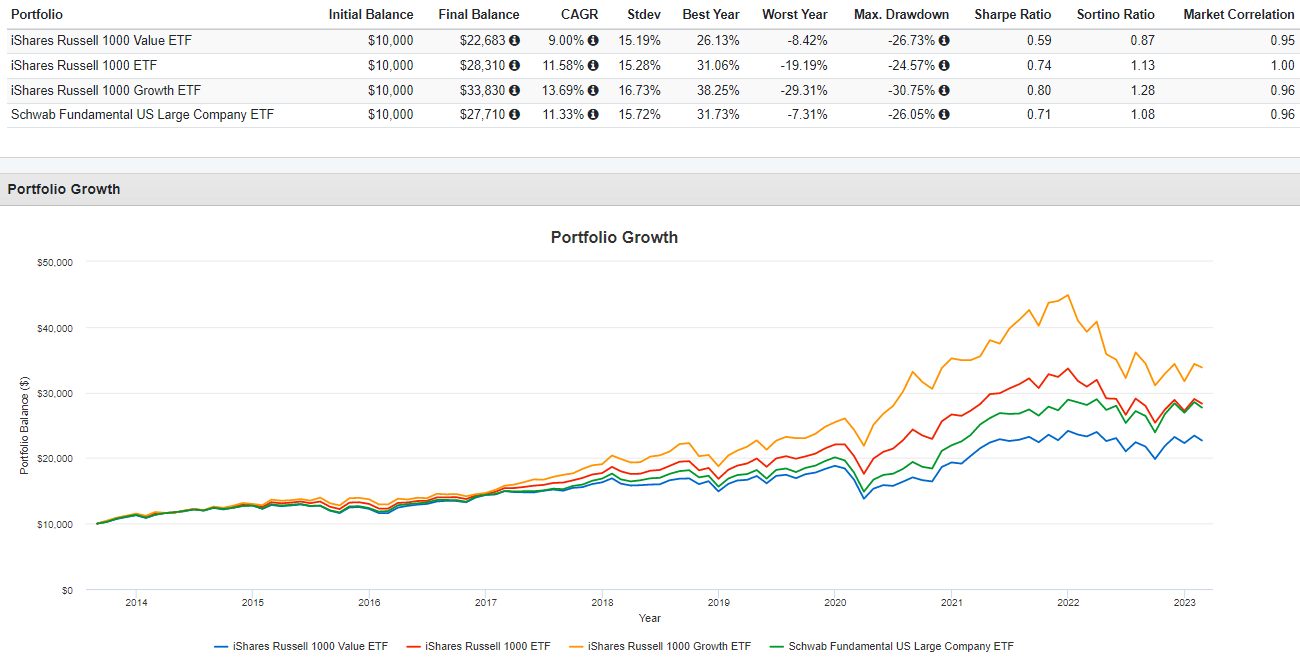
The following graph compares FNDX, IWD, IWB, and IWF since September 2013. FNDX outperformed the value fund by 2.33% per year but lagged the blended and growth fund by 0.25% and 2.36% per year, respectively. Given how well growth stocks performed over the last decade, it's a respectable track record.
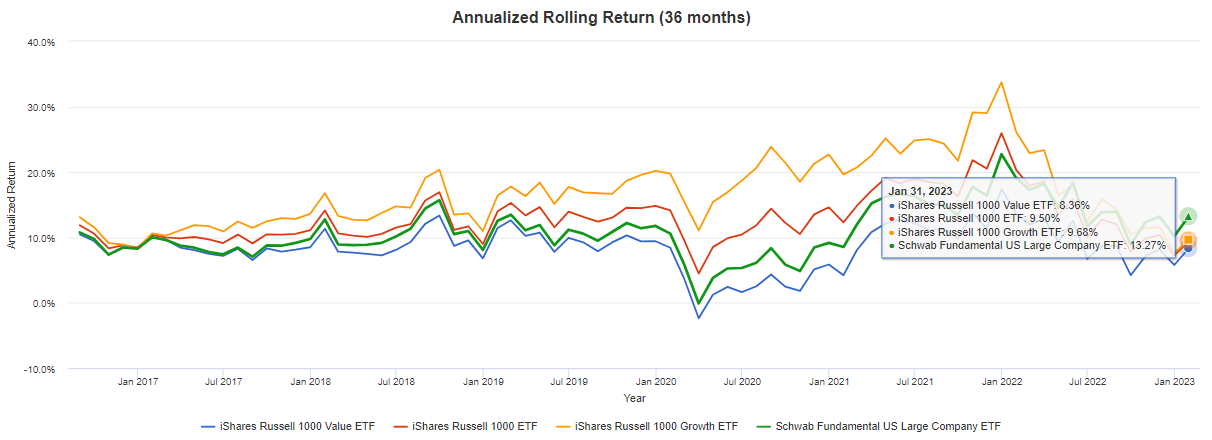
FNDX has performed exceedingly well in the last three years. The following rolling three-year returns chart highlights how FNDX gained 13.27% per year for the period ending January 2023, 3-5% better than these three peers.
Again, expect FNDX to do well when "fundamentals matter," but recognize that won't always be the case. Investors should consider the impact of a substantial sentiment change and change their asset mix accordingly. Cathie Wood proved how fundamentals didn't matter in 2020 with her ARK Invest ETFs. She likely would have performed well during the dot com bubble and in 2009 after the Great Financial Crisis. The takeaway is to avoid getting attached to any particular security. Though I was bullish on FNDX last March, it's not an obvious buy today. To illustrate, let's consider its fundamentals compared to the three Russell 1000 ETFs next.
FNDX Analysis
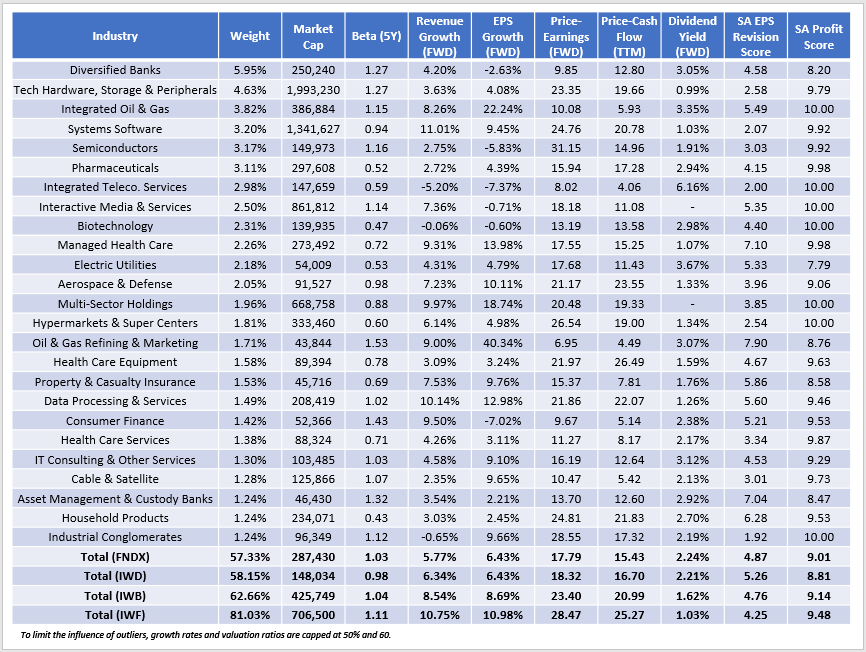
Last March, FNDX traded at 18.46x forward earnings, a 7.66-point discount to IWB. Today, the discount is lower at 5.61 points (17.79x vs. 23.40x), meaning it's not quite as attractive from a valuation perspective. These metrics and others are highlighted in the table below for FNDX's top 25 industries.
Estimated growth rates have plummeted across the board. Previously, FNDX had estimated sales and earnings growth rates of 10.53% and 17.76%. Today, they're 5.77% and 6.43%. IWD, IWB, and IWF similarly plunged. Diversified Banks will have tough year-over-year comparisons partially due to flattening or declining interest rates. Earnings per share growth is negative for top holdings like JPMorgan Chase ( JPM ) and Citigroup ( C ). Even prominent large-cap Technology stocks have low-single-digit earnings growth. In short, growth is challenging to come by these days. Since I don't find IWB's 2.26% growth premium (8.69% vs. 6.43%) significant, it's still prudent to go with diversified funds trading at a discount like FNDX and IWD.
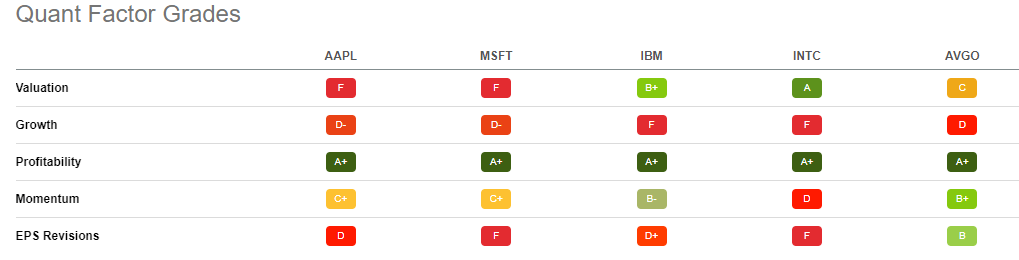
I recently recommended IWD over the iShares Core S&P U.S. Value ETF ( IUSV ) based on its lower beta, lower valuation, better earnings growth, and stronger earnings momentum. IWD has two advantages over FNDX: a lower 0.98 five-year beta and a higher 5.26/10 EPS Revision Score. I rely on the latter to assess market sentiment, and FNDX's lower 4.87/10 score is due to its higher concentration in Technology. Consider these EPS Revision Grades for the top five Technology stocks FNDX overweights for a combined 7.30%. Apple and Microsoft account for 6.08% alone.
Apple missed analyst expectations on weak iPhone sales and FX headwinds last quarter, and Microsoft's EPS Revision Grade has flashed red since August 2022, underperforming the SPDR S&P 500 ETF ( SPY ) by 8%. In addition, S&P 500 aggregate earnings surprises were just 1.0% this quarter . The YTD rally among speculative stocks looks unsustainable, and I look for ETFs with relatively strong analyst earnings momentum. Lately, that means limiting Technology exposure. For the most part, FNDX is well-constructed, but its 16-17% allocation to the sector is too much.
Investment Recommendation
I rated FNDX as a buy in March 2022, and it has performed reasonably well alongside other value-oriented funds. I prefer forward-looking metrics instead of the historical five-year screens its Index uses. Still, FNDX trades at an attractive 17.79x forward earnings with a 6.43% estimated earnings growth rate. As an alternative, consider IWD, which has a nearly identical combination with stronger analyst earnings momentum. FNDX's 16.58% exposure to Technology stocks is excessive, and I fear a short-term correction is possible because the market's rally this year is unsupported by earnings results. Therefore, I've downgraded FNDX to a hold, and I look forward to discussing this further in the comments section below.
For further details see:
FNDX: Key Insights Into This $10B Fundamentals-Based Fund