WBD - Four Dividend Kings To Ring In The New Year
2023-12-27 17:50:22 ET
Summary
- With a new year here at last, investors should be reflecting on the past and looking to the future.
- For those focused on building a portfolio of dividend-paying equities, there are a number of firms out there that make sense to consider.
- Each of some of the best have their own positive and negative traits to them that could make them a good or bad prospect for any specific investor.
- But in general, these firms should outperform the broader market moving forward.
One of the great things about investing is that there are plenty of ways to make money. People can have different investment philosophies and still generate returns that are acceptable for them. I, for instance, I'm not much of a dividend investor. I do buy stocks that pay out distributions, but in an ideal world, I would prefer those distributions be reinvested into the company for further growth. I recognize also that I am probably an oddball in that respect. Most investors that I have communicated with or received feedback from love distributions. And I understand why.
Distributions help to reduce risk in the event that the investment you own ultimately declines in price. It provides a stream of income they can be used for different purposes, especially if you are in retirement. And depending on the type of investment and other factors, there are always tax considerations that might make receiving the income desirable over not receiving it. Regardless of the reason, many investors do love their distributions. And out of respect for that, I have decided to pick out four different securities, each one significantly diverse compared to the next, that investors should pay attention to as we ring in the new year. Each of these investments have their own upsides and downsides. But what they all have in common is that I have rated them either a ‘buy’ or a ‘strong buy’ in the recent past.
Unhealthy habits pay
The first company that I would like to point to is none other than British American Tobacco ( BTI ). In the middle of November, I wrote a bullish article wherein I acknowledged that declining tobacco volumes would be an issue for the company. Having said that, revenue, profits, and cash flows, continued to increase for the business. I found its distribution coverage ratio to be very attractive and I was bullish about the companies move into new product lines that are distinct from traditional tobacco that could pave the way for significant shareholder value even as tobacco consumption continues to drop.
Author
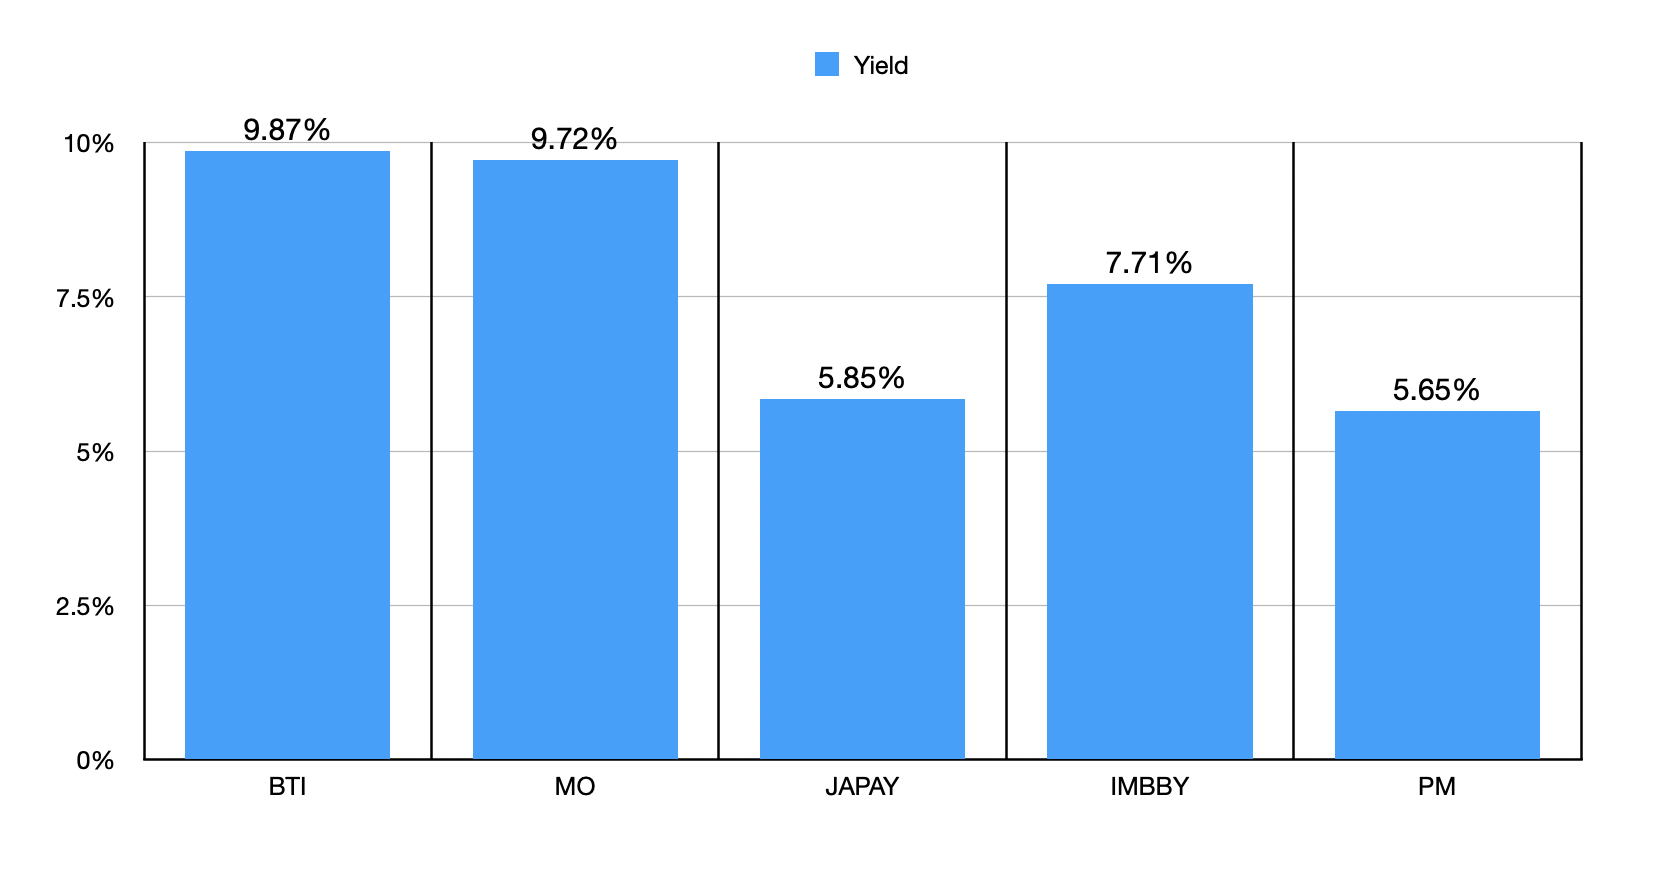
The first thing I would like to point to is just how high the company's distribution currently is. The firm pays an annual dividend of $2.87. That gives it a yield of 9.87% as of the time of this writing. This is a hefty payout, even in the rather generous tobacco industry. The only player that comes close to this and is of a similar size is Altria Group ( MO ), which I also rated a ‘buy’ not too long ago. Its yield as of this writing is 9.72%. As you can see in the chart above, the other three players in the space that I decided to focus on pay out distributions that are meaningfully lower at between 5.65% and 7.71% based on current pricing.
Author
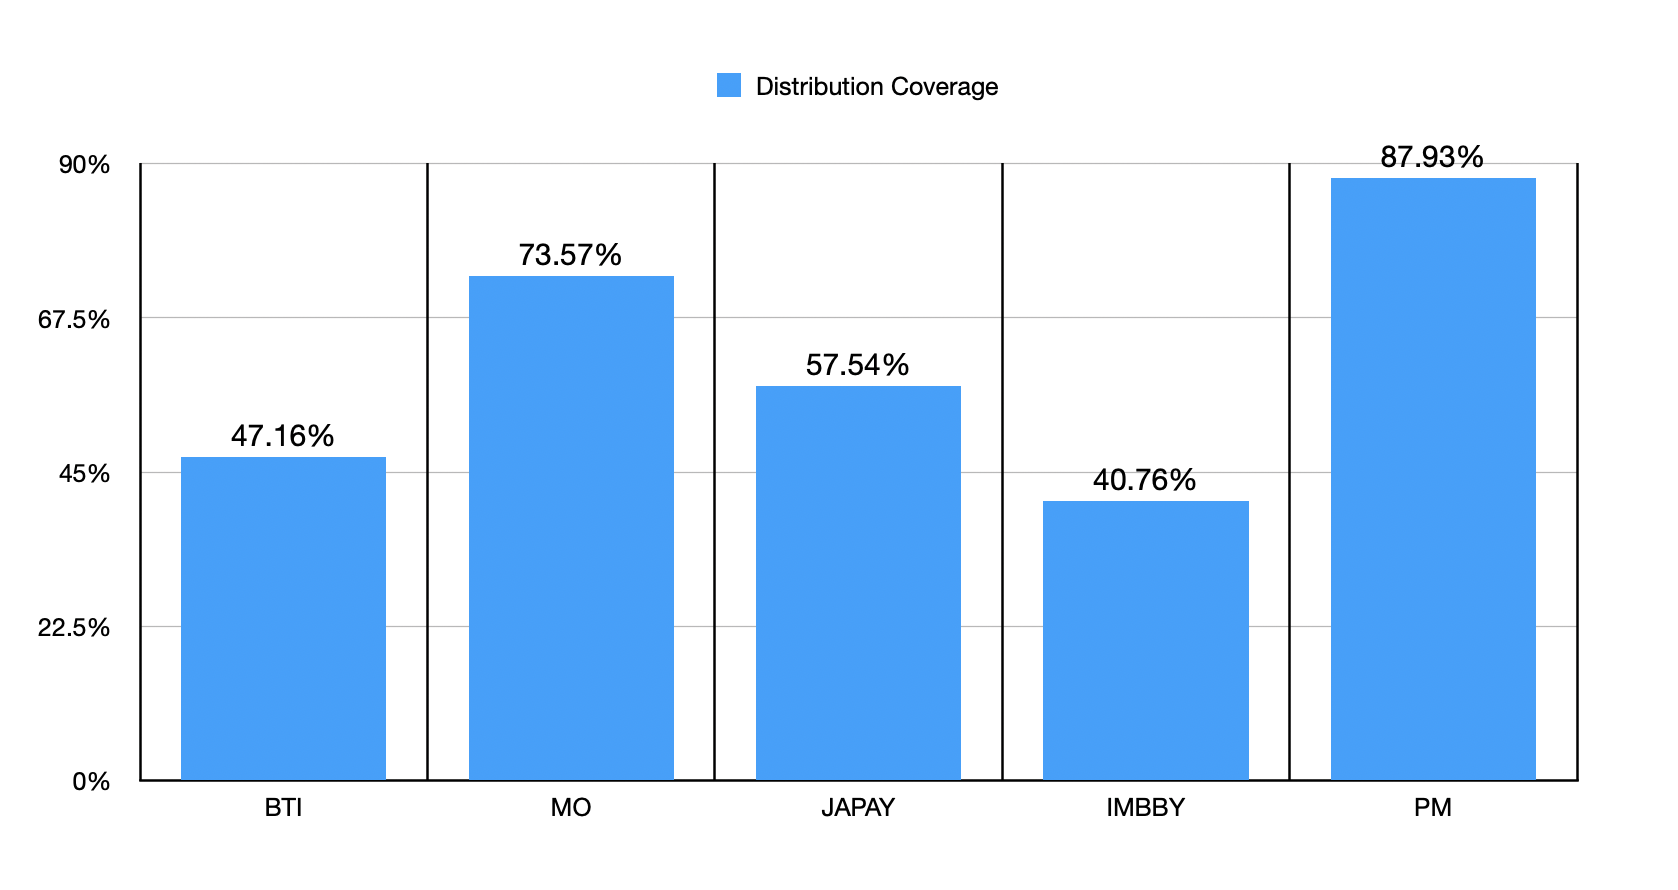
Of course, dividend investing is more than just buying the high ceiling stock. We also need to make sure that the yield is safe. In the chart above, you can see the distribution payout ratio, with the denominator in the equation being operating cash flow. Even though British American Tobacco and Altria Group are very similar to one another from a distribution perspective, using data from the trailing 12 months shows that Altria Group pays out about 73.6% of its operating cash flow toward its distribution. By comparison, that number for British American Tobacco is a much more modest 47.2%. That's a safe amount of coverage and it means that management could comfortably raise the distribution more if they so desired. The other major players, as the table shows, are all higher as well, with the exception of Imperial Brands ( OTCQX:IMBBY ) at 40.8%.
Author
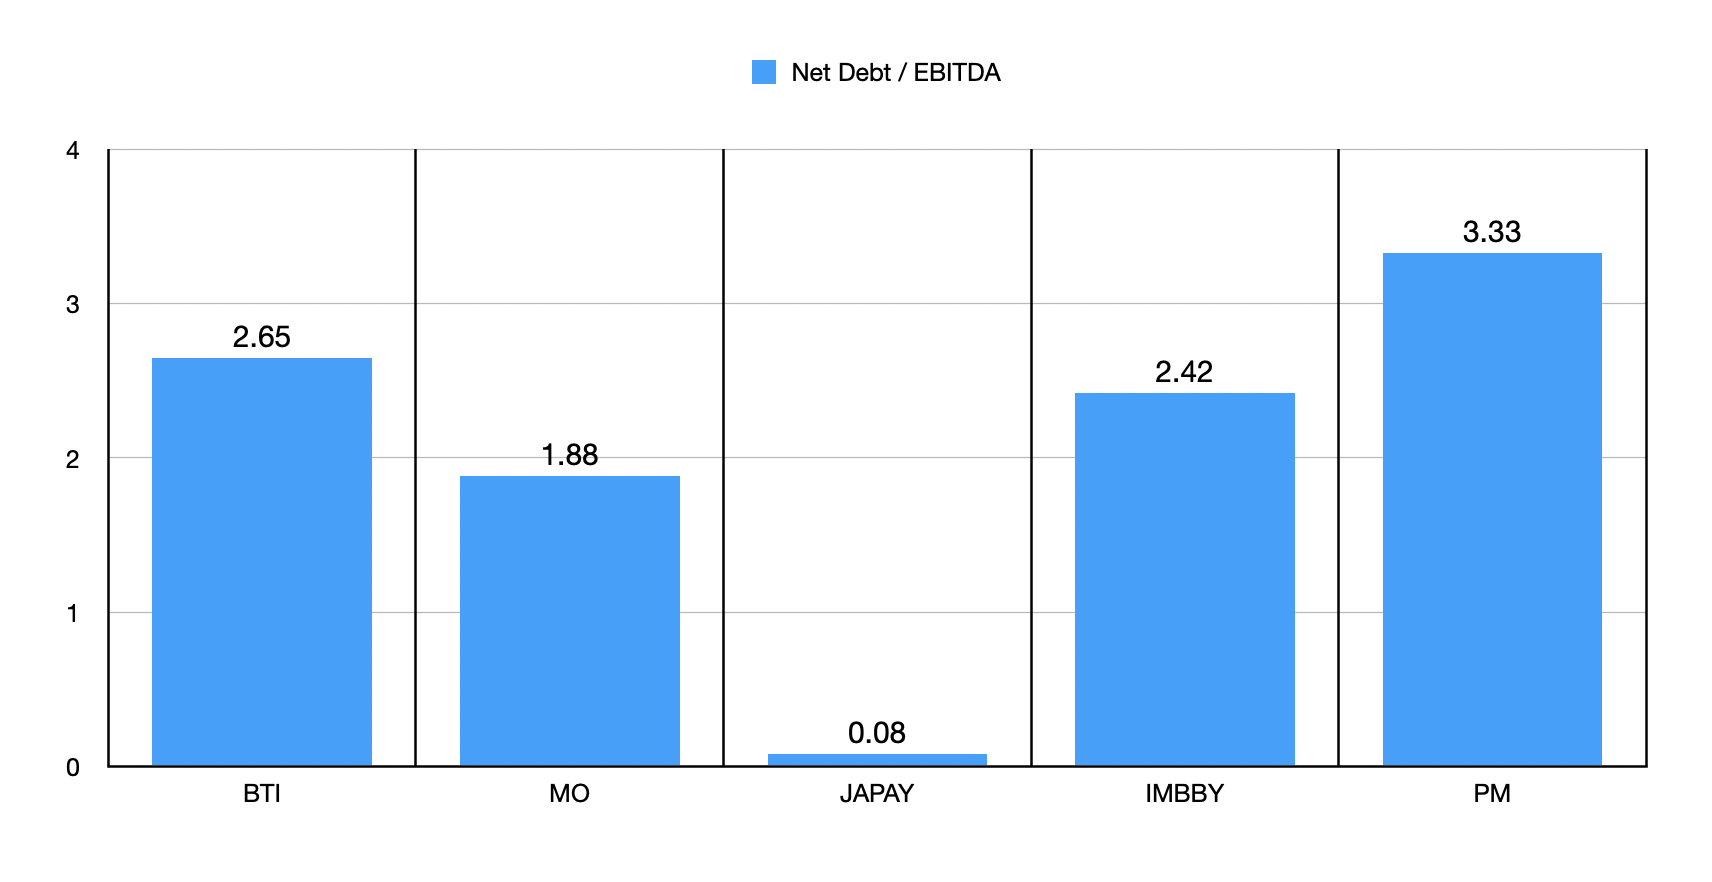
There are other considerations as well. High amounts of debt, for instance, can make it prohibitive to pay out hefty distributions. On that front, there is no denying that Altria Group has British American Tobacco beat. Its net leverage ratio is 1.88 compared to the 2.65 that British American Tobacco has. But I would argue that, compared to at least two other players in the space, this net leverage ratio is not insane. It would be nice to see it come down, of course. But I wouldn't argue that it's high enough to worry about a distribution cut in the foreseeable future. That's especially if cash flows continue to climb.
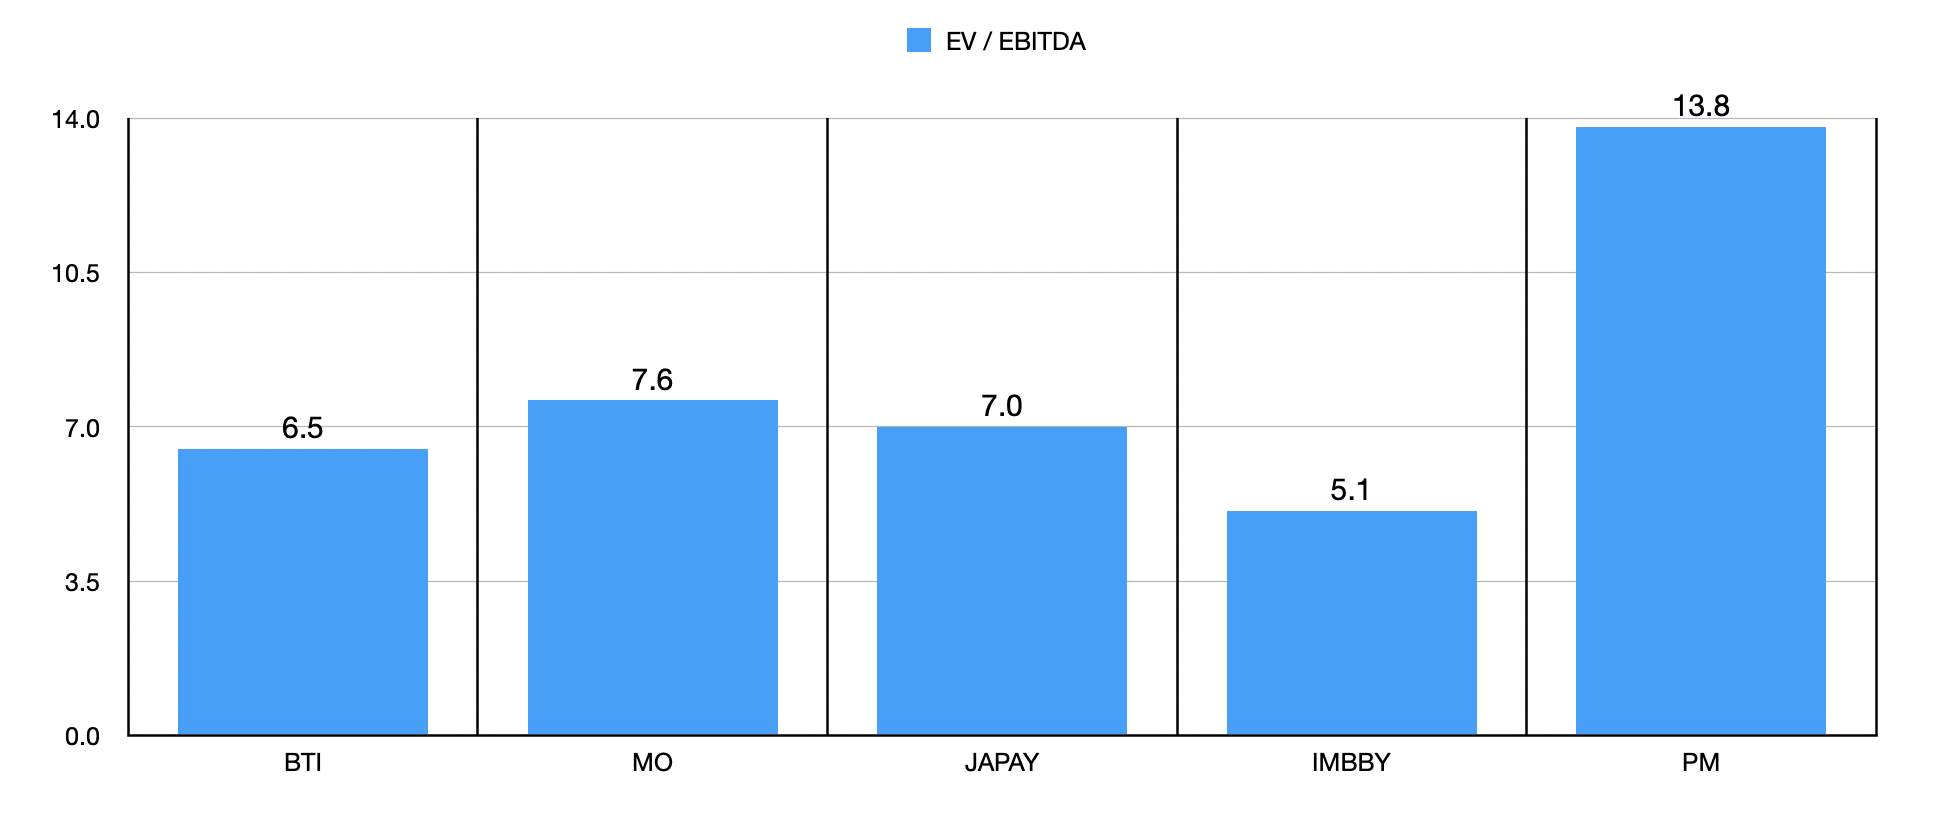
Author
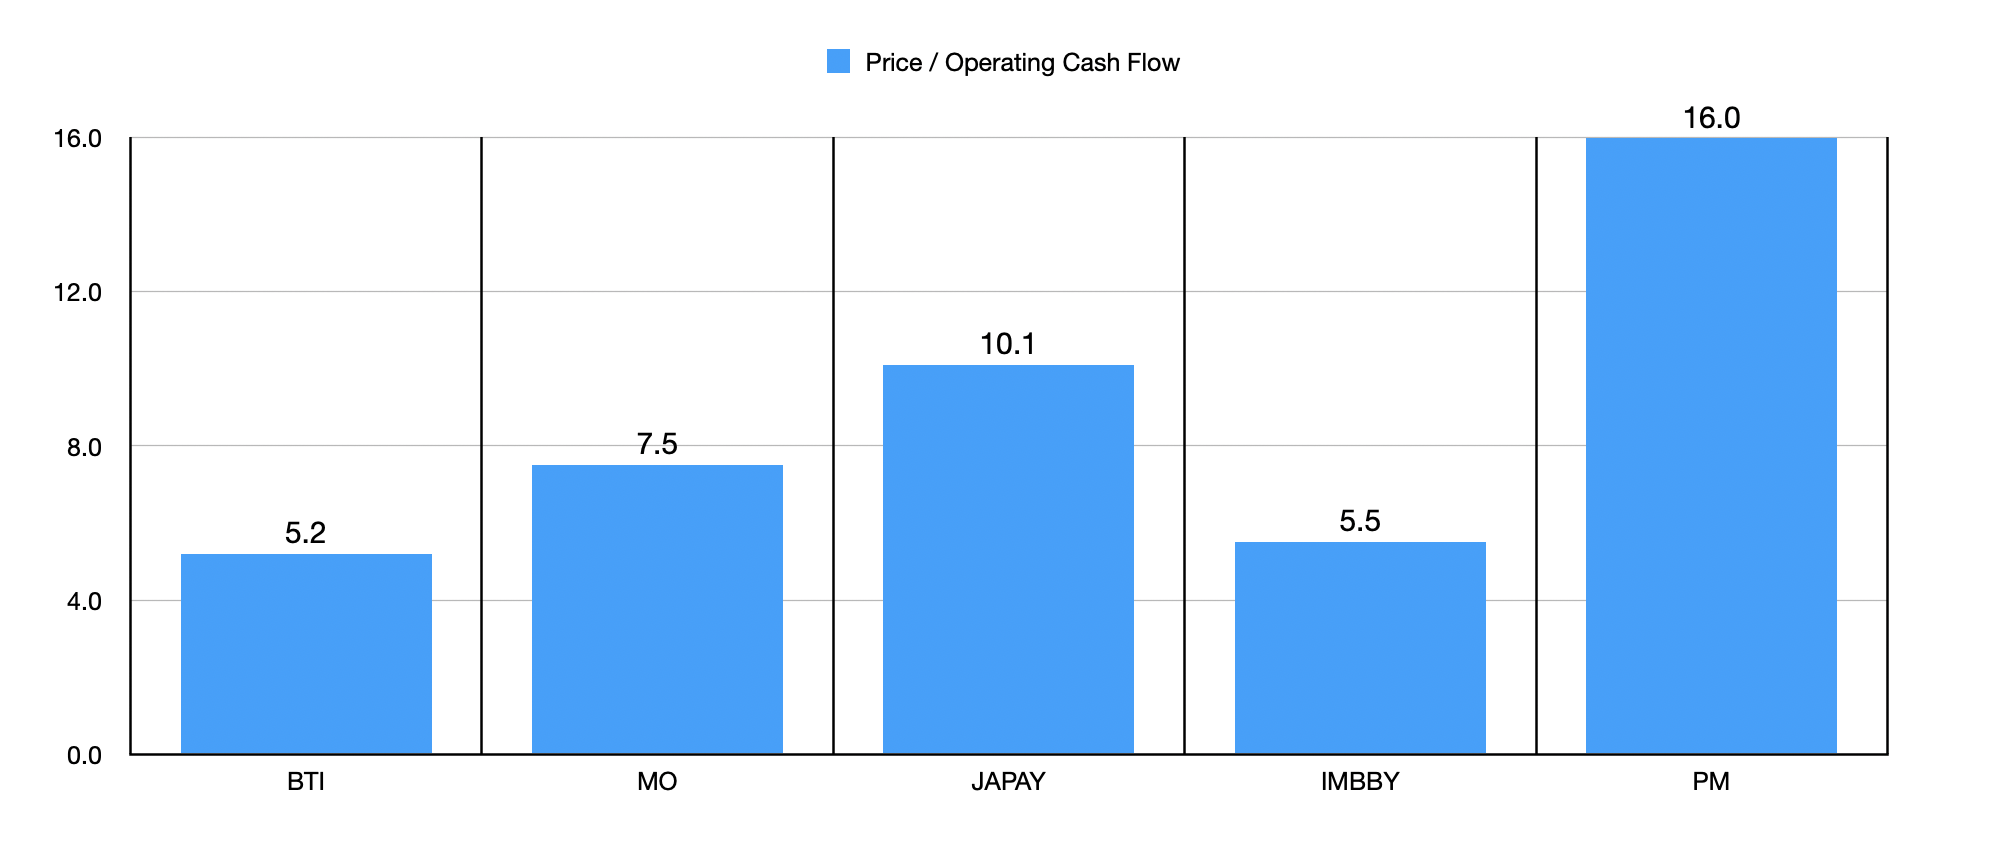
Lastly, there is the topic of price. This also played a role in my decision to pick British American Tobacco. At present, it is the cheapest of the group on a price to operating cash flow basis, trading at a multiple of 5.2. As you can see in the data above, this is cheaper than any of its peers. And then the data below, you can see that it is the second cheapest of the group when it comes to the EV to EBITDA multiple. So at the end of the day, what we have is a cash cow with plenty of wiggle room, some elevated debt but nothing ridiculous, and a cheap share price that could see some nice upside. When you add on to this the specifics that I detailed in the aforementioned article that I wrote about it, it shouldn't be a surprise that I would rate the business a ‘buy’.
Author
Pipelines are cash cows
The next stock in line that I would like to discuss is one that I actually currently own. That is none other than pipeline/midstream operator Energy Transfer ( ET ). At present, it's actually the third largest holding in my portfolio, accounting for 12.6% of my assets. Again, I have never made an investment decision based on the yield an investment offered. But with a current yield of 9.06%, this is a truly massive distribution candidate. Many investors who are looking for attractive yielding stocks often shy away from companies that have previously cut their distributions. Unfortunately for them, this sometimes leads to some rather missed opportunities. And that is exactly what Energy Transfer has been in recent years.
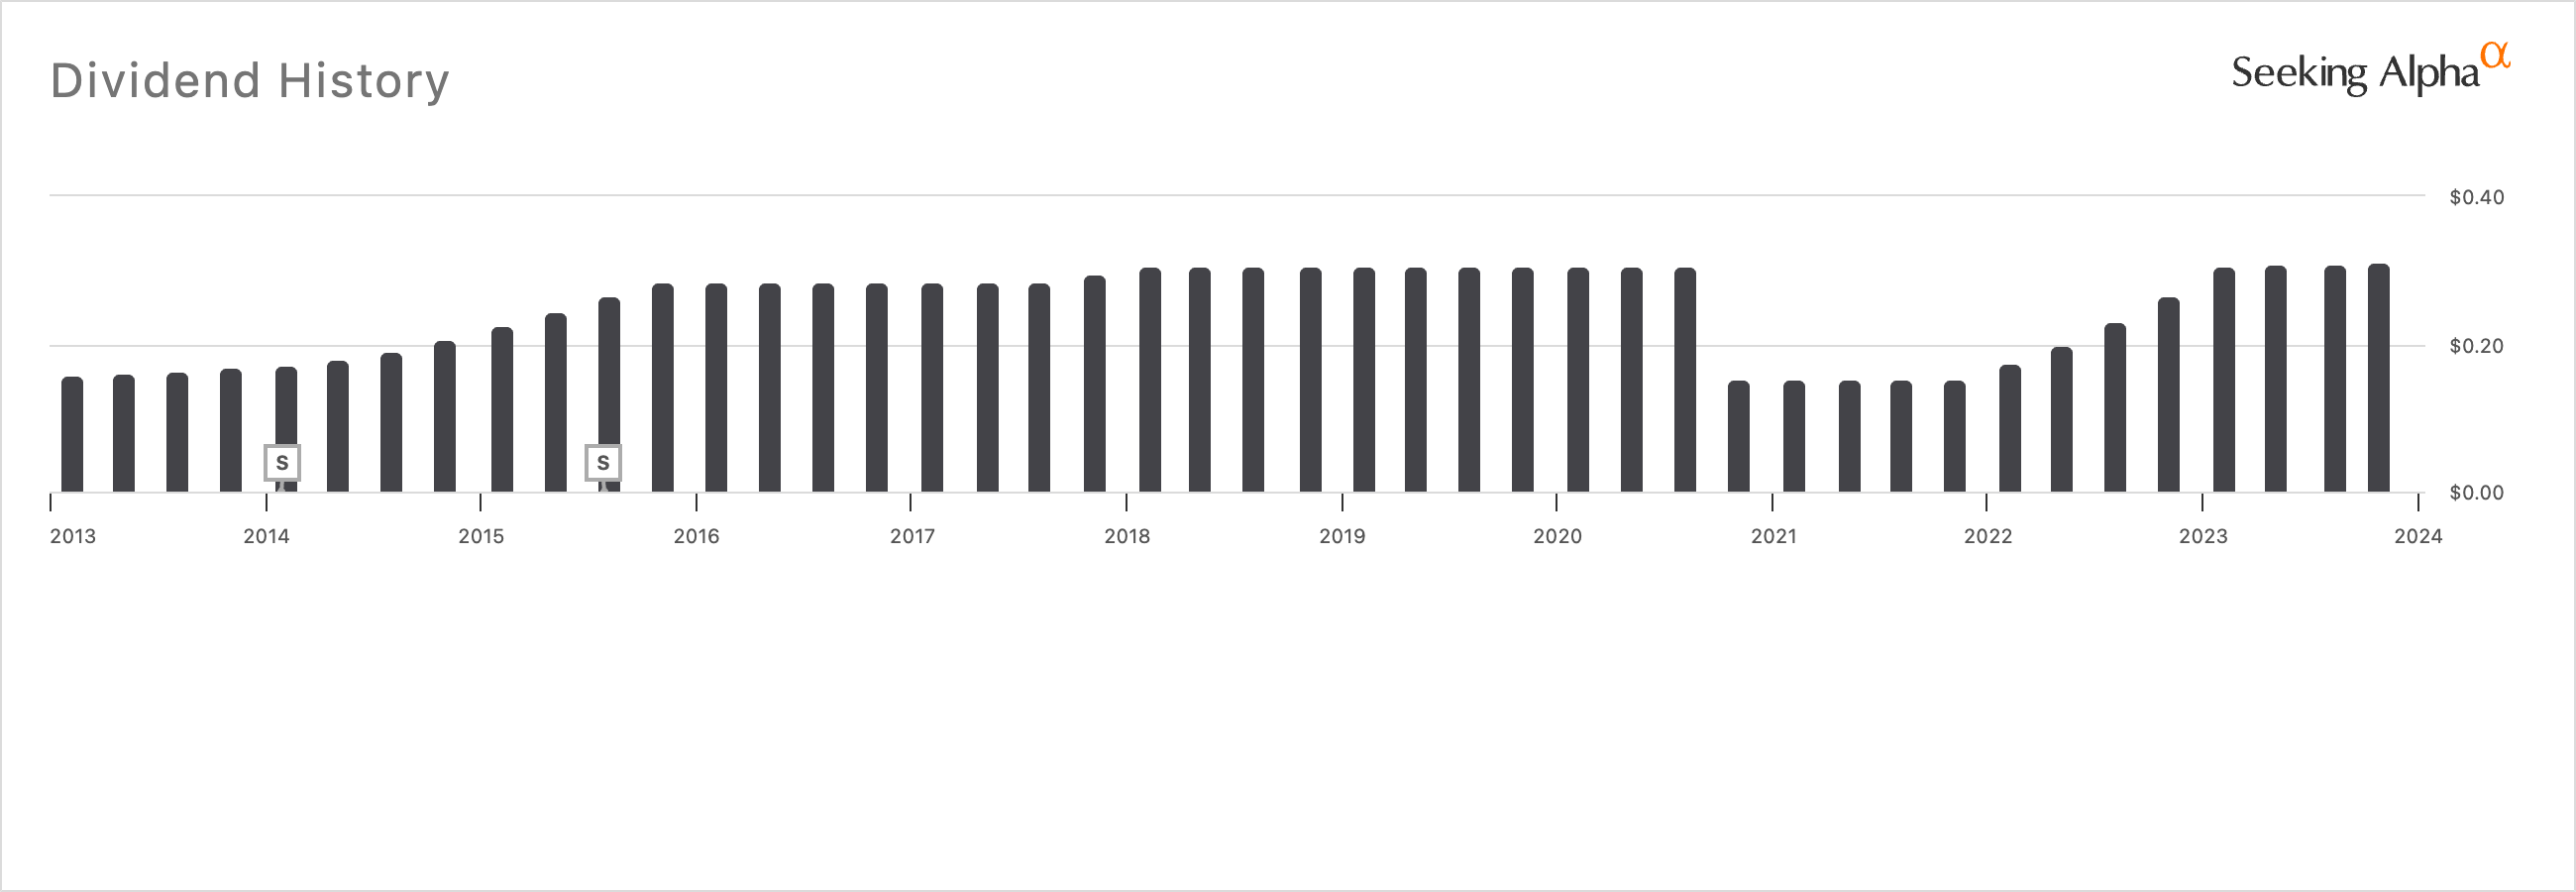
Seeking Alpha
You see, back in 2020, management decided to cut the distribution. This cut can be seen in the image above. Shares ended up plunging, at one point even trading below $5. Since then, the stock has rocketed higher, and is currently trading at $13.79. During this time, the company has slowly raised its distribution back up. And today, with an annual payout of $1.25 per unit, it's finally back up to where it was before the cut.
In the last article that I wrote about the business in early November of this year, I looked at increased guidance that management had for EBITDA for 2023. This guidance involved some organic improvement, but it also involved the company's recent acquisition of Crestwood Equity Partners. Although management has not come out with their own assessment for 2024 yet, I was able to estimate that had Energy Transfer absorbed Crestwood Equity Partners at the start of this year, it would generate around $14.22 billion of EBITDA and $10.97 billion worth of operating cash flow on an annual basis.
Author
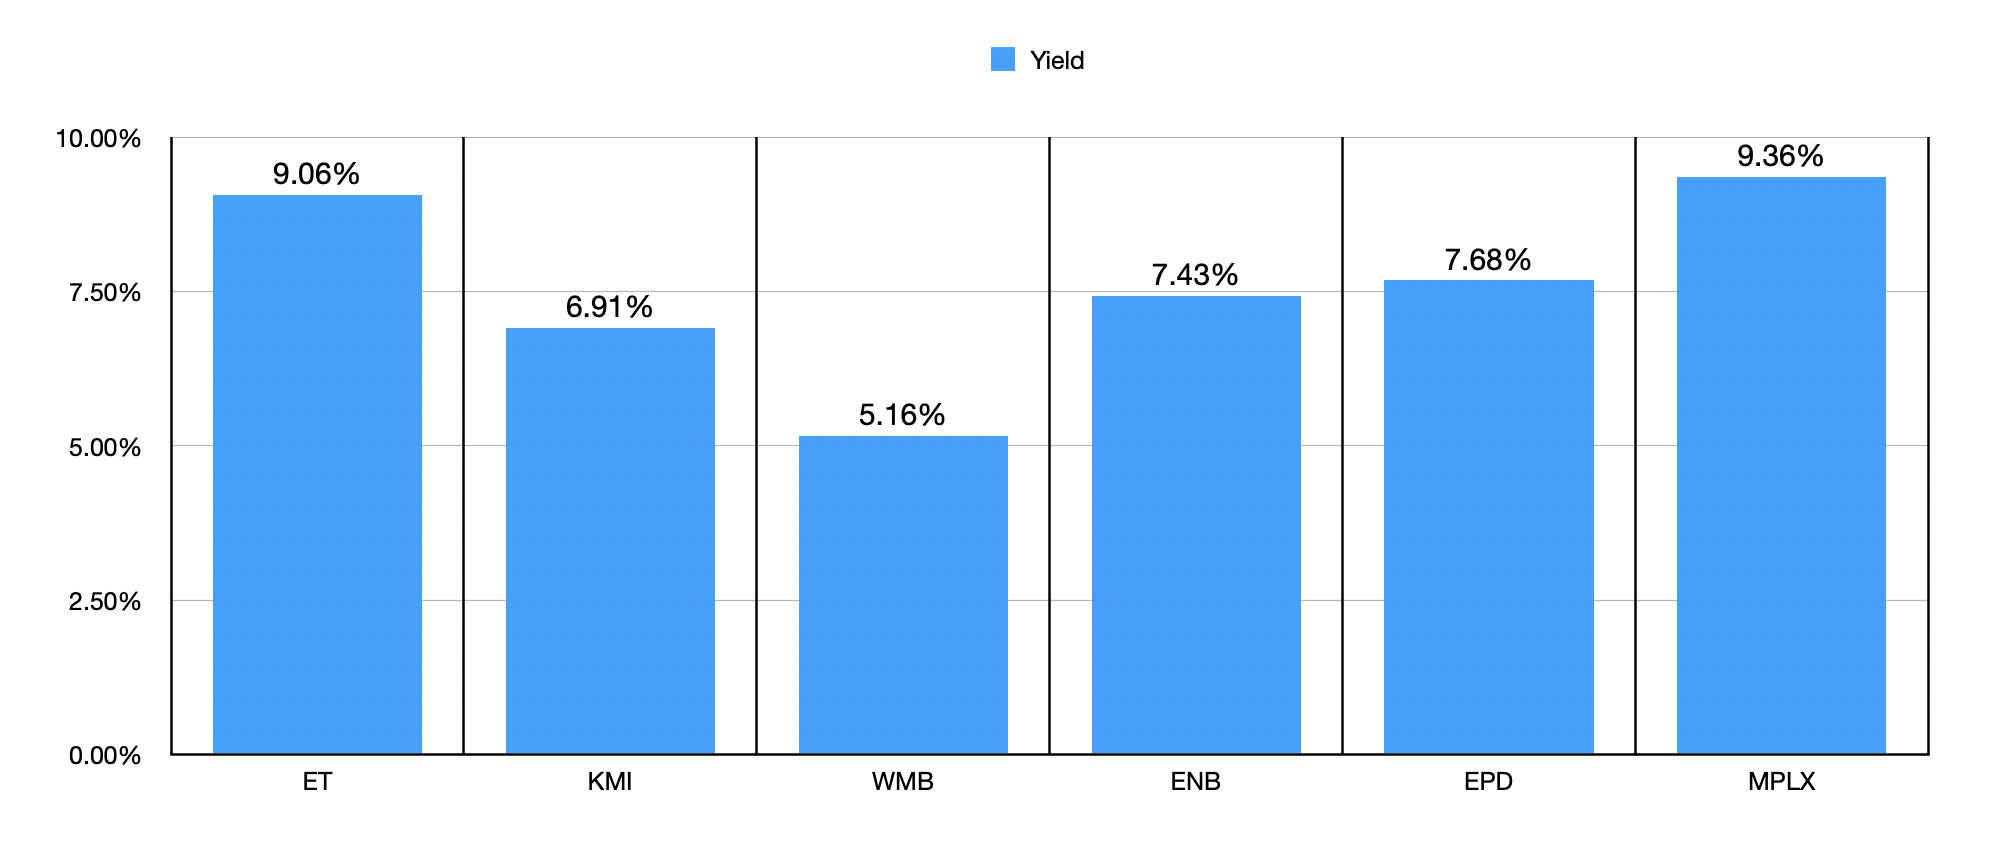
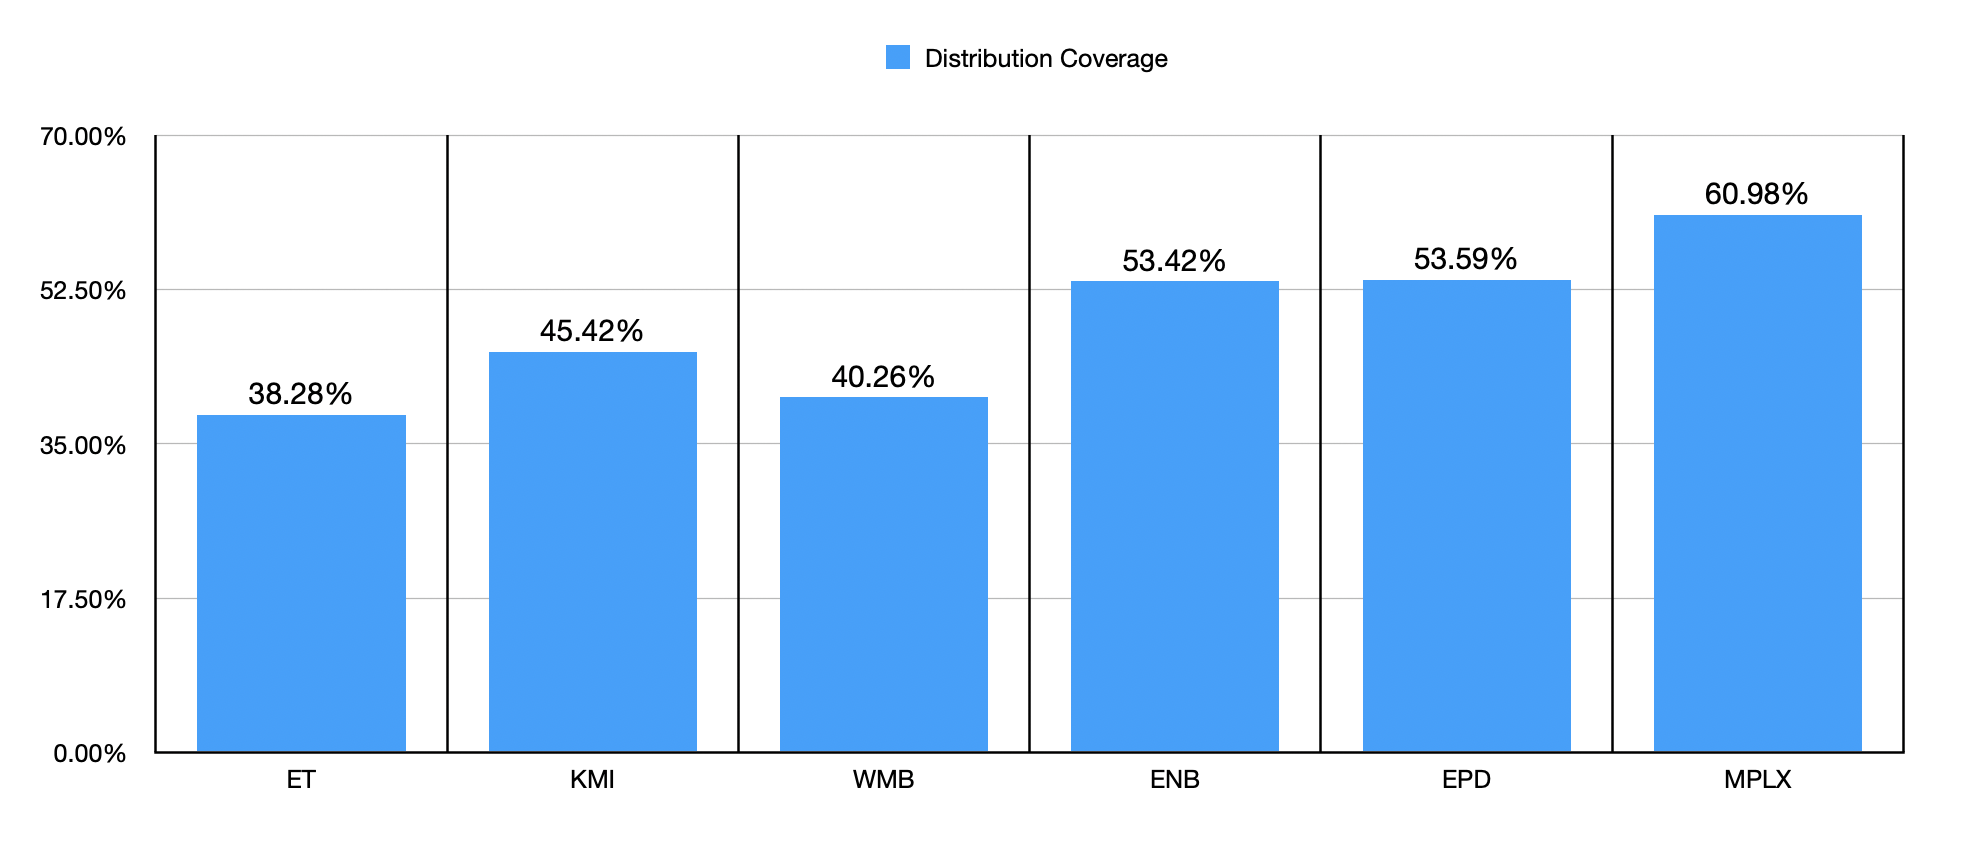
There are still some unknowns about the aforementioned purchase. But using what data management has provided and some reasonable estimates, I was able to figure out that, moving forward, the company should pay out around $4.20 billion of common distributions each year. Based on these estimates, that gives it a distribution payout ratio of 38.3%. As you can see in the chart above, I compared the company to five similar firms in terms of yield. That particular table shows that, with the exception of MPLX ( MPLX ), Energy Transfer has the highest yield of the group. But in the chart below, you can see that it also has the smallest amount of its operating cash flows going toward covering the distributions in question. This alone makes the yield look incredibly safe at this point in time.
Author
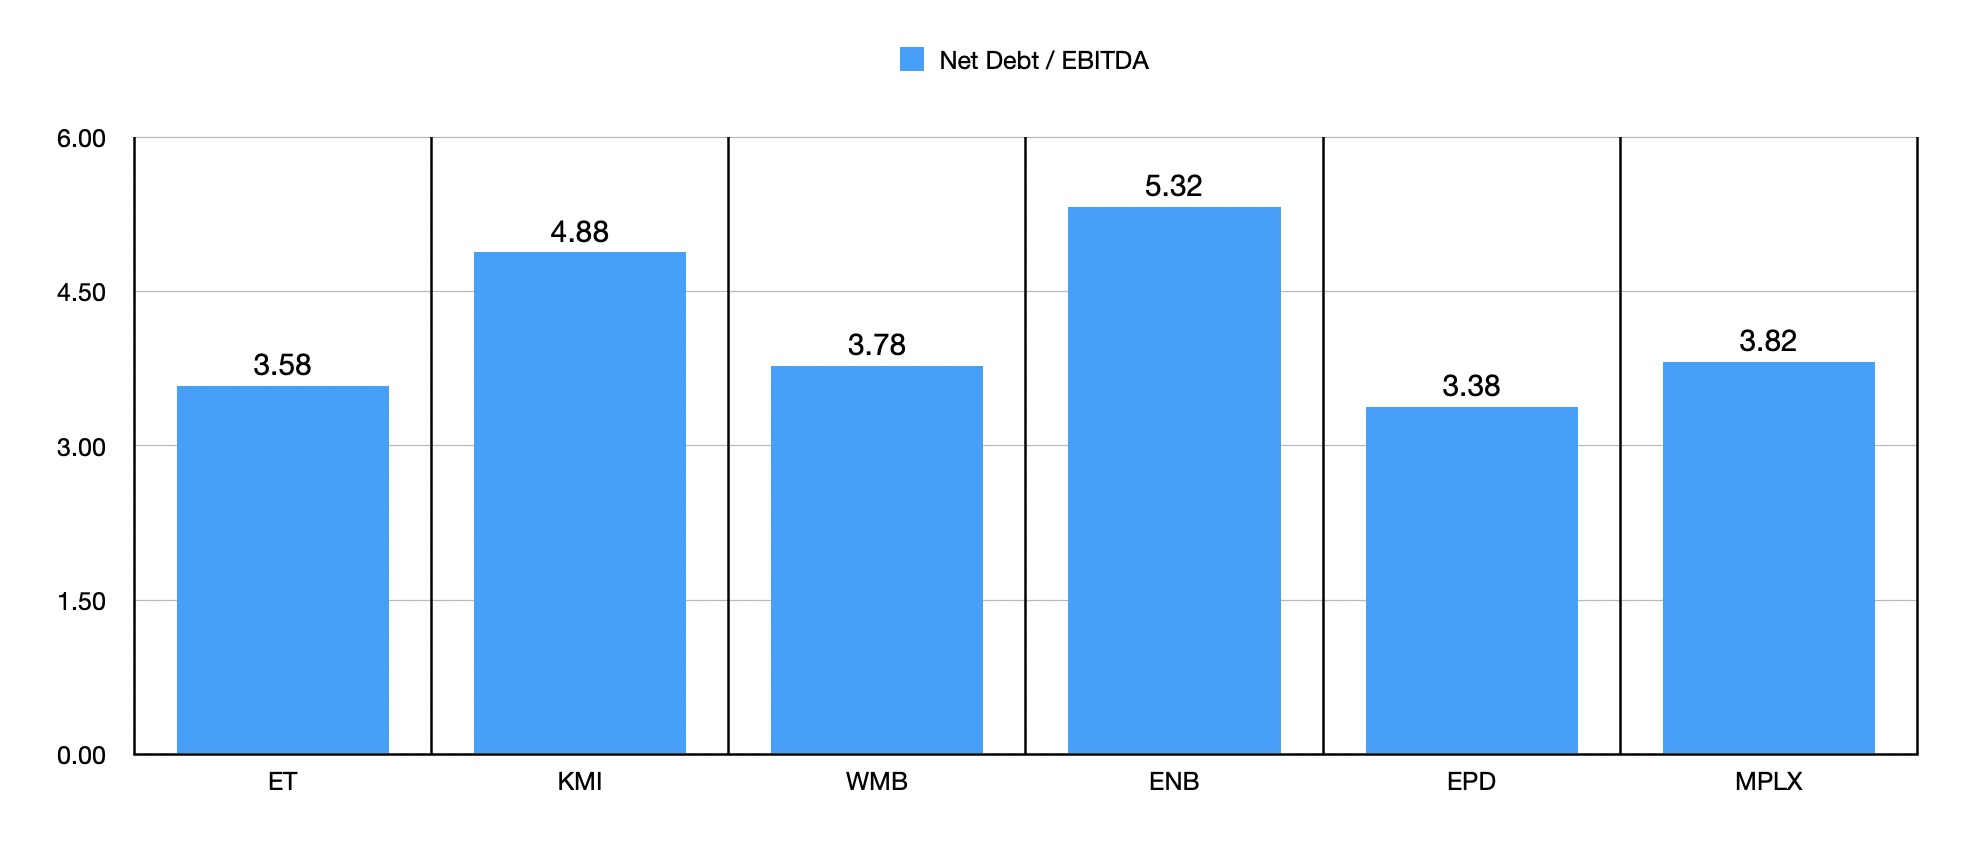
In the next table below, I then decided to look at one other important metric. And this is the net leverage ratio. Again, if debt is too high, distributions sometimes have to be cut. What I see is that its net leverage ratio is lower than any of the firms I paired it up against with the exception of Enterprise Products Partners ( EPD ), which is another business that I have previously assigned a bullish rating to. Management's goal has been to keep the net leverage ratio between 4 and 4.5, so the company is comfortably below that point, meaning that additional purchases might eventually be on the table. But for now, we are looking at a rather attractive cash cow.
Author
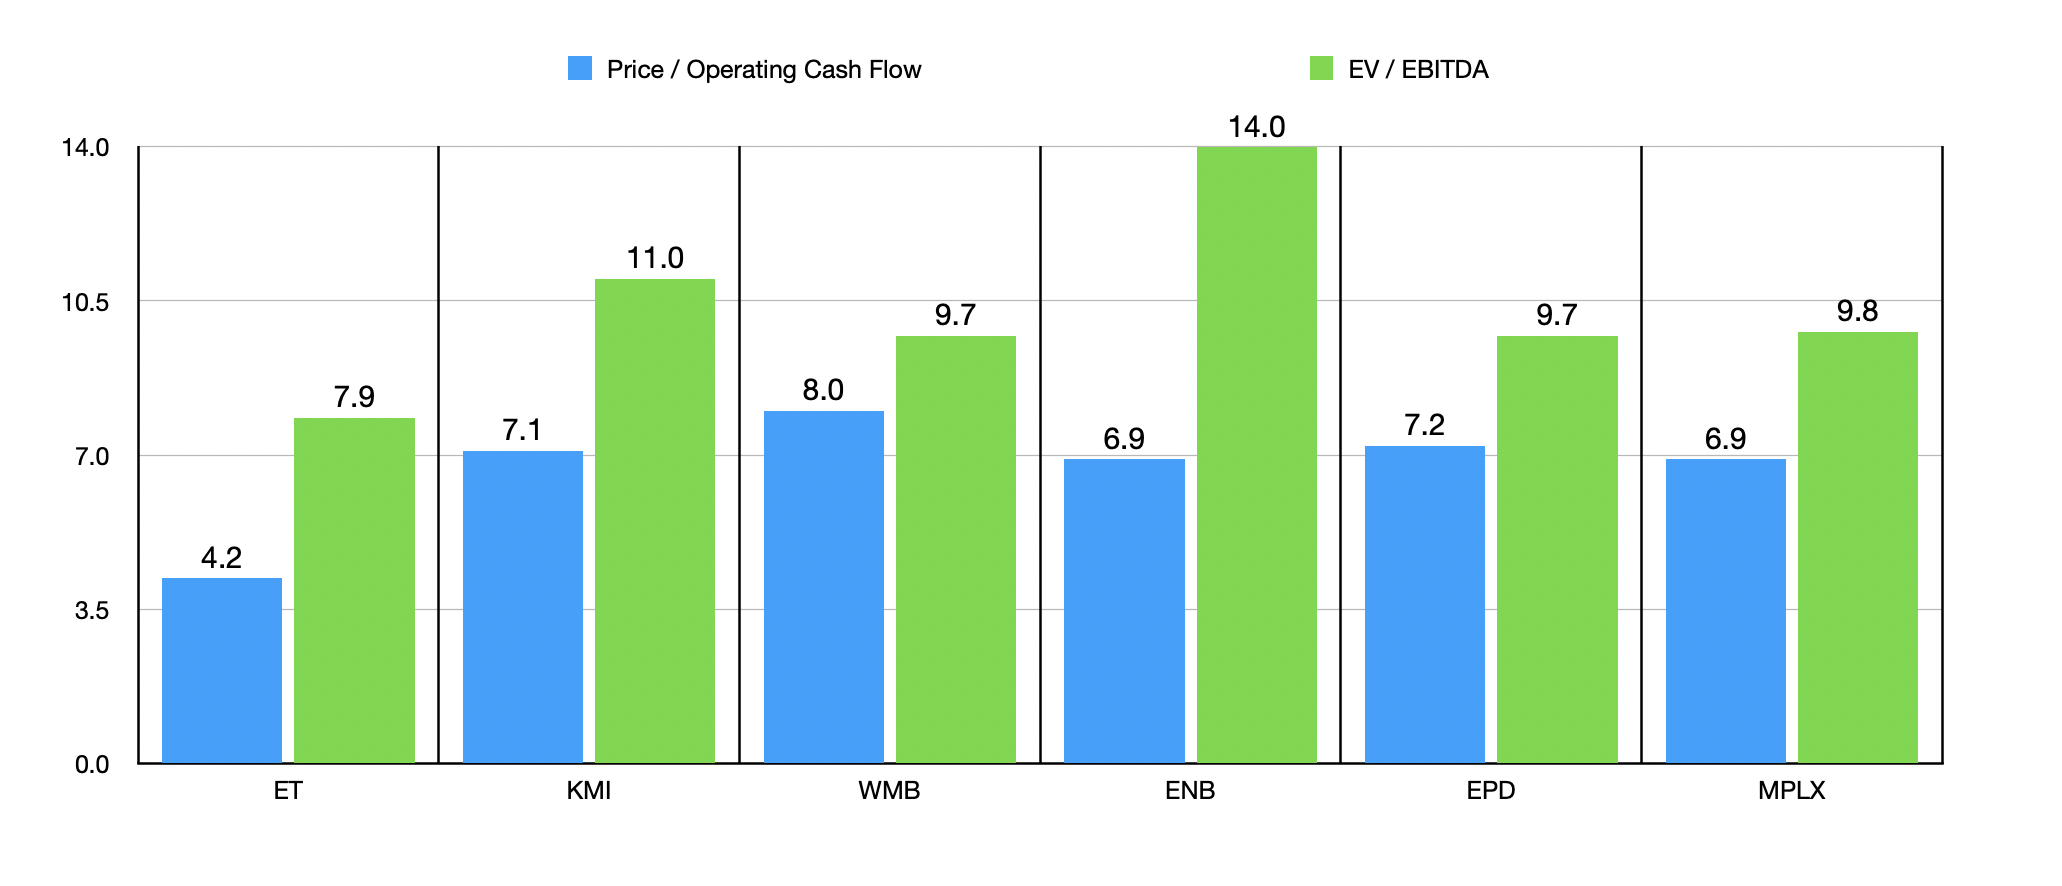
The last thing I need to point out is that, in addition to having a safe distribution that could be increased rather materially, Energy Transfer is also an incredibly cheap stock even after seeing its share price soar over the past couple of years. The firm is trading at a price to operating cash flow multiple of 4.2. The next cheapest of the five companies I compared it to is 6.9. If our prospect were to trade at that point, that alone would imply upside of 64.3%. Similar upside potential can be seen when looking at the picture through the lens of the EV to EBITDA multiple. With a reading of 7.9, it's comfortably cheaper than even the next cheapest that which is trading at a multiple of 9.7.
Author
Telecommunications for the win
Another really attractive company on the list that I happen to own a stake in is telecommunications conglomerate AT&T ( T ). In fact, as of this writing, it is my second largest holding, accounting for 16.7% of my portfolio and just like Energy Transfer, it’s rated a ‘strong buy’. As the company spun off Warner Bros and merged it with Discovery to create Warner Bros. Discovery ( WBD ) In early 2022, management ended up cutting the distribution. However, the current yield on the stock is 6.73%. This is truly one of the healthiest cash cows on the market that I have been able to find. This year, if everything goes according to plan, the company should generate around $16.5 billion or more in free cash flow. When you add back capital expenditures and strip out both preferred distributions and certain non-controlling interests, operating cash flow should be around $39.19 billion, while EBITDA should come in at around $45.92 billion.
Author
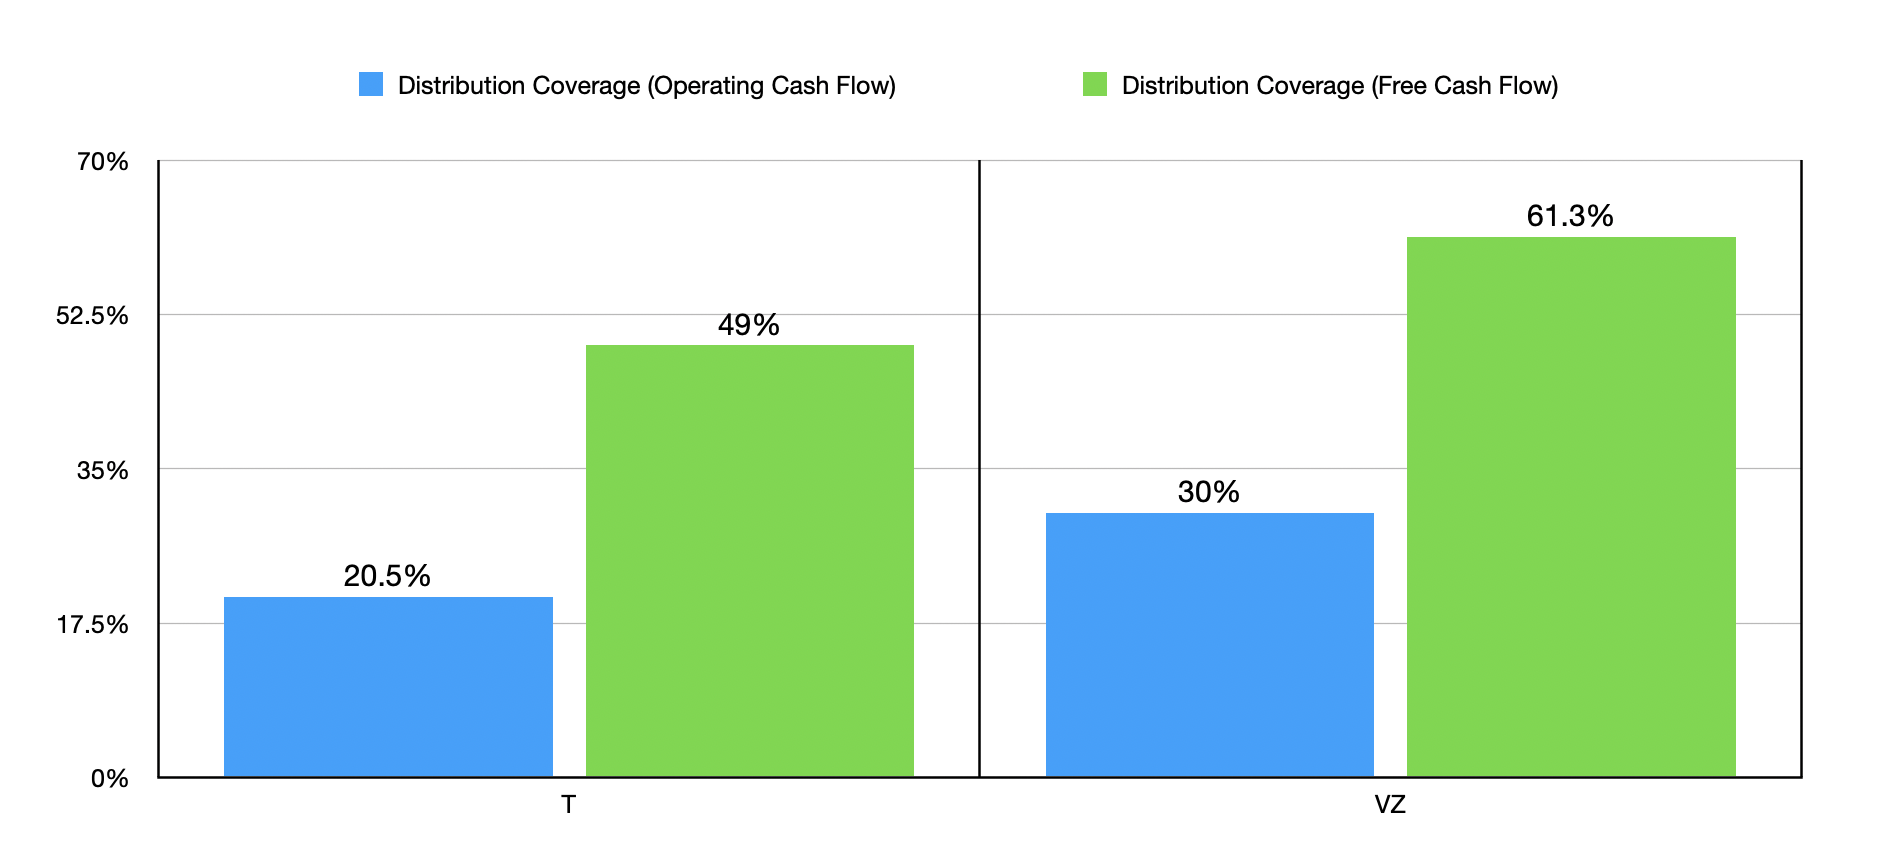
Total common distributions should be around $7.99 billion this year. When you do the math, this means that only about 20.5% of the company's operating cash flow goes toward paying distributions. This compares to the 30% I calculated for the other attractive yielder in the space, Verizon Communications ( VZ ). Of course, this is a capital-intensive industry, with companies in the space investing heavily in fiber and 5G growth. But even if you look at free cash flow, the data is encouraging. Only about 49% of its free cash flow, compared to 61.3% for Verizon, is going to cover distributions.
Author
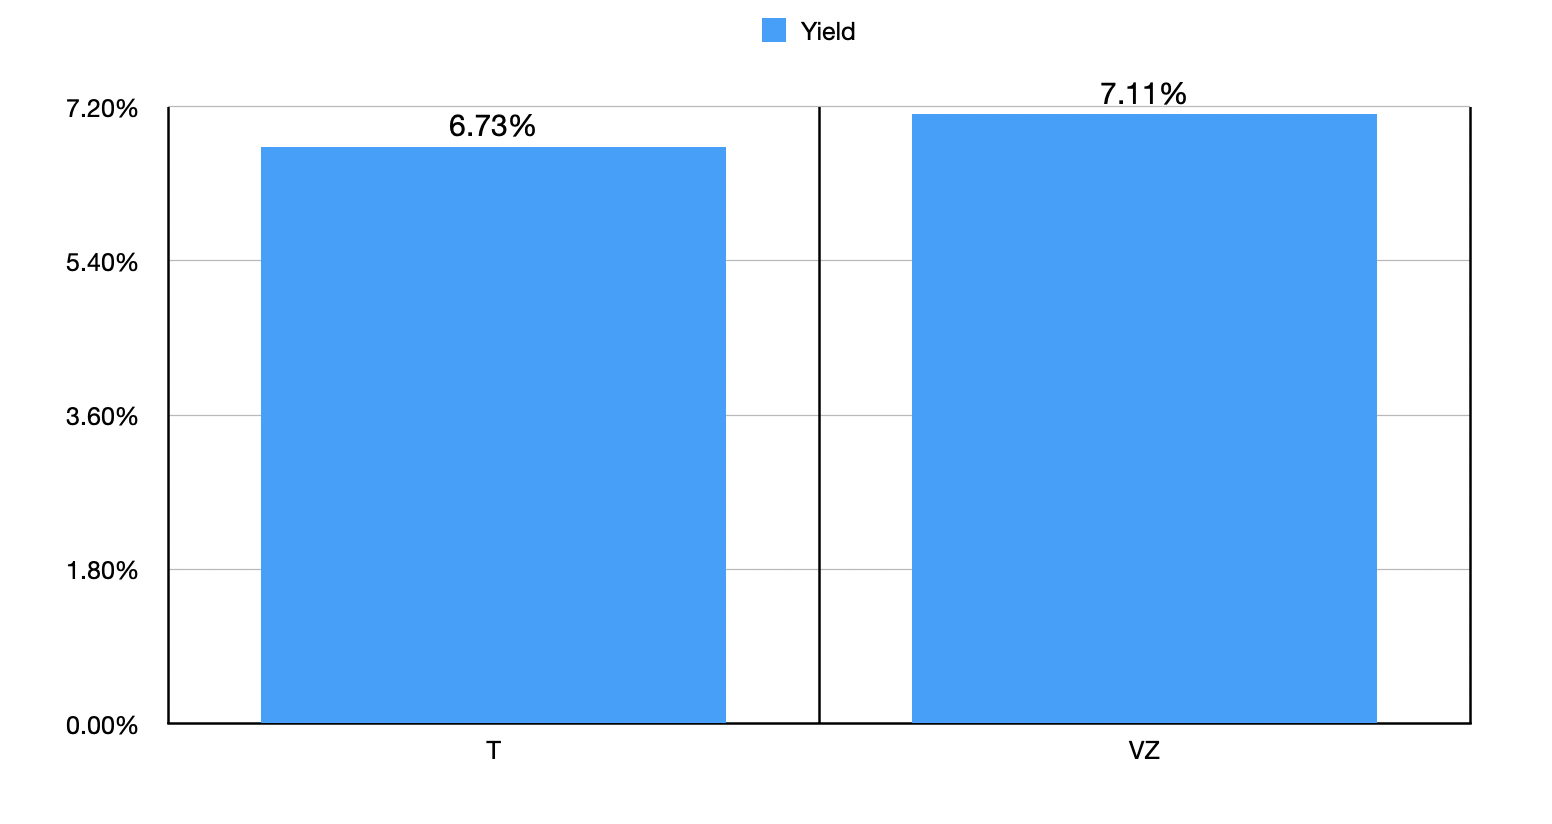
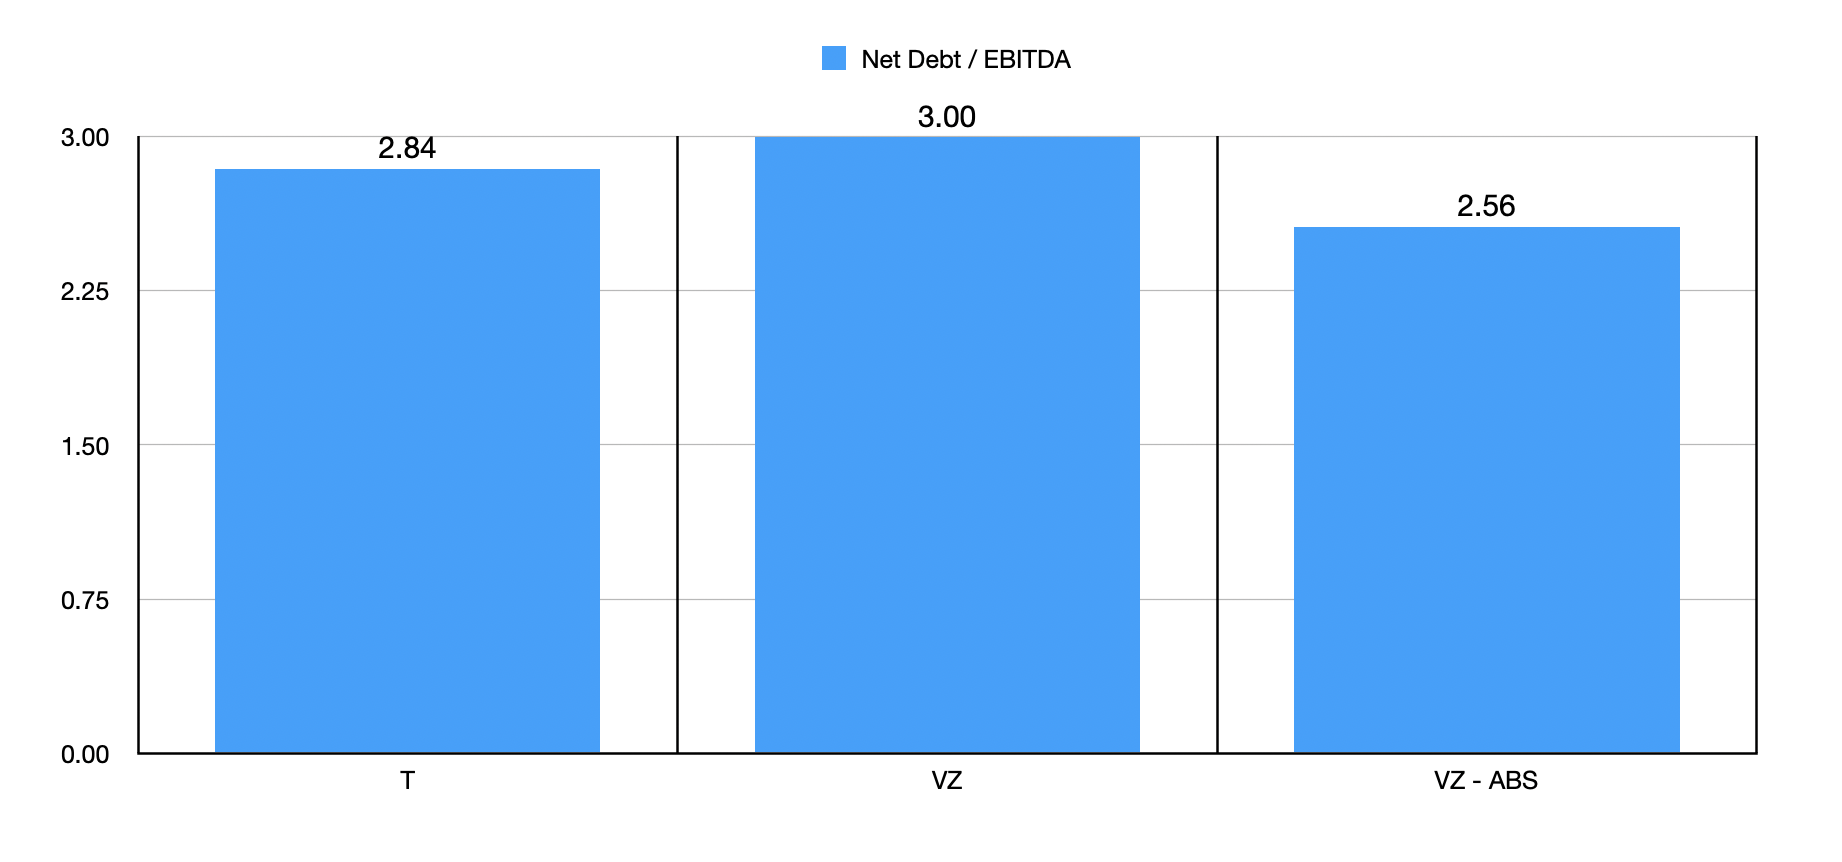
Investors who prefer Verizon over AT&T make a couple of different arguments as to why that is the case. One of the arguments is that while AT&T has a current yield of 6.73%, Verizon’s is a bit higher at 7.11%. But if AT&T were to use the same percent of operating cash flow to allocate toward its distributions as Verizon does, and if the share price of the company wouldn't change in response to that development, the yield for AT&T would jump up to 8.41%. Those who like Verizon might also point out that AT&T is considered a heavily leveraged business. But I find these claims to be baseless. Using the aforementioned estimates, the company has a net leverage ratio of 2.84. That's actually lower than the 3.0 supported by rival Verizon.
Author
Now, before you rush to the comment section to dispute this difference, it's important to note that about $21 billion of the debt on Verizon’s books is in the form of asset backed securities that are collateralized by certain receivables. I'll spare you the details, but it would be appropriate to remove this from the equation. Even if we do, however, you end up with a net leverage ratio for Verizon of 2.56. That's not materially different than what AT&T has. To get down to that point, AT&T would need to pay only about $12.9 billion toward its debt. And that's where a lot of the excess cash flows being produced by the company are currently going.
Author
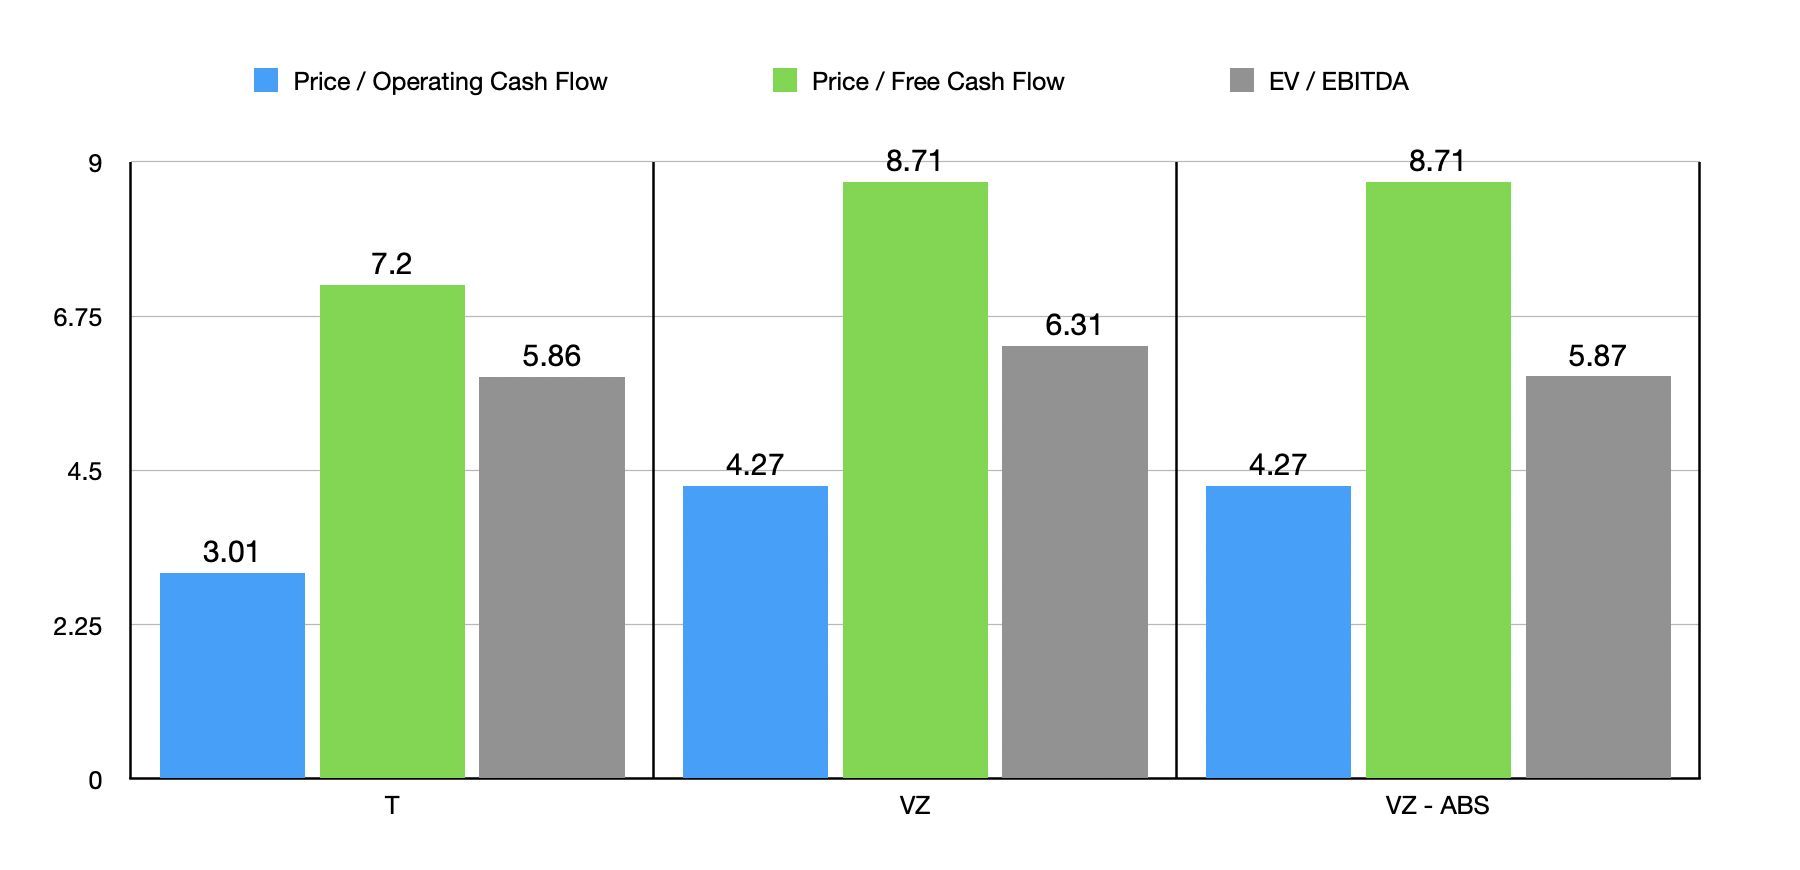
There's also the matter of how attractively priced these companies both are. In this case, I decided to look at three different metrics. The first would be the price to adjusted operating cash flow multiple. For AT&T, this number is 3.01. That compares to the 4.27 for Verizon. AT&T is also cheaper relative to free cash flow, with a price to free cash flow multiple of 7.20 compared to the 8.71 reported by Verizon. When it comes to the EV to EBITDA approach, if we remove the $21 billion in debt that I mentioned for Verizon, the companies are very similarly priced at multiples of 5.86 and 5.87. I would also make the argument that the industry as a whole looks to be very cheap. So I am of the opinion that both companies should appreciate from here. But with the extra wiggle room from a cash flow basis, debt that is under control, and a cheaper share price using two of the three pricing metrics that I utilized, I definitely view AT&T as the superior prospect.
When you need money now
Whenever the discussion of distributions comes about, the focus often shifts toward REITs and for obvious reasons. So long as the firms themselves follow the appropriate rules, they are able to avoid taxation at the corporate level, instead pushing that taxation onto shareholders. Because of the nature of real estate, many of the REITs that are out there also boast attractive and steadily growing cash flows. And so long as the assets in question are stable and well maintained, they are a pretty attractive way to generate long term returns.
Author
One of the most well-known REITs out there today is none other than Realty Income ( O ). But for me, this is a different kind of pick than the others. My argument regarding the other three companies on this list has to do with the size of the yield compared to similar firms, and/or the capacity for boosting that yield, and/or how cheap the stocks are. But with Realty Income, my argument is more centered around how secure the distribution is and when exactly investors receive the payouts in question.
Author
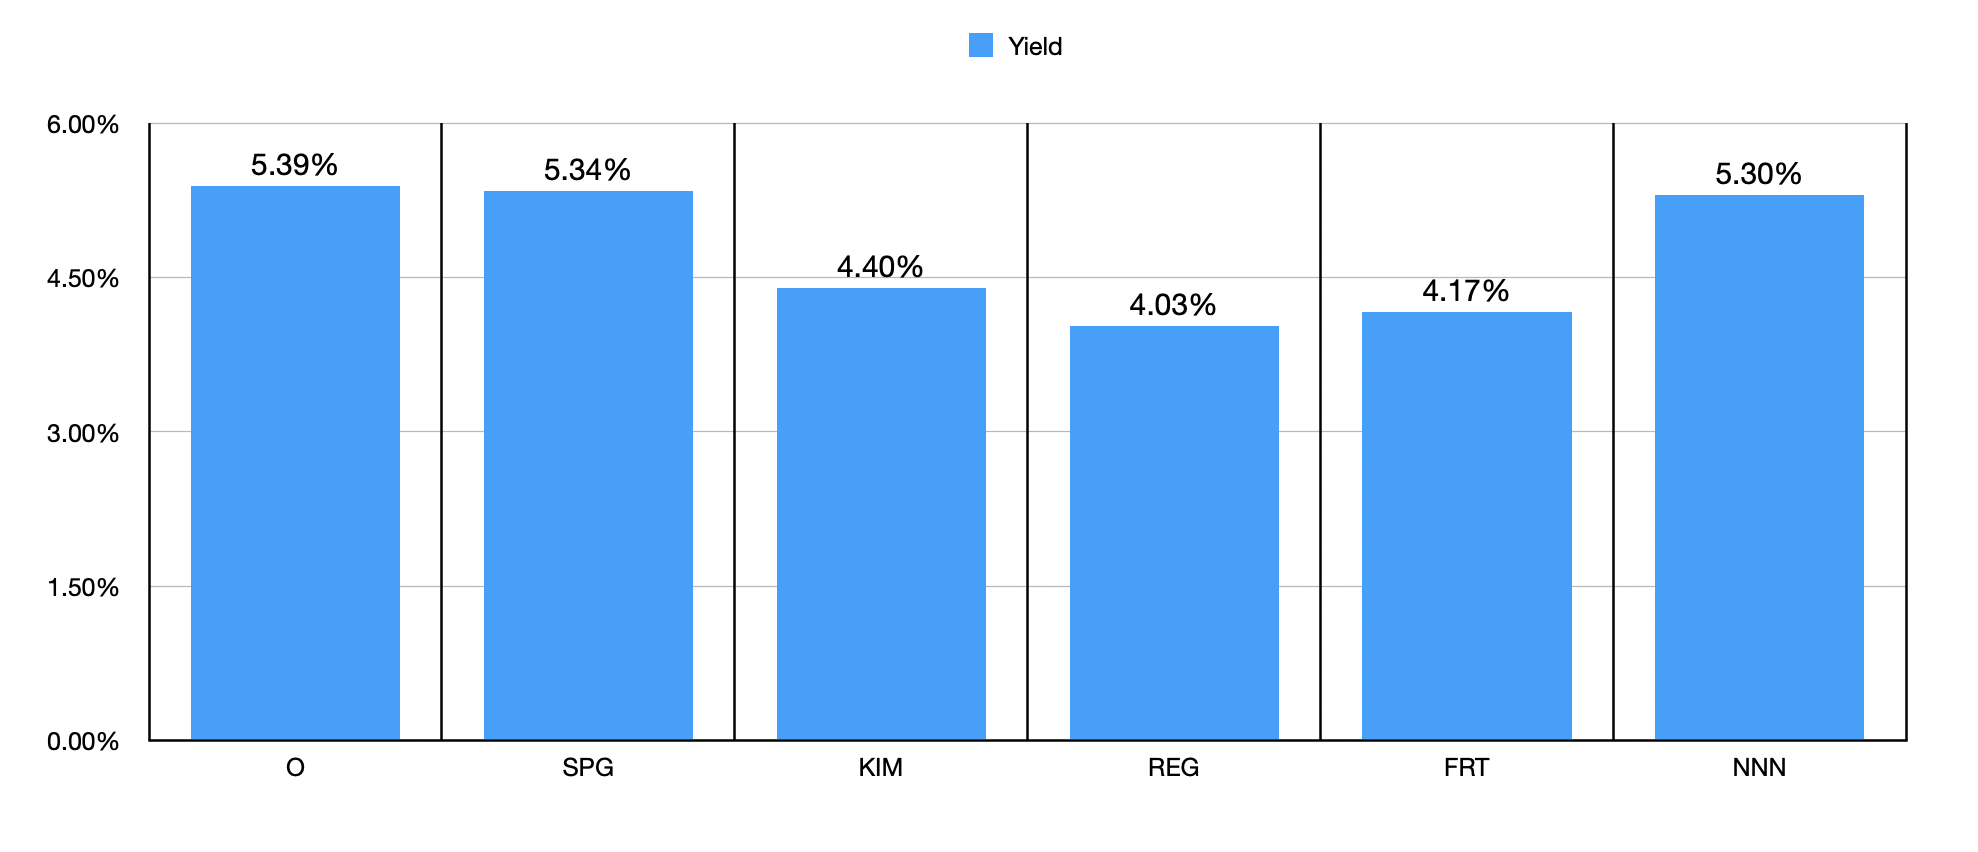
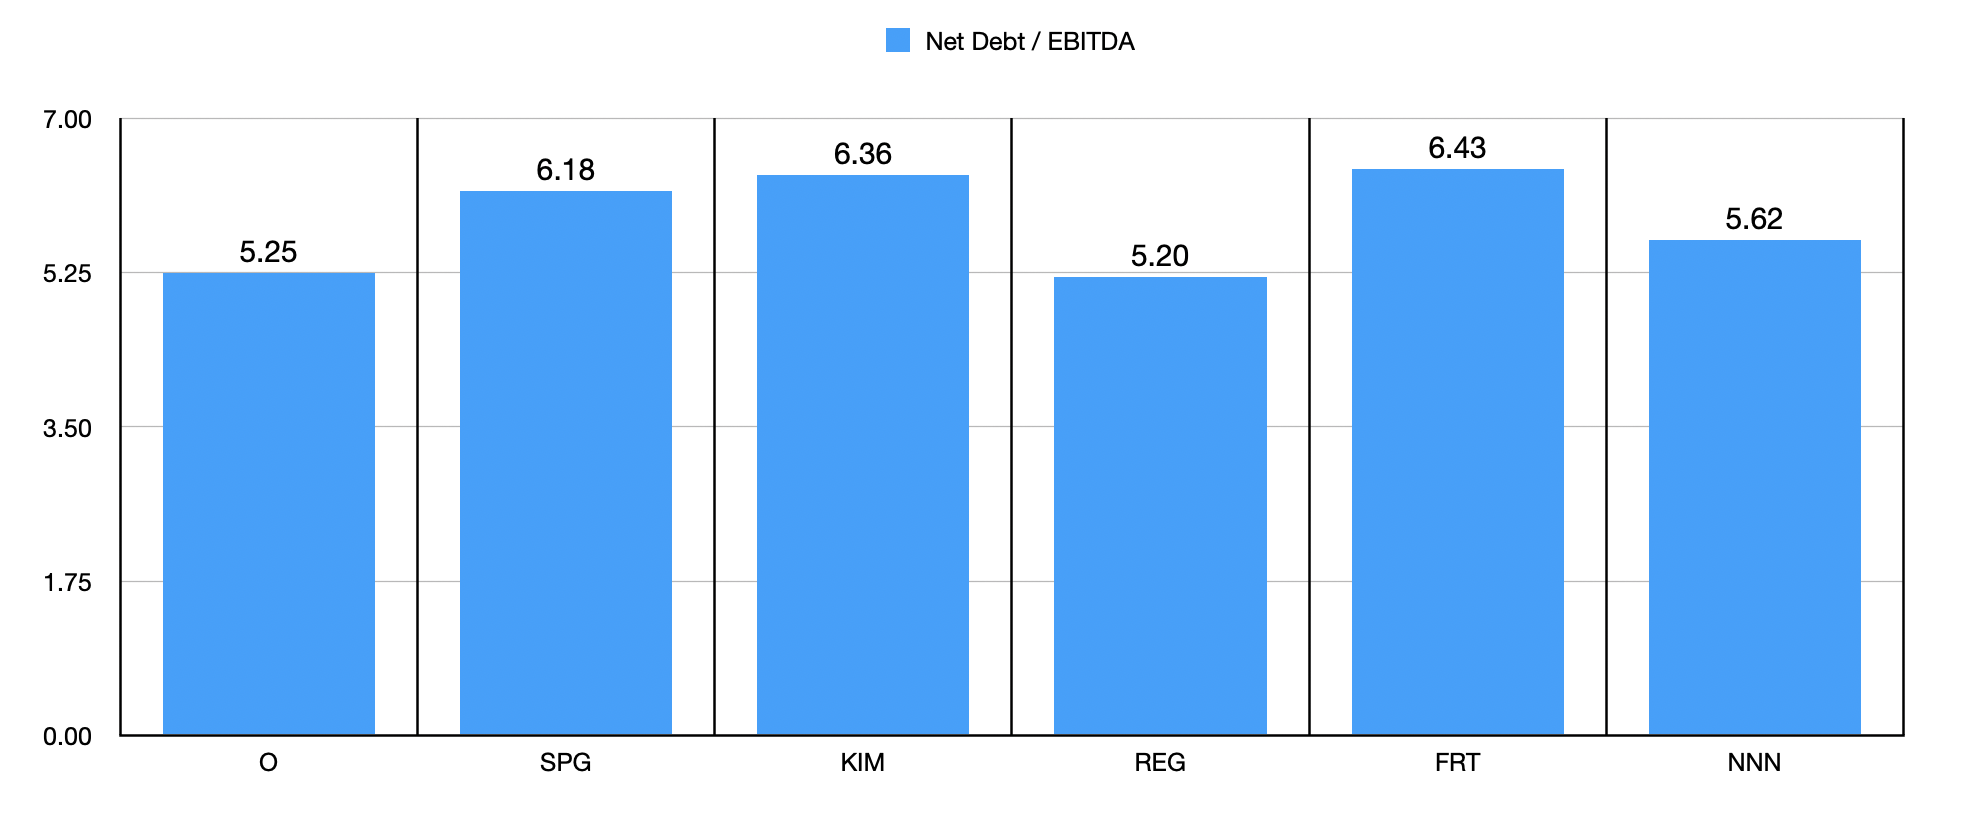
On the topic of security, it would be helpful for us to talk about overall leverage. As you can see in the chart above, the net leverage ratio for the company is 5.25. Generally speaking, REITs do have elevated leverage. And in this space, this amount is not exactly high. In that same chart, you can see that only one of the five companies I compared it to, Regency Centers ( REG ), has a net leverage ratio lower than what Realty Income currently offers. The rest are a bit higher by comparison.
Realty Income
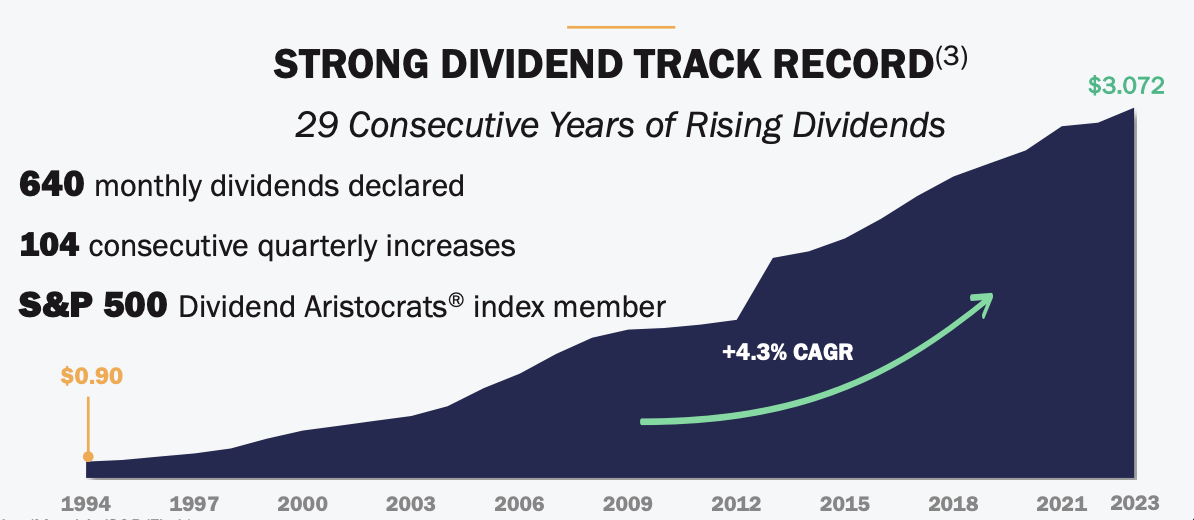
The other big reason why an investor might prefer Realty Income boils down to just how often distributions are received. You see, management has even trademarked the name, “The Monthly Dividend Company” because, unlike almost any other firm out there, it pays its distributions on a monthly basis rather than on a quarterly basis. Somebody needing regular, consistent income, might certainly gravitate toward a prospect like this. And what kind of assurance can beat a business that has been growing its distribution every year for the last 29 years? This is not as long as the 34 years that rival NNN REIT ( NNN ) has been growing its distribution . But when you add onto this the monthly payout as opposed to quarterly, as well as the lower leverage and marginally higher yield at this time, Realty Income might just make more sense for some investors.
Author
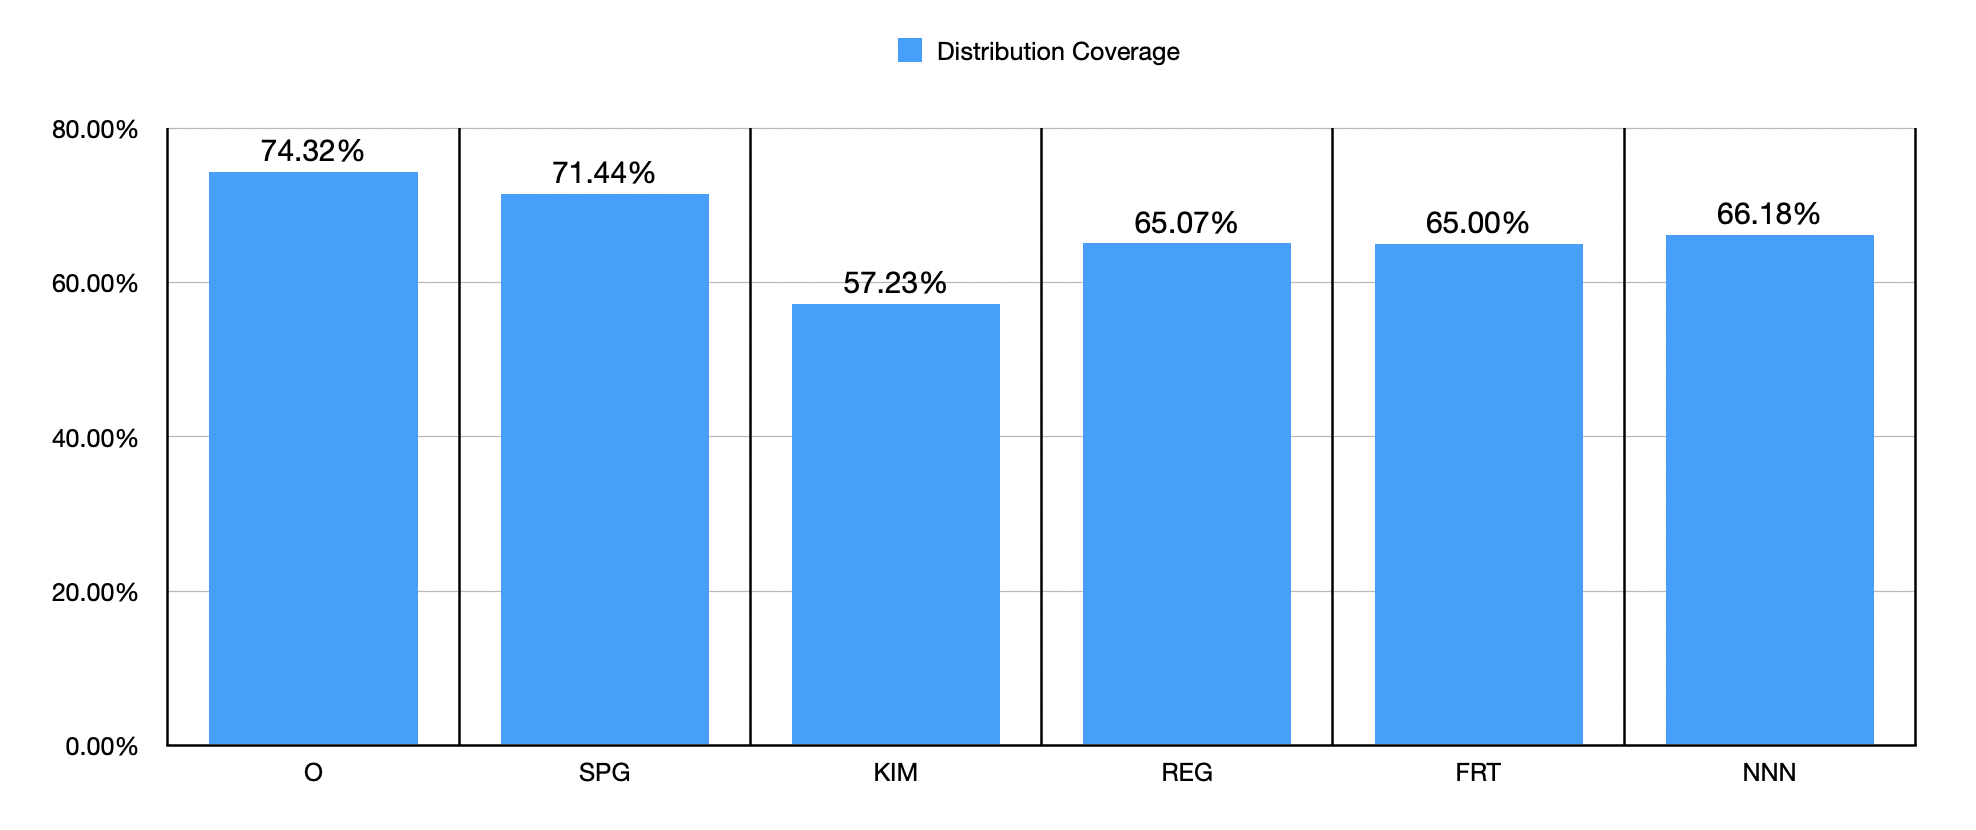
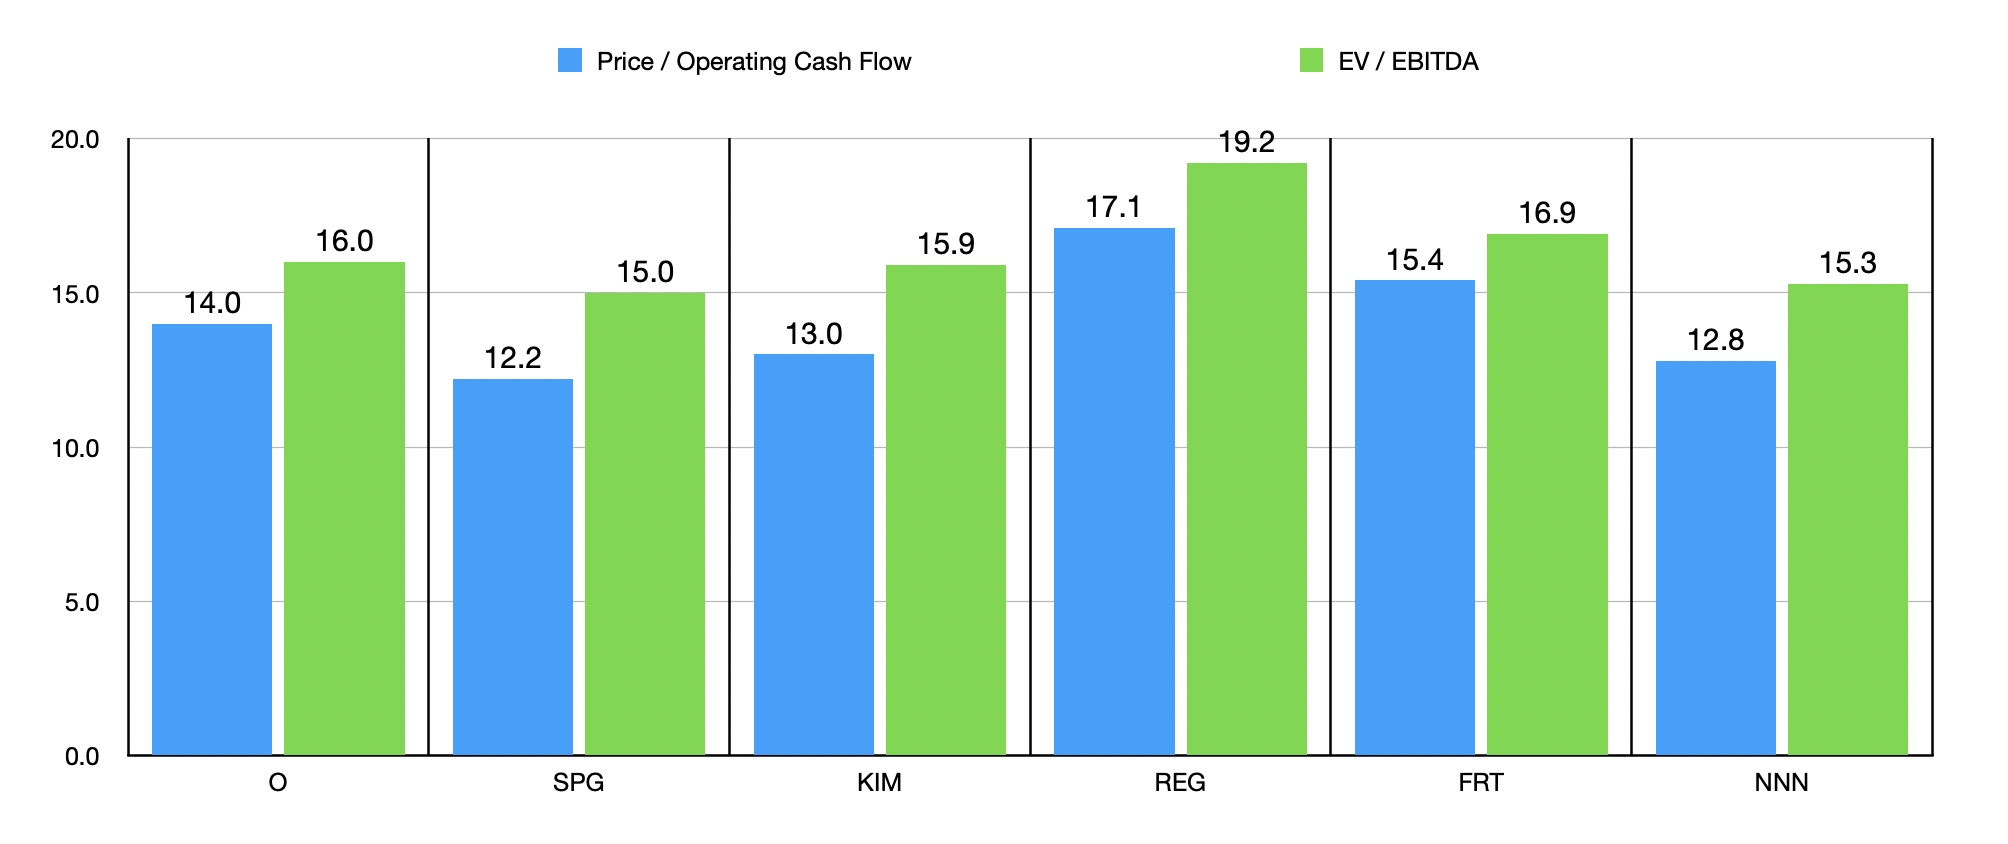
There is some downside to this stability and track record that investors should be aware of. The first thing to point out is that shares are not exactly the cheapest. On a price to operating cash flow basis, three of the five companies ended up being cheaper than it. The same holds true when we use the EV to EBITDA approach. On top of this, a whopping 74.32% of its operating cash flow goes toward paying its distribution. That's actually higher than any of its peers. Instead, management is intent on using some cash flows in order to grow. This year, for instance, management is spending around $9 billion on asset purchases. This, combined with its pending purchase of Spirit Realty ( SRC ) for $9.3 billion, will be instrumental in making the company the fourth largest REIT by enterprise value. At the end of the day, investors in Realty Income are willing to sacrifice a bit of capital appreciation in exchange for a slightly higher payout from a company with below average leverage in this space and a long history of paying distributions monthly instead of quarterly.
Author
Takeaway
I understand that there are so many different dividend candidates on the market. I'm sure other people would have a list that looks different from mine. However, when I set out to write this article, my goal was to find four high yielding prospects that offered different advantages and disadvantages relative to one another and that were not in the same space. I feel like I achieved that goal. We have a tobacco company that is undergoing a significant transformation, a pipeline business that is a true cash cow and that is trading at a steep discount to the competition, one of the world's largest telecommunications giants that could easily increase its distribution if it wanted to but that is currently paying down debt, and one of the largest REITs on the market that might not be the most attractive prospect in some respects, but that has its own advantages like monthly distributions and relatively low leverage. I would also wager that, over the long run, all four of these firms will outperform the broader market. That is especially true of the two that I rated a ‘strong buy’.
For further details see:
Four Dividend Kings To Ring In The New Year