C - FPA Crescent Fund Second Quarter 2022 Commentary
- First Pacific Advisors (FPA) is a Los Angeles-based institutional money management firm practicing a disciplined approach to value investing, prudently seeking superior long-term returns while maintaining a focus on capital preservation.
- The FPA Crescent Fund – Institutional Class (“Fund” or “Crescent”) declined 9.32% in 2022’s second quarter and declined 10.69% for the trailing twelve months.
- Market declines can be psychologically difficult, but are to be expected, and can be used to allocate capital towards re-priced and newly attractive opportunities.
- We believethat some of the ups and downs might prove ephemeral, but we address where our thesis is beingvalidated or where it mightbe broken.
| Average Annual Total Returns (%) |
| Trailing Performance (%) |
| Market Cycle Performance |
| As of Date: 6/30/2022 |
| Inception* |
| 20 Years |
| 15 Years |
| 10 Years |
| 5 Years |
| 3 Years |
| 1 Year |
| YTD |
| QTD |
| 3/25/00- 10/9/07 |
| 10/10/07- 6/30/22 |
| FPA Crescent Fund ( FPACX ) |
| 9.58 |
| 7.95 |
| 6.33 |
| 7.61 |
| 5.74 |
| 5.96 |
| -10.69 |
| -12.11 |
| -9.32 |
| 14.70 |
| 6.42 |
| S&P 500 |
| 9.68 |
| 9.08 |
| 8.54 |
| 12.96 |
| 11.31 |
| 10.60 |
| -10.62 |
| -19.96 |
| -16.10 |
| 2.00 |
| 8.37 |
| MSCI ACWI** 60% S&P 500 / |
| 8.76 |
| 7.00 |
| 6.21 |
| -15.75 |
| -20.18 |
| -15.66 |
| - |
| 4.48 |
| 40% Bloomberg US Agg |
| -7.92 |
| -7.14 |
| -6.72 |
| 8.50 |
| 7.37 |
| 6.23 |
| -10.24 |
| -16.11 |
| -11.63 |
| 3.97 |
| 6.57 |
| CPI |
| 2.50 |
| 2.52 |
| 2.39 |
| 2.60 |
| 3.88 |
| 4.97 |
| 9.00 |
| 5.43 |
| 2.65 |
| 2.75 |
| 2.39 |
| You should consider the Fund's investment objectives, risks, and charges and expenses carefully before you invest. The Prospectus details the Fund's objective and policies and other matters of interest to the prospective investor. Please read the Prospectus carefully before investing. The Prospectus may be obtained by visiting the website at www.fpa.com , by calling toll-free, 1-800-982-4372, or by contacting the Fund in writing. Past performance is no guarantee of future results and current performance may be higher or lower than the performance shown. This data represents past performance and investors should understand that investment returns and principal values fluctuate, so that when you redeem your investment it may be worth more or less than its original cost. Current month-end performance data, which may be lower or higher than the performance data quoted, may be obtained at www.fpa.com or by calling toll-free, 1-800-982-4372. The FPA Crescent Fund – Institutional Class (“Fund” or “FPACX”) total expense ratio as of its most recent prospectus is 1.17%, and net expense ratio is 1.14% (both including dividend and interest expense on short sales). Periods greater than one year are annualized. Fund performance is shown net of all fees and expenses. Fund performance is calculated on a total return basis which includes reinvestment of all distributions. Fund returns do not reflect the deduction of taxes that a shareholder would pay on Fund distributions or the redemption of Fund shares, which would lower these figures. Comparison to any index is for illustrative purposes only. An investor cannot invest directly in an index. The Fund does not include outperformance of any index or benchmark in its investment objectives. * The Fund commenced operations on June 2, 1993. The performance shown for periods prior to March 1, 1996 reflects the historical performance of a predecessor fund. FPA assumed control of the predecessor fund on March 1, 1996. The Fund’s objectives, policies, guidelines, and restrictions are, in all material respects, equivalent to those of the predecessor fund. ** The MSCI ACWI NR USD Index (“MSCI ACWI”) was not considered a relevant illustrative index prior to 2011 because the Fund was not classified as a global mandate until this point in time. Market Cycle performance for MSCI ACWI is being shown for illustrative purposes only to illustrate how global equities have performed in the current market cycle. Market Cycle Performance reflects the two most recent market cycles (peak to peak) defined as a period that contains a decline of at least 20% from the previous market peak over at least a two-month period and a rebound to establish a new peak above the prior market peak. The current cycle is ongoing and thus presented through the most recent quarter-end. Once the cycle closes, the results presented may differ materially. First Pacific Advisors, LP (the “Adviser” or “FPA”), the Fund’s investment adviser, has contractually agreed to reimburse the Fund for operating expenses in excess of 0.05% of the average net assets of the Fund, excluding management fees, administrative service fees, short sale dividend expenses and interest expenses on cash deposits relating to short sales, brokerage fees and commissions, redemption liquidity service expenses, interest, taxes, fees and expenses of other funds in which the Fund invests, and extraordinary expenses, including litigation expenses not incurred in the Fund’s ordinary course of business, through April 30, 2023. The Adviser has also contractually agreed to reimburse the Fund for redemption liquidity service expenses in excess of 0.0044% of the average net assets of the Fund through April 30, 2023. These agreements may only be terminated earlier by the Fund’s Board of Trustees (the “Board”) or upon termination of the Advisory Agreement. Effective September 4, 2020, the Fund’s management fee of 1% includes both an advisory fee of 0.93% and a class-specific administrative fee of 0.07%. Effective September 4, 2020, the current single class of shares of the Fund was renamed the Institutional Class shares. All data herein is representative of the Institutional Share Class. Please see important disclosures at the end of the commentary. |
Dear Shareholder
Performance Overview
The FPA Crescent Fund – Institutional Class (“Fund” or “Crescent”) declined 9.32% in 2022’s second quarter and declined 10.69% for the trailing twelve months. 1 The Fund generated 81.1% of the average of the S&P 500 and MSCI ACWI NR USD’s (“MSCI ACWI”) return in the trailing twelve months, underperforming its 75.0% average net risk exposure. 2 However, over the current market cycle, the Fund has performed favorably compared to the equity market on a risk-adjusted basis - capturing 99.9% of the average of the S&P 500 and MSCI ACWI’s return while taking on 64.4% net risk exposure, on average. 3
Below you can see the Fund’s performance along with various relevant indexes.
Exhibit A: Performance versus Illustrative Indices 4
| Q2 2022 |
| Trailing 12-month |
| Crescent |
| -9.32% |
| -10.69% |
| Crescent – Long Equity |
| -13.63% |
| -14.48% |
| MSCI ACWI NR USD |
| -15.66% |
| -15.75% |
| S&P 500 |
| -16.10% |
| -10.62% |
| 60% MSCI ACWI NR USD/ 40% BBg US Agg |
| -11.36% |
| -13.43% |
| 60% S&P 500 / 40% BBg US Agg |
| -11.63% |
| -10.24% |
During the first half of 2022, from peak to trough, the MSCI ACWI declined more than 20% for the third time since the great financial crisis. 5 As discussed in prior commentaries, we had been concerned about inflation and were running the Fund more invested than the recent past in an effort to protect purchasing power. 6 With an average net risk exposure of 75% during the first half of the year, the Fund was not immune to the market selloff, capturing 64% of the average market decline (based on the average return of the S&P 500 and MSCI ACWI indices).
The decline in global equity indexes was broad-based, leaving little unscathed, with energy as one of the few exceptions, as rising interest rates, high inflation, fears of a weakening economy, and greater caution around funding risky, money-losing companies. Market declines can be psychologically difficult, but are to be expected, and can be used to allocate capital towards re-priced and newly attractive opportunities. We are predisposed to lean into price weakness by adding to what we believe are quality businesses at increasingly attractive prices, acquiring debt at equity-like returns, building positions in long-admired franchises, and occasionally seeking out opportunities in distressed and deeply out-of-favor situations.
Portfolio discussion
Exhibit B: Trailing Twelve-Month Contributors and Detractors as of June 30, 2022 7
| Contributors |
| Perf. Cont. |
| Avg. % of Port. |
| Detractors |
| Perf. Cont. |
| Avg. % of Port. |
| Sound Holding |
| 1.03% |
| 0.5% |
| Meta Platforms ( META ) |
| -1.55% |
| 2.5% |
| FPS LLC |
| 0.70% |
| 1.1% |
| Comcast ( CMCSA ) |
| -1.04% |
| 3.3% |
| Glencore ( GLCNF ) |
| 0.63% |
| 2.2% |
| Charter Communications ( CHTR ) |
| -0.86% |
| 2.4% |
| Meggitt ( MEGGF ) |
| 0.55% |
| 0.2% |
| -0.83% |
| 2.2% |
| Interest Rate Caps (multiple) |
| 0.49% |
| 0.4% |
| Citigroup ( C ) |
| -0.75% |
| 2.2% |
| 3.40% |
| 4.5% |
| -5.02% |
| 12.7% |
In the last twelve months, Crescent’s top five performers contributed 3.4% to its return, while its bottom five detracted 5.0%. We believe that some of these ups and downs might prove ephemeral, but we address where our thesis is being validated or where it might be broken.
Sound Holding & FPS LLC – The global shipping market is subject to extreme cyclical swings. Due to institutional imperatives, public market constraints and misalignment of interest, we have not believed that investing in this sector’s public equities is the best way to take advantage of these cycles. We prefer the contrarian approach of buying vessels at below replacement cost, operating with minimal leverage, and exiting when values incent new vessel construction as we believe that can lead to attractive, less-correlated long-term equity-like returns, with modest risk of permanent impairment. In response to depressed container ship values, in 2013, we began to make direct ship investments in partnership with industry operators. Over the years, the Fund has also bought and participated in loans to container, dry bulk, chemical and oil service vessels. Because Sound Holding and FPS LLC invest directly in shipping and service vessels, and we control the equity of Sound Holding and FPS, we make the purchase/sale and capital distribution decisions, positioning us to buy at attractive prices, finance conservatively, and exit opportunistically. With the rebound in the global economy combined with boats being scrapped, supply and demand tipped in favor of container vessel owners, allowing the Fund to exit its spot container positions at premiums to acquisition cost, resulting in recognized gains. We expect distribution of sale proceeds in the third quarter to reduce the Sound Holdings position. FPS’ increase in price caused it to become a top ten fund holding. FPS is primarily comprised of oil service vessels. Given supply and demand dynamics for oil service vessels, we are cautiously optimistic.
Glencore is one of the largest globally diversified commodity businesses operating both industrial and marketing businesses. Importantly, we believe Glencore operates in a genuinely shareholder-oriented manner. Crescent purchased Glencore off-and-on from 2018 through 2020 at what we believe is a single digit multiple of normal earnings power. The opportunity presented itself when investors were less willing to own commodity sensitive businesses due to a period of low inflation and general disregard for valuation. Net of distributions of above average cyclical profits likely to be earned in 2022, we believe the company still trades at an attractive valuation relative to its long-term earnings power, justifying its continued presence in the Fund.
Our investment thesis on the names that have detracted from performance have not materially changed but highlight the following three.
Prosus’ stock price has declined along with the values of their investment portfolio. Our thesis has somewhat improved as management recently announced a share repurchase program that will be funded, in part, by periodic and partial sales of its Tencent holding. Given that its stock price trades at a greater than 35% discount to its estimated net asset value ((NAV)), share repurchases should be accretive. The Company’s stock price has appreciated 26% since the announcement. 8
Charter and Comcast , the Fund’s investment in the US cable industry, is an example of us leaning into fear. These investments have underperformed in the last year but still trade above the Fund’s cost basis. The industry has been plagued by fears of video cord cutting, and competition from 5G and Fiber to the Home. This allowed us to buy and to continue to hold both Comcast and Charter Communications. These businesses trade at what we believe are reasonable valuations and we think should have attractive growth in free cash flow over the next decade. We expect that they will allocate that free cash flow in the best interest of shareholders, given that they are controlled by owner-operators.
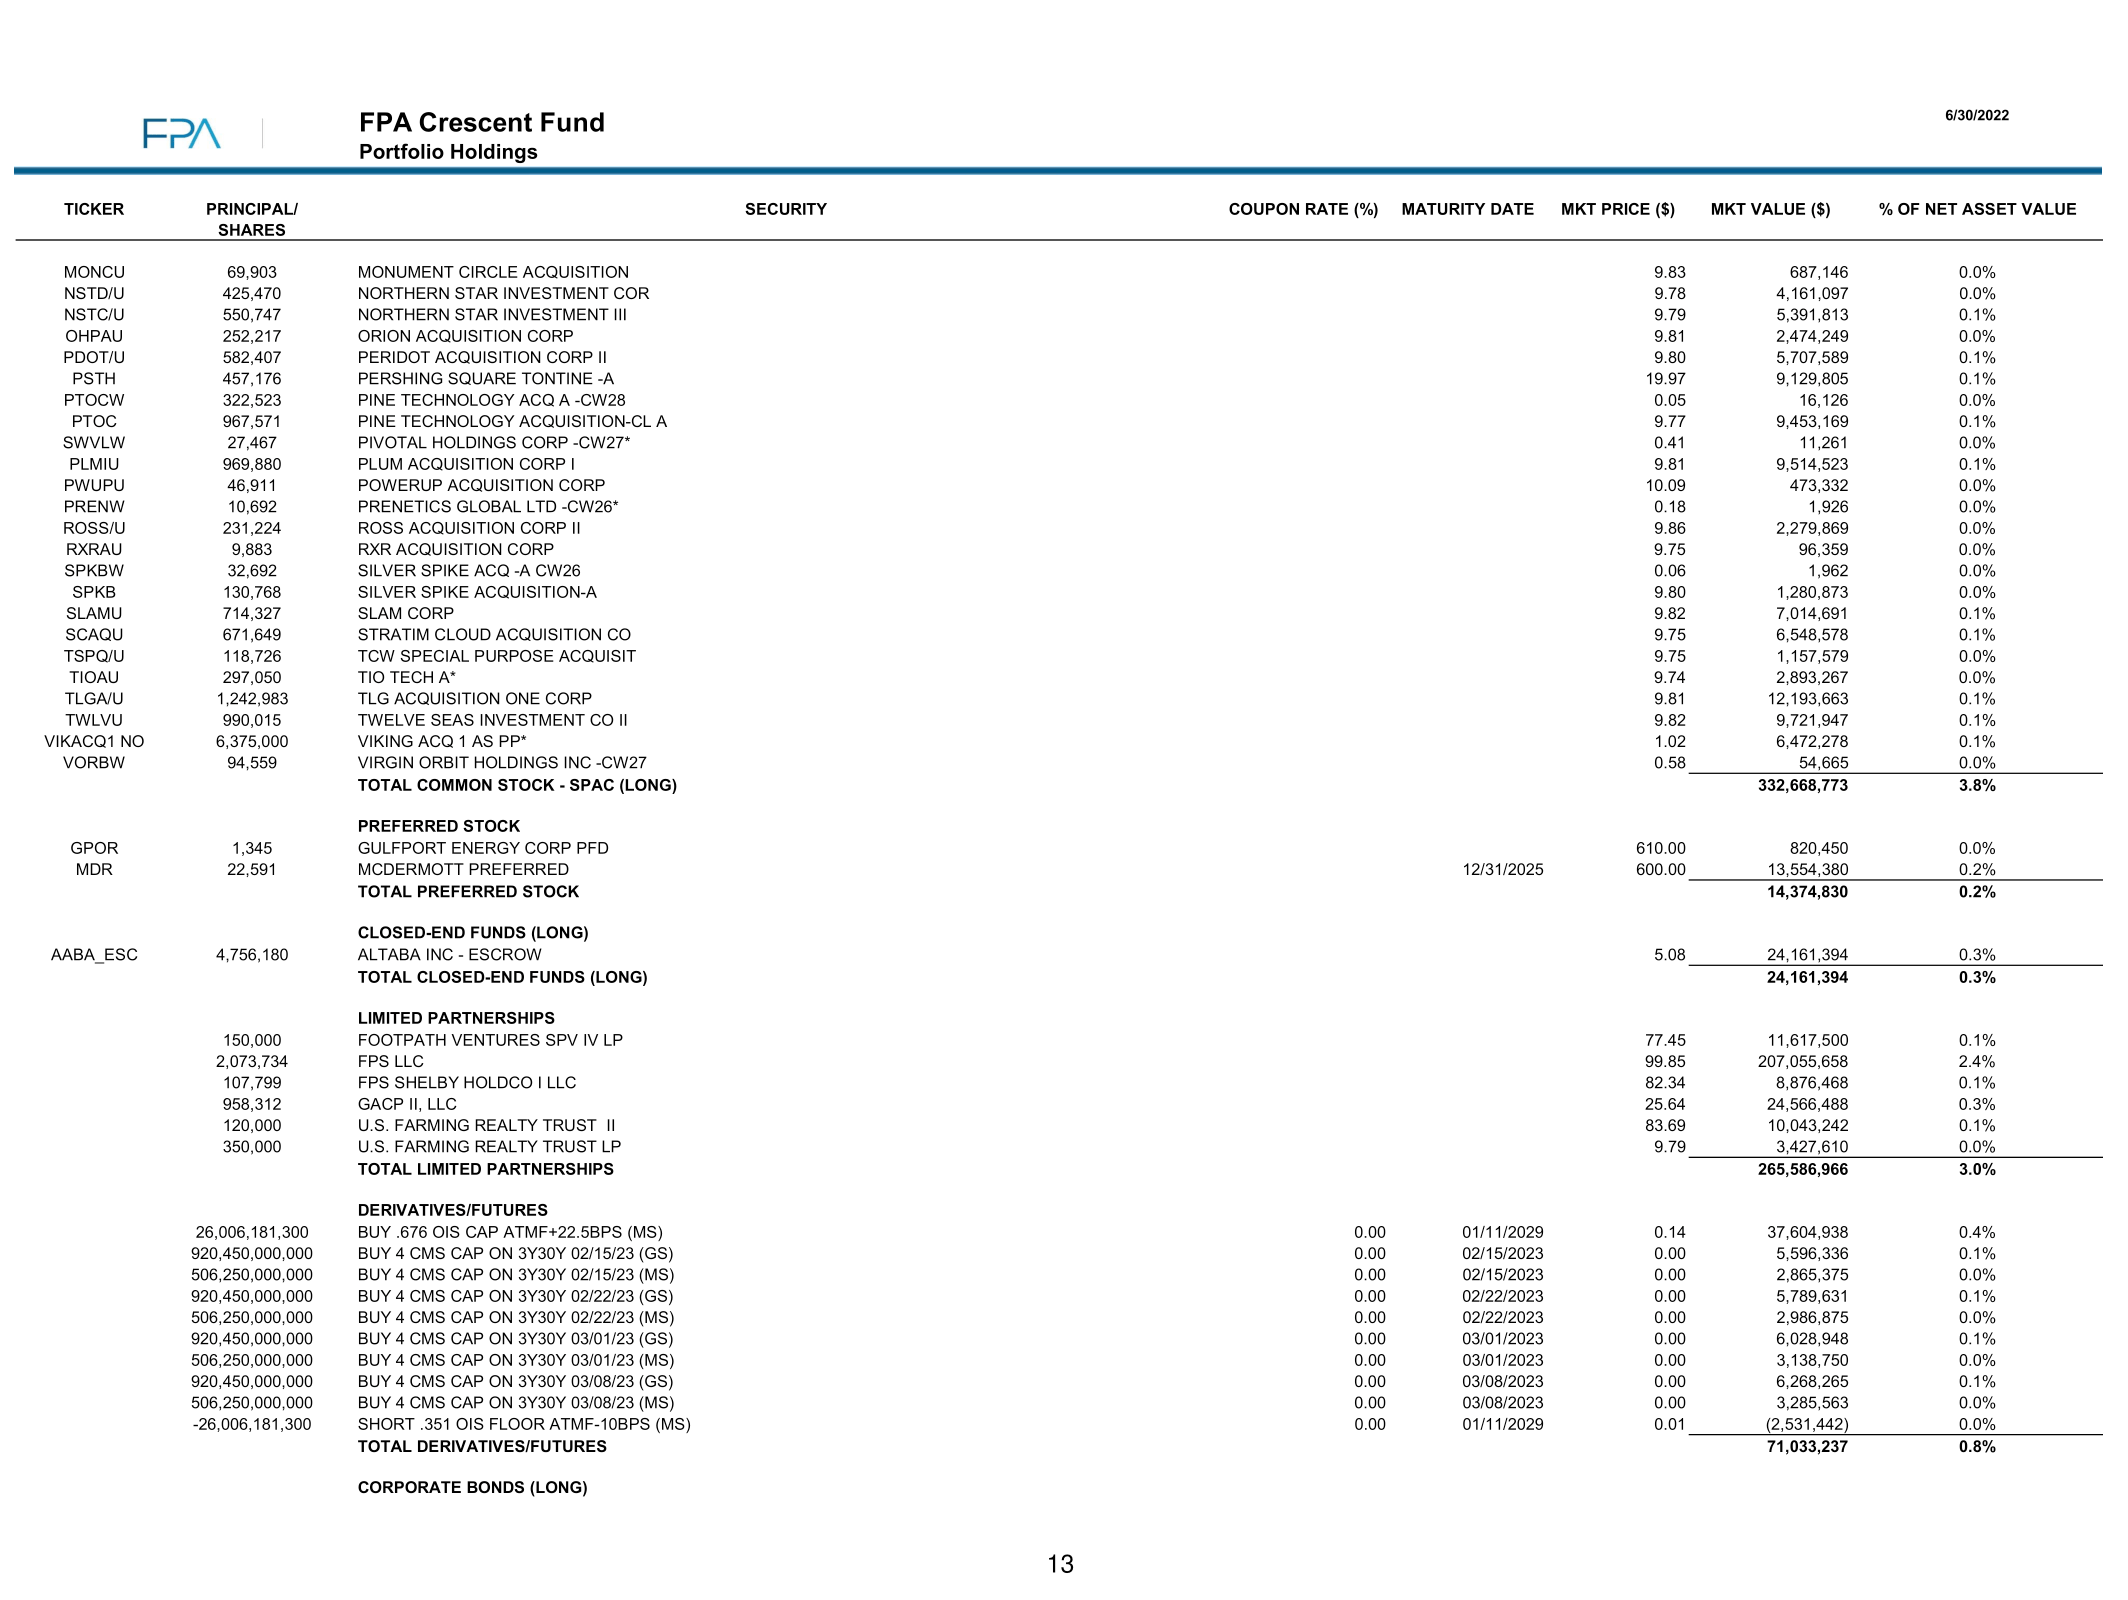
Exhibit C: Portfolio Composition 9
| Risk Asset |
| Q2 2022 |
| Q1 2022 |
| Q2 2021 |
| 5yr Average |
| Common Stock, Long |
| 70.0% |
| 71.5% |
| 77.1% |
| 70.7% |
| Common Stock, Short |
| 0.0% |
| -0.5% |
| -3.0% |
| -5.3% |
| Credit, Long |
| 1.5% |
| 0.6% |
| 1.2% |
| 3.8% |
| Credit, Short |
| 0.0% |
| 0.0% |
| -0.2% |
| -0.3% |
| Other |
| 4.0% |
| 2.8% |
| 1.7% |
| 2.0% |
| Exposure, Net |
| 75.5% |
| 74.5% |
| 76.9% |
| 71.0% |
Crescent had net exposure at the end of the second quarter of 75.5%, marginally higher (just 1%) than its exposure at the end of the first quarter. With the stocks having declined as much as they have, the 1% increase in exposure belies the greater activity when you scratch below the surface. We added seven new positions to the Fund and exited three in the quarter. Some of the new positions the Fund has taken include CarMax ( KMX ) and as noted earlier, investments in convertible bonds.
CarMax has three operating segments: used retail, used wholesale, and used auto lending. The general market decline and recession concerns have caused its stock price to decline by almost half since it peaked in Q4 2021. CarMax is the largest U.S. company in the used car retail space. We think CarMax has the opportunity to gain share in the market due to its strong wholesale business, historically good returns on capital, and an excellent management team that invests for the future and allocates capital with an owner- oriented mindset. 10 Recessionary concerns are valid as their lending business, in particular, will likely be hurt. We would not be surprised to see its stock price decline as a result and would consider the opportunity to increase the Fund’s stake at that time.
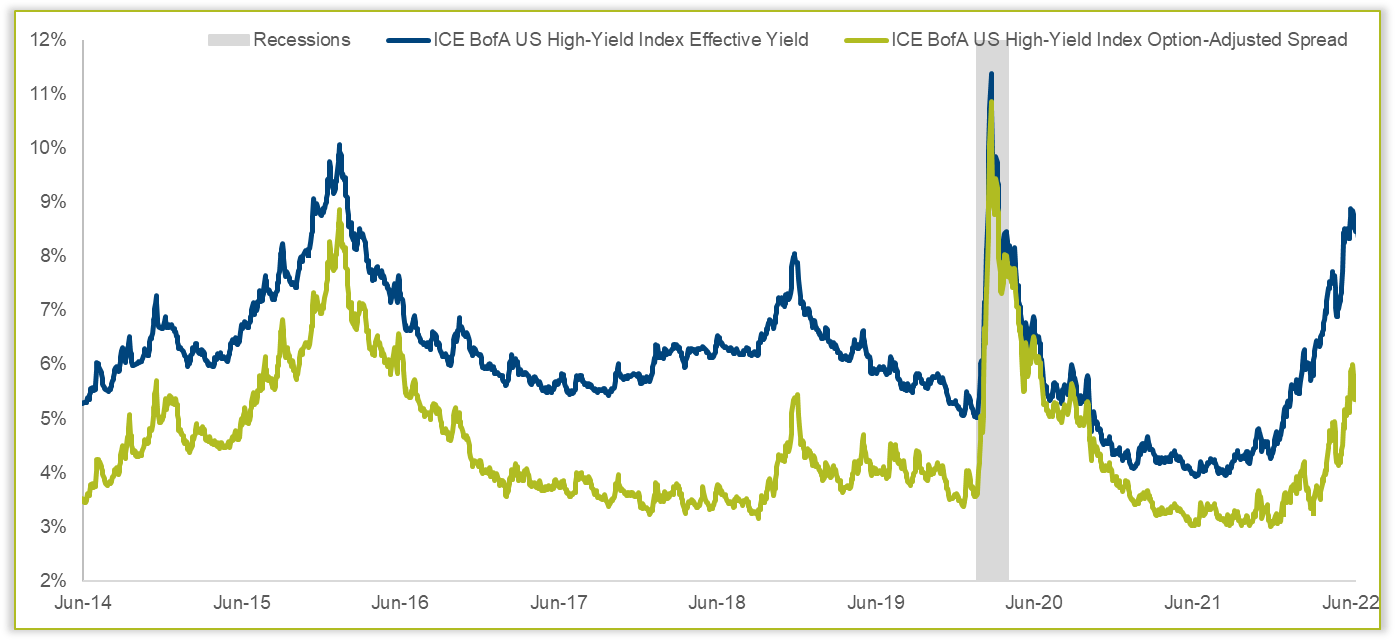
Convertible Bonds – High-yield exposure in Crescent reached an all-time low of just 0.2% in Q4 of last year, below the Fund’s five-year average of 4% and long-term average since inception of 9%. We explained in Q4 2021 this low exposure was because of historically low yields and spreads to Treasuries. Since Q4, the high-yield bond index has declined 10% as both Treasury yields have increased, and credit spreads have widened. We have begun to see some compelling risk-adjusted opportunities in convertible bonds specifically for the first time since 2000. Many stocks have seen a tremendous decline in price, particularly those companies that are still in their earlier stages with business models that have yet to be optimized.
Some of these companies had raised money to fund their growth via convertible bonds initially with yields of 1% and lower. With the conversion price now well out of the money due the decline in their stock prices, the bonds have traded down and now offer what we believe are attractive yields to intermediate term maturities that leave some optionality should these businesses succeed. If this is the case, we would expect the market to reward them with a higher stock price that should translate to a higher bond price; and an outside chance that the convertible feature pays off prior to maturity. The average yield-to-maturity of these bonds is currently 11.5%, 310 basis points better than the 8.4% yield currently offered in the high-yield market. 11 The allocation to these bonds is small for now, but we are hopeful a combination of a further increase in interest rates and continued stock market volatility may allow us to increase the allocation to this space.
Outlook (observations on current environment)
We are often asked about our “outlook.” Which is kind of funny because we have never made a market forecast and, like everyone else, are regularly surprised by world events. While there is always plenty to worry about (insert list of worries), we agree with Jamie Dimon, who on JP Morgan’s second quarter 2022 call, in response to a question about pending economic hurricanes, observed “going through a storm, -- that gives us opportunities, too. I always remind myself the economy will be a lot bigger in 10 years, we’re here to serve clients through thick or thin.” There will always be a place in the portfolio for good businesses at good prices, and you should expect to see the Fund’s risk exposure increase should those prices become attractive. As always, we will be conservative in our underwriting, and let price be our guide.
Despite our no-market prediction philosophy, we do think it is useful to observe current conditions and pricing for financial assets, in order to avoid potholes, focus research attention and calibrate risk appetite.
In bonds, we mentioned the initial fruits of our labor in convertible bonds. Stepping back, we would observe that the high-yield market is approaching 2016 and 2020 yield levels, but credit spreads are still below the 800+ basis point spreads seen in both of those periods, despite there being no official recession in 2016.
Exhibit D: US High-Yield Effective Yield and Option-Adjusted Spread 12
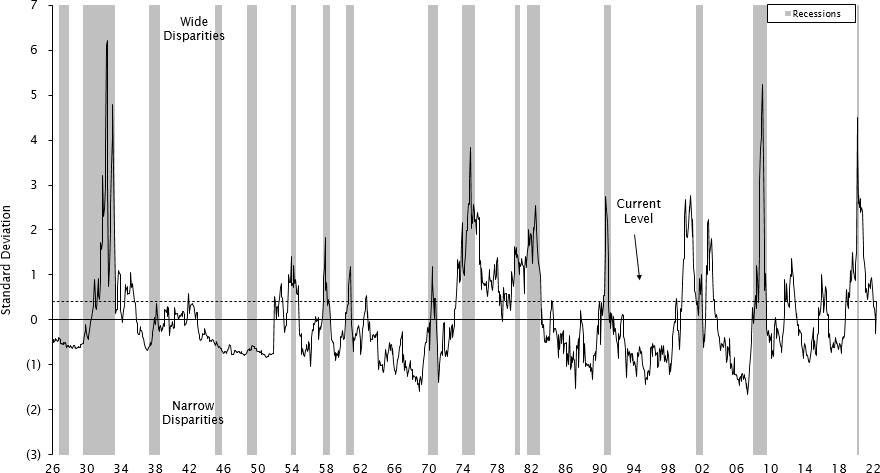
In equities, more traditional value stocks are no longer as inexpensive, unlike March 2020 when value spreads (the cheapest 20% of the market versus the market average) got to 2008 levels of cheapness. We have therefore spent more time considering (and adding to) faster growing, better quality businesses, many of which are both less expensive than the market today and where they have historically been valued, as supported in the following Exhibits E and F.
Exhibit E: Valuation Spreads – The Cheapest Quintile Compared to the Market Average (1926 – June 30, 2022) 13
Exhibit F: The Big Growers – Relative Price to Sales Ratio 14
We will remain flexible, and seek to take advantage of opportunities that present a margin of safety, whether they are perceived as “value” or “growth.” 15
Relatively speaking, international markets continue to trade at lower valuations than that of the US, as shown in Exhibit G below. That explains, in part, the Fund’s increase in international exposure from 20.3% to 37.5% of the Fund’s net equities over the last three and a half years. We continue to find attractive opportunities outside of the US.
Exhibit G: Twelve-Month Forward Price to Earnings Ratio Discount MSCI AC World Index ex-US vs S&P 500 Index 16
Closing
We are living through what is not our first volatile period. While we cannot tame volatility, we have learned to make friends with it. A decline in price can afford us the opportunity to buy as much as an increase can offer the chance to sell. We believe our hyper focus on price and business quality should allow us to successfully navigate this current turbulent moment in time.
Respectfully submitted,
FPA Crescent Portfolio Managers
Footnotes
| 1 Effective September 4, 2020, the current single class of shares of the Fund was renamed the Institutional Class shares. Unless otherwise noted, all data herein is representative of the Institutional Share Class. 2 Risk assets are any assets that are not risk free and generally refers to any financial security or instrument, such as equities, commodities, high-yield bonds, and other financial products that are likely to fluctuate in price. Risk exposure refers to the Fund’s exposure to risk assets as a percent of total assets. The Fund’s net risk exposure as of June 30, 2022 was 75.5%. 3 The current market cycle began October 10, 2007 and continued through June 30, 2022. The current market cycle is ongoing. Market cycles (peak to peak) are generally defined as a period that contains a decline of at least 20% from the previous market peak over at least a two-month period and a rebound to establish a new peak above the prior market peak. The current cycle is ongoing and thus presented through the most recent quarter-end. Once the cycle closes, the results presented may differ materially. 4 Comparison to the indices is for illustrative purposes only. The Fund does not include outperformance of any index or benchmark in its investment objectives. An investor cannot invest directly in an index. The long equity segment of the Fund is presented gross of investment management fees, transactions costs, and Fund operating expenses, which if included, would reduce the returns presented. Long equity holdings only includes equity securities excluding paired trades, short-sales, and preferred securities. The long equity performance information shown herein is for illustrative purposes only and may not reflect the impact of material economic or market factors. No representation is being made that any account, product, or strategy will or is likely to achieve profits, losses, or results similar to those shown. Long equity performance does not represent the return an investor in the Fund can or should expect to receive. Fund shareholders may only invest or redeem their shares at net asset value. 5 The current market decline for the MSCI ACWI index began January 5, 2022 and is ongoing. During the period Jan 5, 2022 through June 30, 2022, the S&P 500 and the MSCI ACWI NR USD declined 20.42% and 20.57%, respectively; while the Fund declined 13.03% during the same period. The two other periods with 20%+ market declines as measured by the MSCI ACWI were 4/29/2011 to 10/3/2011 and 2/19/2020 to 3/23/2020. During these periods the MSCI ACWI, S&P 500 and the Fund declined 22.63%, 18.64%, and 13.06%; 33.64%, 33.79% and 29.07%, respectively. The Global Financial Crisis was from 2007 to 2009. Even with this recent drawdown, equity markets are not technically in a bear market yet (defined by Vanguard as being down by at least 20% for more than two months), though many companies have suffered far deeper declines. 6 Prior Crescent Fund commentaries can be found at: FPA Crescent Fund Quarterly Commentary Archive 7 The current market decline for the MSCI ACWI index began January 5, 2022 and is ongoing. During the period Jan 5, 2022 through June 30, 2022, the S&P 500 and the MSCI ACWI NR USD declined 20.42% and 20.57%, respectively; while the Fund declined 13.03% during the same period. The two other periods with 20%+ market declines as measured by the MSCI ACWI were 4/29/2011 to 10/3/2011 and 2/19/2020 to 3/23/2020. During these periods the MSCI ACWI, S&P 500 and the Fund declined 22.63%, 18.64%, and 13.06%; 33.64%, 33.79% and 29.07%, respectively. The Global Financial Crisis was from 2007 to 2009. Even with this recent drawdown, equity markets are not technically in a bear market yet (defined by Vanguard as being down by at least 20% for more than two months), though many companies have suffered far deeper declines. Prior Crescent Fund commentaries can be found at: https://fpa.com/funds/fpa - crescent - fund - quarterly - commentary - archive 8 Source: Prosus announcement, June 27, 2022. Appreciation is in Euros, the local currency . https://www.prosus.com/news/the - group announces - the - beginning - of - an - open - ended - share - repurchase - programme - of - prosus - and - naspers - shares/ 9 The “Common Stock, Long” and the “Exposure, Net” categories include a 3.8% allocation to a SPAC basket consisting of 76 SPAC investments as of June 30, 2022. 10 Source: FPA, recent Company filings, Automotive News. As of June 30, 2022. 11 Source: FPA, Bloomberg. As of June 30, 2022. 12 Source: Federal Reserve Economic Data ( FRED ). As of June 30, 2022. 13 Source: Empirical Research Analysis, National Bureau of Economic Research. As of June 30, 2022. Cheapest quintile refers to the most undervalued 20% of stocks in an analysis of large-capitalization US stocks. Standard Deviation is a measure of dispersion of a data set from its mean. Prior to 1952, the spread is measured using the price-to-book data of the largest 1,500 stocks. Current Level refers to the valuation spread as of June 30, 2022 which is 0.4 standard deviations above the mean. 14 Source: Empirical Research Partners (“ERP”) Analysis, National Bureau of Economic Research, as of June 5, 2022. Equallyweighted data. ERP categorized a group of 75 US large-capitalization stocks that they have faster and stronger growth credentials than the rest of the US large-cap universe as ‘Big Growers’. The analysis covers the period January 1960 through June 5, 2022. 15 Margin of Safety - Buying with a “margin of safety” is when a security is purchased at a discount to the portfolio manager’s estimate of its intrinsic value. Buying a security with a margin of safety is designed to protect against permanent capital loss in the case of an unexpected event or analytical mistake. A purchase made with a margin of safety does not guarantee the security will not decline in price. 16 As of June 30, 2022. Source: Factset, MSCI, Standard & Poor's, J.P. Morgan Asset Management Guide to the Markets. Forward Price to Earnings is a version of the ratio of price-to-earnings (P/E) that uses forecasted earnings for the P/E calculation. |
Editor's Note: The summary bullets for this article were chosen by Seeking Alpha editors.
For further details see:
FPA Crescent Fund Second Quarter 2022 Commentary