SPY - FTCS: How This Capital Strength ETF's Fortunes Improved
2023-06-26 08:41:33 ET
Summary
- FTCS selects 50 large-cap stocks with high cash on hand, low debt loads, high returns on equity, and low realized volatility. Since 2006, it's delivered comparable returns to SPY.
- Quarterly reconstitutions drive 100%+ turnover rates, so FTCS can change on a whim. Today, FTCS offers an attractive growth and valuation combination that may interest short-term traders.
- FTCS is unique because it selects less-volatile, often smaller large-cap stocks, but still maintains high profitability. It also features strong earnings momentum, something its constituents didn't have last year.
- I've rated FTCS as a buy in the short term, but long-term investors probably don't need it, as its track record of providing downside protection in key market stress periods is mixed.
Investment Thesis
Today, I want to highlight the attractive fundamentals of the First Trust Capital Strength ETF ( FTCS ). With regular rebalancings, FTCS holds 50 large-cap stocks with high cash on hand, low debt loads, high returns on equity, and low realized volatility. Since my review last year, FTCS has tremendously improved its growth and valuation compared to the SPDR S&P 500 ETF ( SPY ). Although its track record borderlines on average and its 0.55% is an unavoidable drawback, FTCS is one of only a few high-quality, low-volatility ETFs. Therefore, at least for the time being, I rate FTCS as a buy, and I look forward to walking you through the fund's strategy, historical track record, and latest fundamentals in more detail below.
FTCS Overview
Strategy Discussion
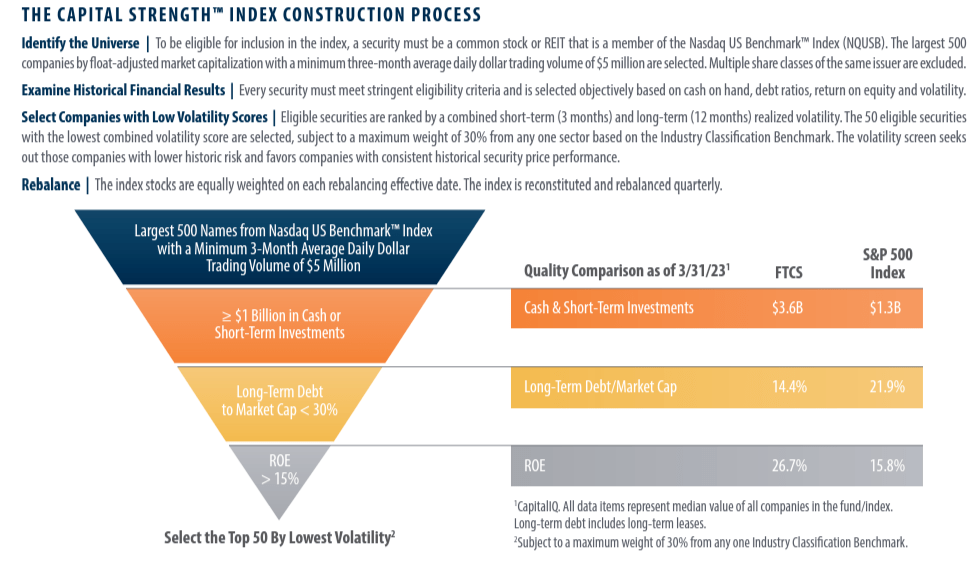
FTCS tracks the Capital Strength Index, providing equal weight exposure to 50 common stocks and REITs in the Nasdaq US Benchmark Index. The selection process is described in the graphic below.
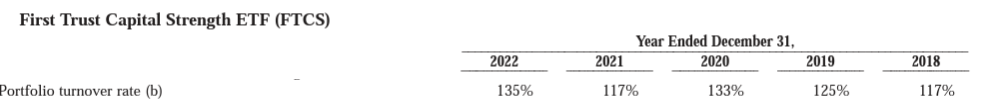
The starting universe is the largest 500 companies by float-adjusted market capitalization, which is more straightforward than the approach used to identify S&P 500 Index constituents. Still, it's a reasonable benchmark. All securities are screened for the cash, debt, and ROE requirements described above, and the top 50 are selected based on three- and twelve-month realized volatility. In addition, the Index caps sector weights at 30% based on the ICB Framework, and securities are equally weighted initially. Finally, the Index reconstitutes quarterly, driving the 100%+ turnover rates below.
First Trust's Investor Guide summarizes the fund as selecting high-quality companies with a history of low volatility. They're well-capitalized with solid market positions and strong balance sheets and, ideally, are resilient in market downturns. Furthermore, the Index's cash screen is meant to identify mature companies that dominate their industries. This screen is interesting. FTCS's current holdings have an average of $8.57 billion cash on hand, but I wouldn't classify them all as leaders in their respective markets. Instead, FTCS holds the entire industry in some cases, like with Soft Drinks & Non-Alcoholic Beverages. PepsiCo ( PEP ), Coca-Cola ( KO ), and Monster Beverage ( MNST ) are holdings, with Keurig Dr Pepper ( KDP ) being the only exclusion.
Still, I believe the volatility screen is an important differentiator. Most holdings have low betas, and the portfolios' weighted average five-year beta is just 0.81. Dedicated ETFs like Invesco S&P 500 Low Volatility ETF ( SPLV ) are even lower at 0.64, but SPLV accomplishes that by relying heavily on Utilities. FTCS is different, so let's look closer at its composition next.
Sector Exposures and Top Holdings
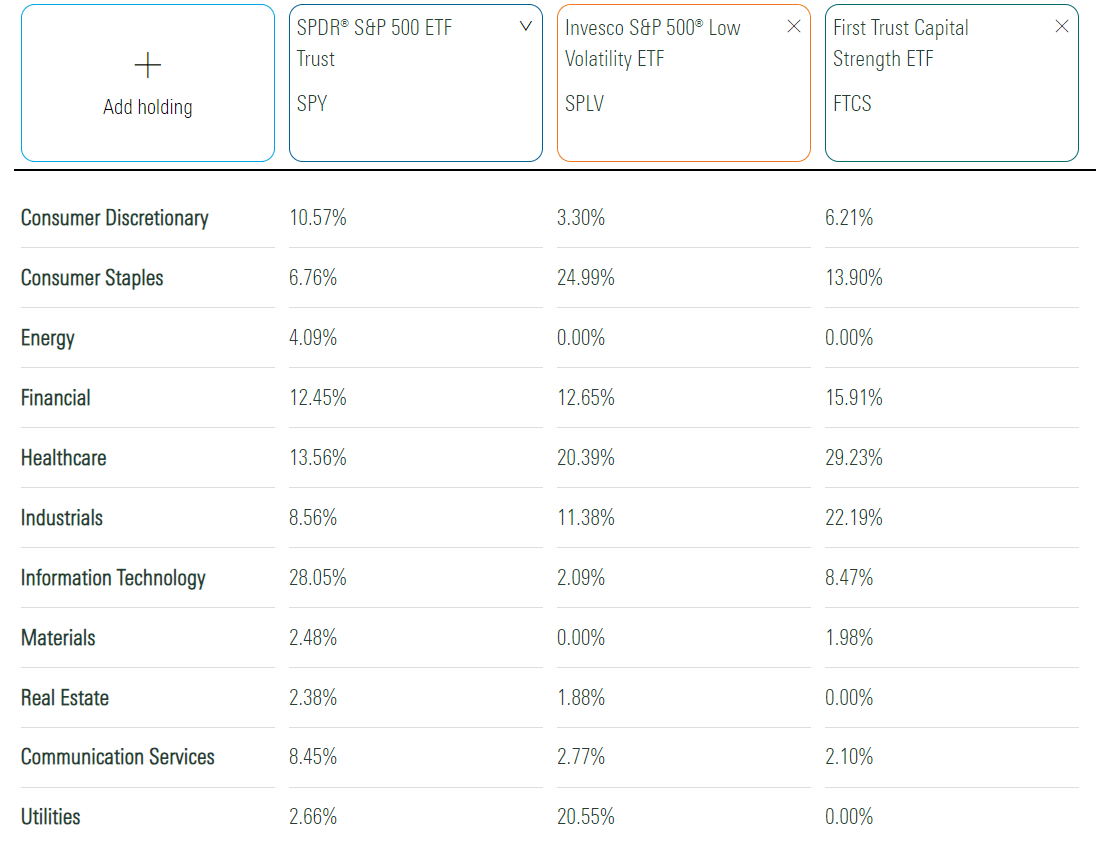
Sector exposures for FTCS and SPY are shown below. I also included SPLV to demonstrate its reliance on the Utilities sector.
FTCS complements SPY by increasing exposure to Consumer Staples, Health Care, and Industrials stocks. The offset is less Technology exposure, which may be prudent if this year's bull market halts. However, there's little difference elsewhere. FTCS has no Energy, Real Estate, and Utilities holdings and only marginal exposure to Materials and Communication Services.
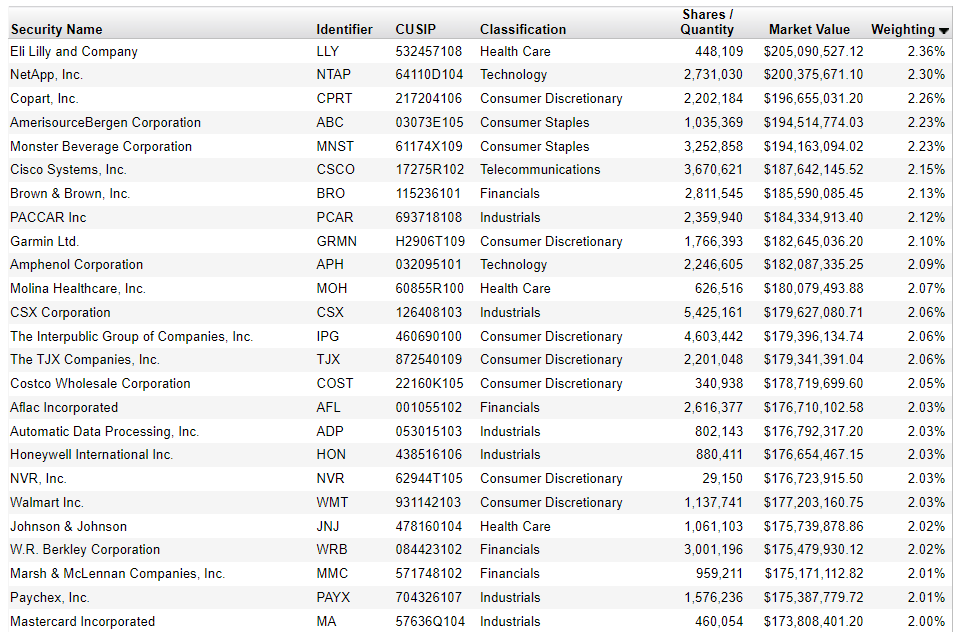
The top 25 holdings are listed below. Holdings are equally weighted at each rebalancing, so this list represents only the recent top performers. As shown, there's a nice mix of mega-cap stocks like Eli Lilly ( LLY ) and Cisco Systems ( CSCO ) and smaller stocks like NetApp ( NTAP ) and Brown & Brown ( BRO ).
Performance Analysis
Total Returns Since Inception
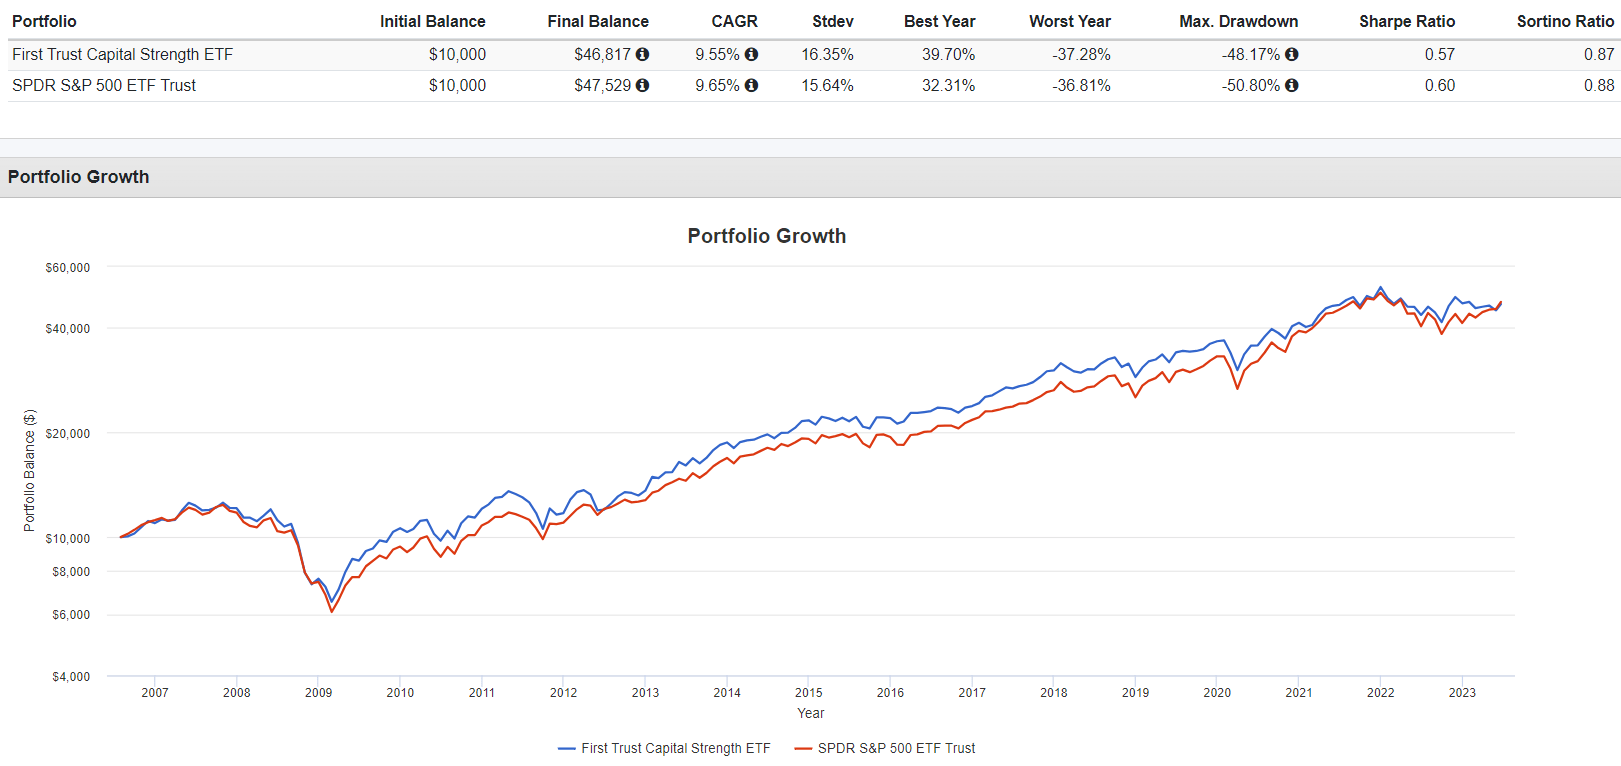
The following graph highlights FTCS's annualized risk and return metrics since its July 2006 inception date, assuming reinvested dividends. The results are strong, with FTCS delivering a 9.55% per year return compared to 9.65% for SPY. FTCS also has a much higher expense ratio (0.55% vs. 0.09%), so its Index performance is even better. That suggests the strategy has merit.
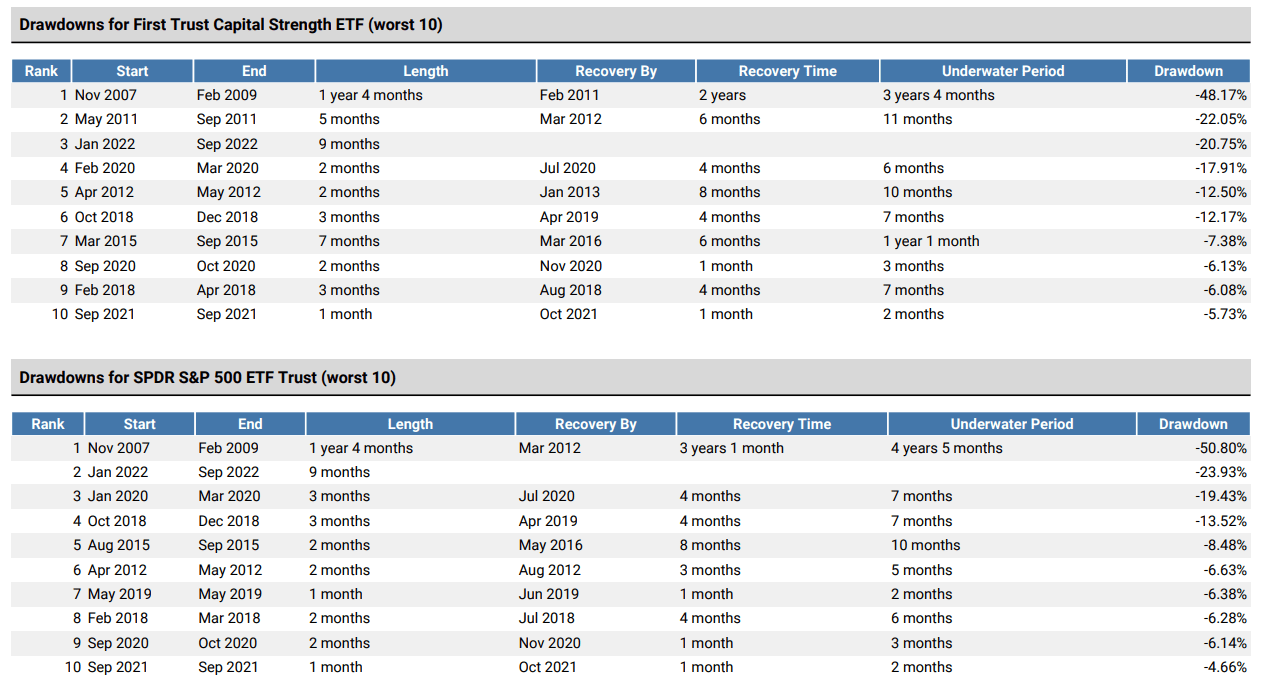
Still, FTCS was vulnerable during the market's worst ten drawdowns in the last 15 years. It beat SPY by just 2.63% from November 2007 to February 2009, 3.18% for the first three quarters in 2022, and declined by 22.05% between May 2011 and September 2011, lagging SPY by 5.82%. Therefore, its track record of providing downside protection is mixed.
Annual Returns vs. Large-Cap Peer Group
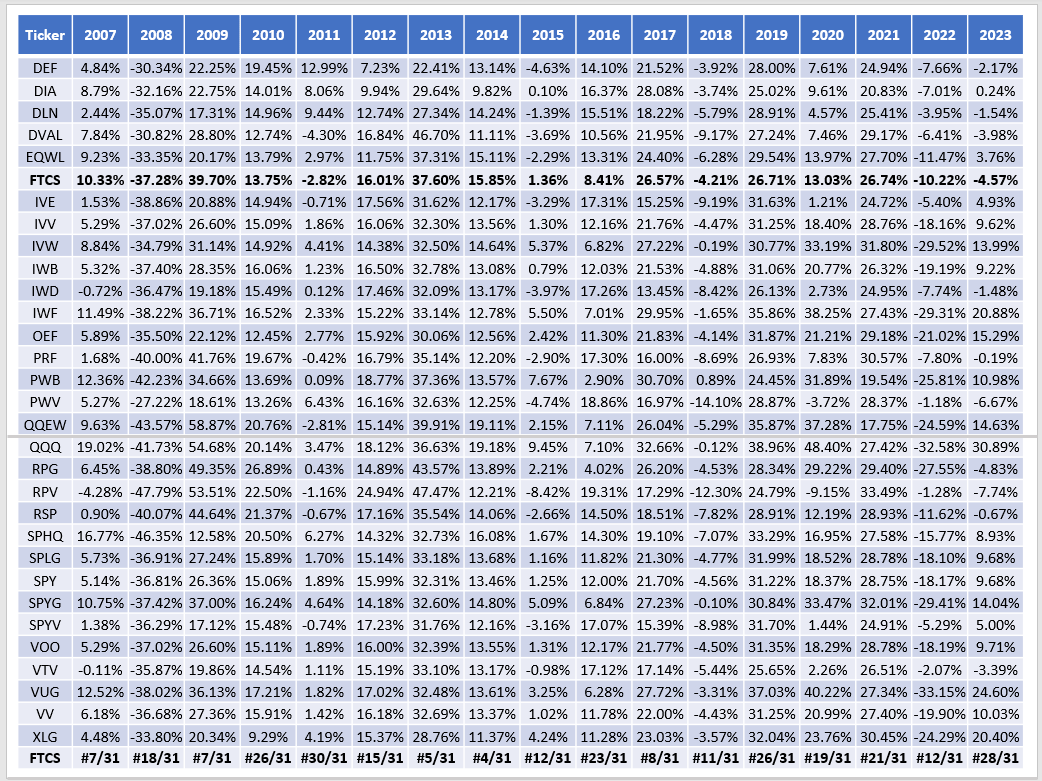
A different way to analyze performance is to look at an ETF's annual returns against peers. FTCS is well-established and is one of only 31 large-cap ETFs with full-year performance dating back to 2007. The sample below includes total yearly returns for seven large-cap value, 18 large-cap blend, and six large-cap growth ETFs, with FTCS's ranking in the bottom row.
The lower the ranking, the better. For example, FTCS was the fourth-best performer in 2014 but is just #28/31 YTD through May with a 4.57% decline. It's rare for FTCS to be average in any single year. However, its average ranking is #17/31, which is precisely how I would rate FTCS long-term.
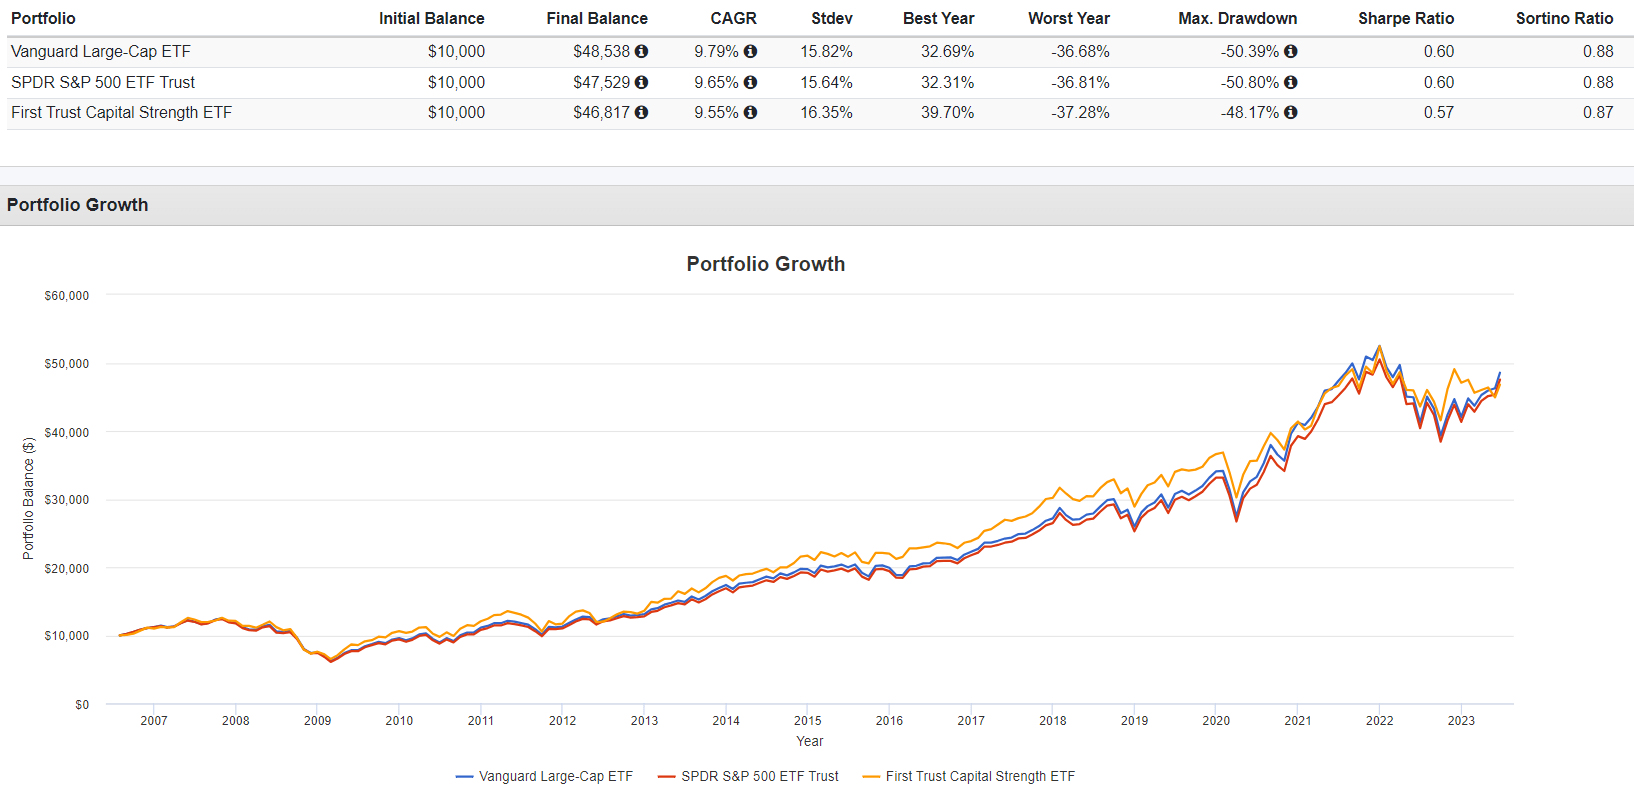
Not surprisingly, growth ETFs like the Invesco QQQ ETF ( QQQ ) did well, as did funds focusing on a narrow version of the S&P 500 like XLG and OEF. Also worth noting is the strong performance of the Vanguard Large Cap ETF ( VV ).
We only have a little data to go on among low-volatility ETFs since they only became popular after the Great Financial Crisis. However, here is how FTCS has stacked up since 2017 against 14 other large-cap ETFs with five-year betas below 0.85.
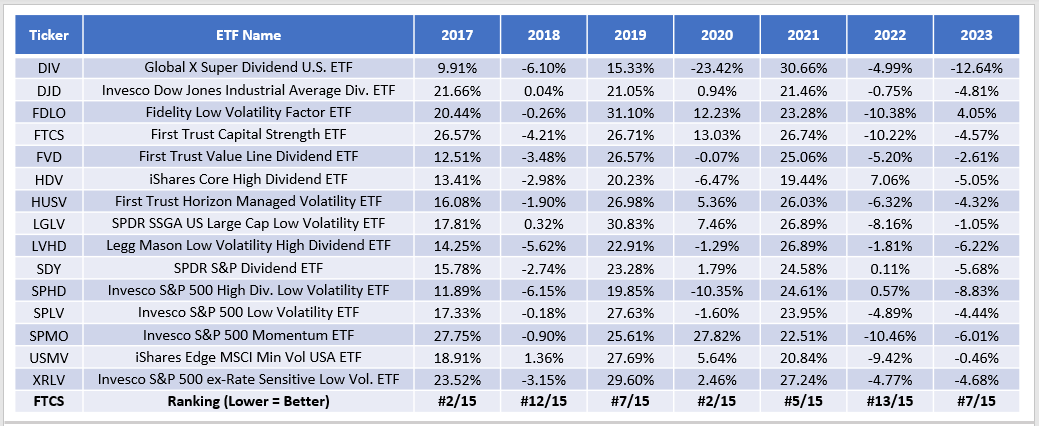
Except in 2018 and 2022, FTCS was an above-average performer and ranked #5/15 overall between 2017-2023. Unfortunately, those were the two years when the market declined. Coupled with the mixed drawdown results, I doubt FTCS can consistently provide enough downside protection.
FTCS Analysis
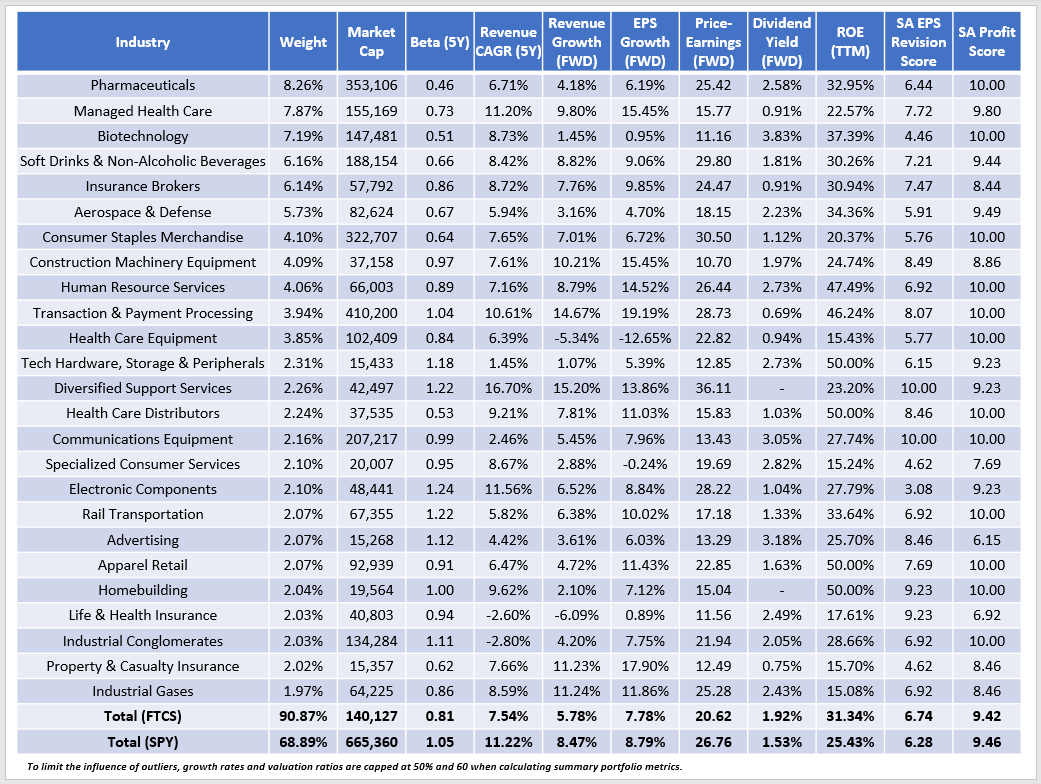
The following table highlights selected fundamental metrics for FTCS's top 25 industries. This view covers 91% of the portfolio and shows key differences with SPY on size, volatility, growth, and valuation.
FTCS has a $140 billion weighted average market capitalization compared to $665 for SPY. I mentioned its low 0.81 five-year beta earlier, but as discussed, this didn't translate into less volatility historically. However, it has a solid combination of growth and valuation. FTCS's constituents have a weighted average of 7.78% estimated growth rate, or 1.01% less than SPY, but trade 6.14 points cheaper on forward earnings (20.62x vs. 26.76x). This combination is decidedly different than when I initiated coverage on FTCS in October 2022. FTCS had a 5.80% earnings gap at the time and traded at only a 2.42-point discount on forward earnings. Based on its track record, there was no reason to be enthusiastic.
Still, another nice feature is FTCS's 6.74/10 EPS Revision Score, indicating positive Wall Street sentiment. In particular, Pharmaceuticals, Managed Health Care, and the Soft Drinks & Non-Alcoholic Beverage stocks mentioned earlier (PEP, KO, MNST) have solid earnings momentum. Here is how Seeking Alpha's Quant Grading System scores five stocks from those industries.
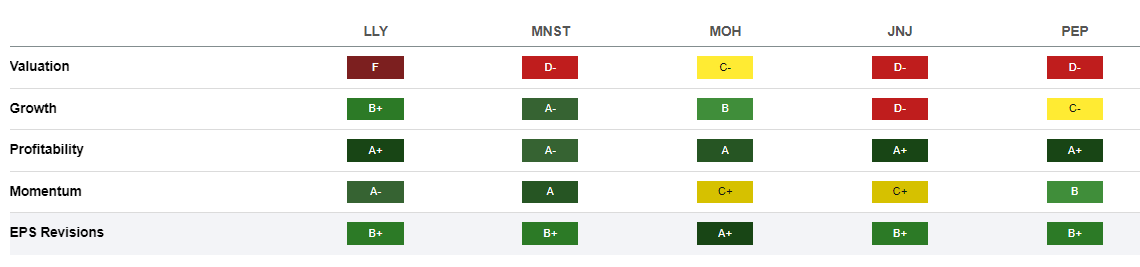
Finally, while I appreciate FTCS's focus on capital strength, it's not necessarily a higher-quality fund than SPY. FTCS and SPY have 9.42/10 and 9.46/10 Profitability Scores, so it's a reminder that there are many ways to measure profitability. Profitability screens are best used for small- and mid-cap stocks, as there's a good chance most S&P 500 companies are financially strong by default.
Investment Recommendation
It's rare for an ETF to target low-volatility stocks from a different size segment than the S&P 500 Index and still maintain high profitability. However, FTCS does just that and, as a result, could be a helpful complement to SPY. Based on its attractive combination of growth and valuation, I think there's the potential for a short-term opportunity with FTCS, so I am rating it as a "buy" for the time being. However, FTCS's long-term performance rankings are only average, and its downside protection track record is mixed, so I'm not confident in the strategy over the long term. Thank you for reading, and I look forward to answering any questions you have in the comments below.
For further details see:
FTCS: How This Capital Strength ETF's Fortunes Improved