NVDA - FTQI: A Change In 2022 Has Put It Closer To Competitors
2023-11-07 16:48:33 ET
Summary
- First Trust Nasdaq BuyWrite Income ETF is an actively managed fund that holds a portfolio of 157 stocks and writes call options on the Nasdaq 100 index.
- The FTQI ETF has a 12-month distribution yield of 11.96% and an expense ratio of 0.85%.
- Compared to its closest competitor, FTQI has lagged behind in performance but has shown improvement in the last 12 months due to a change in strategy.
- However, historical performance of all Buy-Write Nasdaq ETFs is underwhelming.
This article series aims at evaluating ETFs (exchange-traded funds) regarding the relative past performance of their strategies and metrics of their current portfolios. Reviews with updated data are posted when necessary.
FTQI strategy and portfolio
First Trust Nasdaq BuyWrite Income ETF ( FTQI ) is an actively managed fund launched on 1/6/2014. It currently holds a portfolio of 157 stocks and shorts 4 call options on the Nasdaq 100 index. It has a very attractive 12-month distribution yield of 11.96%, and an expense ratio of 0.85%. Distributions are paid monthly.
As described by First Trust ,
The Fund's investment objective is to provide current income. The Fund will pursue its investment objective by investing primarily in equity securities listed on U.S. exchanges and by utilizing an "option strategy" consisting of writing (selling) U.S. exchange-traded covered call options on the Nasdaq-100 Index .
FTQI invests at least 80% of its net assets in the components of the Nasdaq Composite Index. The call options generally have a notional value of 50% to 100% of the Fund’s assets. The collected option premiums are distributed to shareholders. In certain market conditions, the fund may sell a call and buy calls with a higher strike price in order to retain some upside performance. As of writing, options expire on 11/17/2023 and 12/15/2023 with strike prices between NQ 14,750 and 15,250.
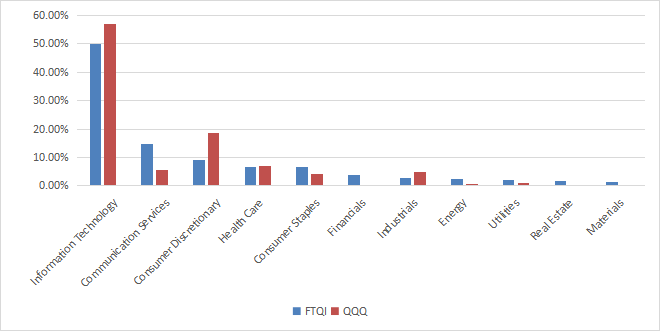
FTQI invests almost exclusively in U.S.-based companies (about 97% of asset value). Compared to the Nasdaq 100-Index (NDX, QQQ ), the fund slightly underweights information technology, which remains the heaviest sector (50% of asset value). Communication comes in second position with 14.9%, almost tripling its weight in QQQ. Consumer discretionary weighs 9% of assets, only half its share in QQQ. Other sectors are below 7% individually and 28% in aggregate, but no sector is ignored.
Sector breakdown (Chart: author; data: First Trust, Invesco)
FTQI is a bit cheaper than QQQ regarding aggregate valuation ratios, as reported in the next table. Growth metrics are mixed: QQQ is superior in earnings growth, whereas FTQI looks better in sales and cash flow growth. Nonetheless, the difference in fundamental metrics between the two funds is not large enough to make an investing thesis about it.
| FTQI |
| QQQ |
| Price/earnings TTM |
| 26.5 |
| 27.45 |
| Price/book |
| 5.8 |
| 6.14 |
| Price/sales |
| 3.18 |
| 4.06 |
| Price/cash flow |
| 16.82 |
| 18.25 |
| Earnings growth % |
| 18.11% |
| 21.06% |
| Sales growth % |
| 17.83% |
| 13.20% |
| Cash flow growth % |
| 6.56% |
| 5.47% |
Data: Fidelity.
The top 10 companies, listed below with fundamental metrics, represent 48.1% of asset value. For convenience, I have grouped the two stock series of Alphabet in the same line. The top two holdings, Apple and Microsoft, weigh 21.5% together. Risks related to other individual companies are moderate, with exposures below 5% of assets.
| Ticker |
| Name |
| Weight |
| EPS growth %TTM |
| P/E TTM |
| P/E fwd |
| Yield% |
| Apple Inc. |
| 11.07% |
| 0.45 |
| 29.24 |
| 27.41 |
| 0.54 |
| Microsoft Corp. |
| 10.45% |
| 11.28 |
| 34.53 |
| 31.71 |
| 0.84 |
| Amazon.com, Inc. |
| 4.48% |
| 75.88 |
| 72.96 |
| 52.92 |
| 0 |
| NVIDIA Corp. |
| 4.26% |
| 35.76 |
| 110.52 |
| 42.63 |
| 0.04 |
| Meta Platforms, Inc. |
| 4.02% |
| 7.92 |
| 27.88 |
| 22.09 |
| 0 |
| Alphabet Inc. |
| 3.94% |
| 3.56 |
| 24.97 |
| 22.71 |
| 0 |
| Broadcom Inc. |
| 3.05% |
| 41.21 |
| 27.18 |
| 20.92 |
| 2.09 |
| Tesla, Inc. |
| 2.54% |
| -4.04 |
| 70.61 |
| 70.47 |
| 0 |
| Costco Wholesale Corp. |
| 2.16% |
| 7.74 |
| 40.25 |
| 36.57 |
| 0.72 |
| Adobe Inc. |
| 2.13% |
| 9.52 |
| 50.88 |
| 35.51 |
| 0 |
FTQI vs competitors
The next table compares characteristics of FTQI and four other ETFs seeking income through option strategies in the Nasdaq universe:
- Global X Nasdaq 100 Covered Call ETF ( QYLD )
- Global X Nasdaq 100 Covered Call & Growth ETF ( QYLG )
- JPMorgan Nasdaq Equity Premium Income ETF ( JEPQ )
- Nasdaq 100 Risk Managed Income ETF ( QRMI ).
They all pay monthly distributions.
| FTQI |
| QYLD |
| QYLG |
| JEPQ |
| QRMI |
| Inception |
| 1/6/2014 |
| 12/11/2013 |
| 9/18/2020 |
| 5/3/2022 |
| 8/25/2021 |
| Expense Ratio |
| 0.85% |
| 0.60% |
| 0.60% |
| 0.35% |
| 0.60% |
| AUM |
| $107.10M |
| $7.69B |
| $107.65M |
| $6.53B |
| $11.85M |
| Avg Daily Volume |
| $1.29M |
| $79.96M |
| $905.35K |
| $102.18M |
| $91.83K |
| Turnover |
| 107.00% |
| 18.12% |
| 18.12% |
| 162.00% |
| 27.40% |
| Yield ((TTM)) |
| 11.77% |
| 12.03% |
| 5.65% |
| 11.12% |
| 12.78% |
FTQI is the second oldest after QYLD and has the highest fee. It is far behind QYLD and JEPQ in assets under management and liquidity. Turnover is high, although lower than for JEPQ, and the trailing 12-month yield is similar to competitors, except QYLG, lagging in this matter.
Regarding the 12-month total return, FTQI is in the middle of the pack, as plotted on the next chart. JEPQ is the best performer with almost +31%, yet behind the plain vanilla Nasdaq 100 ETF QQQ (+38.9%).
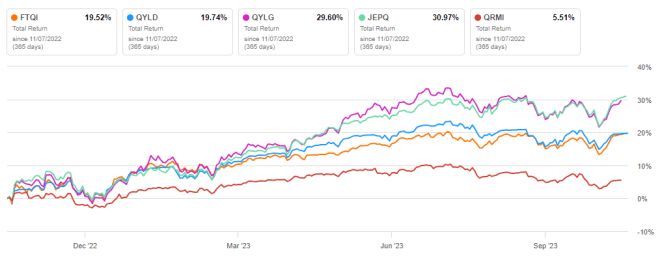
Since inception, FTQI can only be compared with QYLD. The latter is leading by 40 percentage points in total return at +89.3%. QQQ is out of the chart: +367.7% in the same time interval.
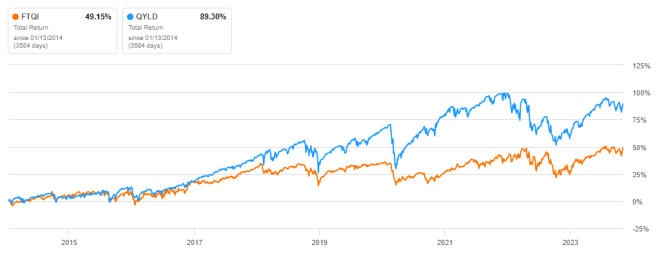
The chart below plots share price returns, excluding distributions. It shows FTQI has been better at preserving capital. QYLD has suffered significant decay in value, offsetting it by a higher yield. In the same time, the cumulative inflation has been about 30%, based on CPI. Anyway, it represents a large loss in inflation-adjusted value for both funds.
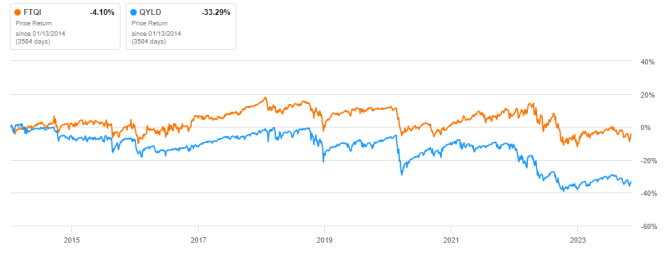
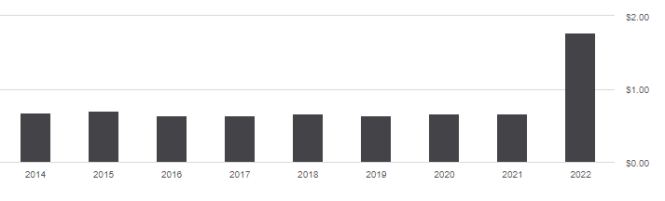
Collected option premiums may vary depending on market conditions. It seems the management tries to keep distributions as constant as possible: the annual sum has been quite stable between $0.63 and $0.70 per share between 2015 and 2021. Then, it jumped to $1.78 in 2022. Based on historical data, last year looks like an outlier.
Distributions of QYLD have been much more steady:
QYLD distribution history (Seeking Alpha)
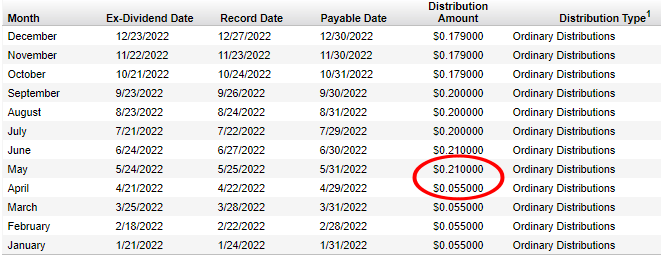
The current high yield of FTQI is inconsistent with its history. I wrote in a previous review that its was not sustainable, but I changed my mind and I will explain why. Actively managed funds have a lot of flexibility in their strategies, so it is extremely likely that FTQI has adopted a strategy closer to QYLD. Looking at distribution history, the change happened on May 2022, when the monthly distribution per share jumped from $0.055 to $0.21.
Up to now, the average monthly distribution for 2023 is about $0.19, so it seems the high yield will be sustained. Therefore, historical performance of FTQI is probably irrelevant to its current strategy. This is a common issue with actively managed funds: they are flexible, though not as transparent as index-based ETFs. I think future performance may go closer to its competitors, in particular QYLD: they are on par in 12-month total return. We can expect a sustained high yield and hopefully a higher total return, but also a steeper decay in price.
Takeaway
First Trust Nasdaq BuyWrite Income ETF holds 157 stocks of the Nasdaq Composite, and sells short-term call options on the Nasdaq 100 index to generate income. It has lagged some competitors on various time frames. It did better in the last 12 months, likely due to a change in the strategy. Historical data are probably irrelevant to assess the current strategy, which resulted in a large increase in yield, and may incur a steeper price decay. If the current strategy goes on, I think FTRI will be close to QYLD in future performance. However, actively managed funds are very flexible, and the strategy may change again.
As QYLD features a slightly lower fee, a higher liquidity and a longer high-yield track record, I don’t see any reason to prefer FTRI. Anyway, keep in mind that all buy-write Nasdaq ETFs examined in this article hava lagged the Nasdaq 100 index by a wide margin.
For further details see:
FTQI: A Change In 2022 Has Put It Closer To Competitors