XOM - FXN: An Energy ETF Poised To Outperform Just Not Yet
2023-06-03 05:12:41 ET
Summary
- The First Trust Energy AlphaDEX Fund ETF is a unique energy ETF that uses quant-based strategies to choose stocks that are expected to outperform the sector, with a focus on mid-cap, upstream energy companies.
- FXN's performance has been closely aligned with its peers, suggesting its quant-based strategy produces average returns, but it can outperform during large oil upswings.
- I rate FXN a hold due to the pending recession likely causing oil prices to fall, but it may be a good buy after the economy goes into recession and oil prices are low.
First Trust Energy AlphaDEX Fund ETF ( FXN ) is a very unique energy ETF. With AUM of about $535M, this ETF tracks the StrataQuant Energy Index. FXN doesn't try to represent the energy sector but uses quant-based strategies to choose stocks that are (according to the strategy) supposed to outperform the sector. Because of its unusual way of choosing stocks, FXN has only a 47% overlap with popular energy index ETFs like VDE and XLE .
FXN and VDE overlap (etfrc.com)
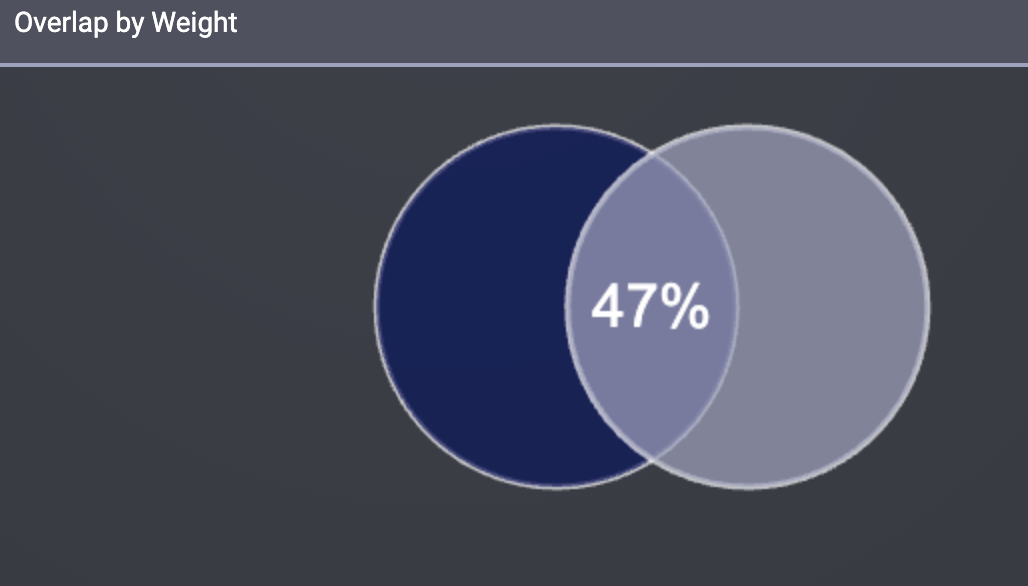
FXN holds mostly mid-cap, upstream energy companies. Compared to midstream and downstream energy companies, upstream companies are the most correlated with oil prices compared to, and therefore usually the most volatile. This means that during times of expensive oil, FXN tends to outperform, and during times of cheap oil, it underperforms. Because of how volatile and uncertain the price of oil has been, I rate FXN ETF a Hold.
Holding Analysis
The index FXN follows, StrataQuant Energy Index, has a complicated process for choosing its holdings . First, the index starts with every stock in the Russell 1000. Next, the stocks are ranked "on growth factors including three, six and 12-month price appreciation, sales to price and one-year sales growth, and, separately, on value factors including book value to price, cash flow to price and return on assets." Stocks in the energy sector are separated and then ranked using the strategy. After this ranking, the greater of the top 75% of the remaining universe or 40 stocks are added to the index. I found it very surprising that if there are not 40 eligible energy stocks, the index will include all eligible stocks, regardless of the sector, until reaching 40 stocks. Finally, the selected stocks are divided into quintiles based on their rankings. The stocks within each quintile are equally weighted, with the top-ranked quintiles receiving a higher weight within the index. FXN uses a full replication technique, so it holds the same exact stocks as the index.
The selection process leads to FXN holding a large number of mid-cap, upstream energy companies. FXN's top 10 holdings take up 40% of the AUM at the time of rebalancing (not all holdings are currently 4% because they increase and decrease as their stock price gains or loses value).
FXN's top 10 holdings (ETF.com)
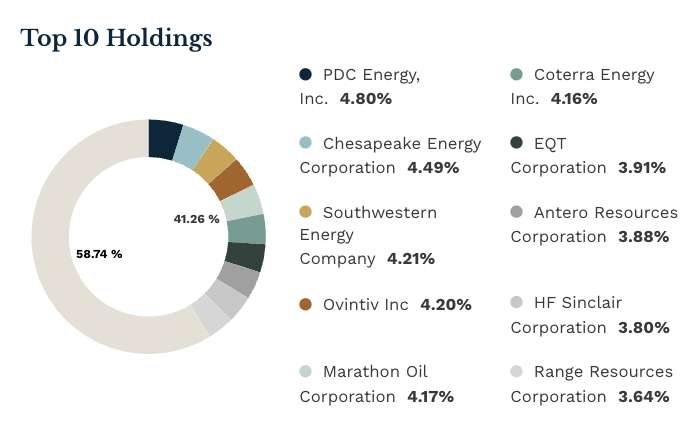
In my opinion, this approach to structuring the index makes this ETF very diversified for an energy ETF. Most energy indexes' top two holdings, CVX and XOM , take up about 40%, whereas with FXN it takes 10 stocks to reach that.
Performance
I normally don't include much commentary on past performance, but because FXN has such a complicated way of choosing its stocks, it's interesting to see how the performance compares to other more popular energy ETFs.
The chart above compares FXN to XLE, the energy sector benchmark, and IEO , another mainly upstream ETF. As you can see, FXN's strategy hasn't produced stellar results. It has performed closely with its peers, suggesting that the quant-based strategy isn't anything special and produces average returns. With that being said, there are still some instances where this ETF can outperform.
Volatility
It's no surprise that FXN, like almost every energy ETF, is highly correlated to oil. And because this ETF holds mostly upstream energy companies, the most oil-price-influenced stream of energy companies, it's even more correlated to oil than other energy ETFs. I can't remember a time when oil wasn't going through a "volatile period." But because FXN holds mid-cap companies, it's even more volatile than the energy index ETF that holds large-cap companies. This can give FXN a potential advantage relative to other energy ETFs. Because of this higher volatility, during large oil upswings, FXN will likely outperform an energy index.
When FXN Wins
FXN's strategy wins when there are large upswings in oil. I think the past 5 years illustrate this perfectly. Every time FXN outperformed VDE based on a 6-month total return, it was when oil had an upswing. In mid-2019, the first instance of outperformance in the 5-year period, crude oil went from around $64 to $75 a barrel; in mid-2020, oil went from around negative $37 to positive $38, a huge upswing, leading to huge outperformance of over 40%; in late 2021, oil went from around $60 to $75; and finally, in late 2022, oil went from around $90 to $120.
There was only one time this pattern didn't hold, which was at the beginning of 2022, when oil went from $75 to $120 because of the Russia-Ukraine conflict. However, there is an explanation for this. This conflict caused oil to go up in price, but also caused many upstream oil companies to have to leave Russia . The upstream companies having to leave Russia added to the oil supply shrinking, which contributed to the rise in oil prices. Although high oil prices help upstream companies, they were also losing business, causing this conflict to ultimately hurt them. If you exclude this instance because it can be attributed to a black swan event, FXN followed the pattern 4 out of 4 times.
Future Outlook
FXN is great for an oil bull, as it will outperform a typical energy index if oil goes up substantially. However, I'm not at all bullish on oil right now. I think the longer we aren't in a recession, the worse the recession will be. The Feds are trying to slow the economy and it hasn't happened yet. The May job reports showed that payrolls grew much more than expected and inflation, although going down, is still sticky . This will likely lead to the Fed raising rates even higher and likely pushing us into a worse recession . A recession will reduce consumption, causing a drop in demand for oil, and therefore lower oil prices.
Conclusion
FXN is a very unique ETF that offers exposure to the mid-cap, upstream energy industry. Because it holds mid-cap companies, it is more volatile than energy indexes, and because it holds upstream companies, it is more correlated to oil than a typical energy index. This leads to outperformance during oil upswings and underperformance during oil downswings. Because of the pending recession likely causing oil to fall, I rate FXN a Hold, but after the economy does go into recession and oil is cheap, it may be a good time to buy to profit off the recovery.
For further details see:
FXN: An Energy ETF Poised To Outperform, Just Not Yet