CA - Galiano Gold: Weak Production Expected In 2023
2023-04-06 08:28:49 ET
Summary
- Gold revenue was $296.5 million from 167,849 gold ounces sold at an average realized price of $1,767/oz in 2022.
- Gold production was 34,090 ounces during the 4Q22, and annual gold production of 170,342 ounces, achieving the upper end of the revised guidance of 160K to 170K ounces.
- I recommend buying GAU between $0.59 and $0.554 with possible lower support at $0.505.
Introduction
Galiano Gold ( GAU ) operates and manages the Asanko gold mine or AGM, located in Ghana, West Africa, jointly owned with Gold Fields ( GFI ). Also, Galiano Gold owns the Asumura project indicated below (see map below).
Note: Galiano is the joint venture operator and receives an annual service fee from the JV.
Gold Fields Limited owns a 45% equity interest in the AGM JV, with the Government of Ghana owning a 10% free?carried interest.
On March 28, 2023, Galiano Gold reported its 4Q22 and Full-year 2022 results.
Note: I have followed GAU quarterly since 2021. This new article is a quarterly update of my article published on November 29, 2022.
GAU Asset Map (GAU Presentation)
Note: AGM is used for Asanko Gold Mine.
1 - 4Q22 and Full-year 2022 Results Snapshot
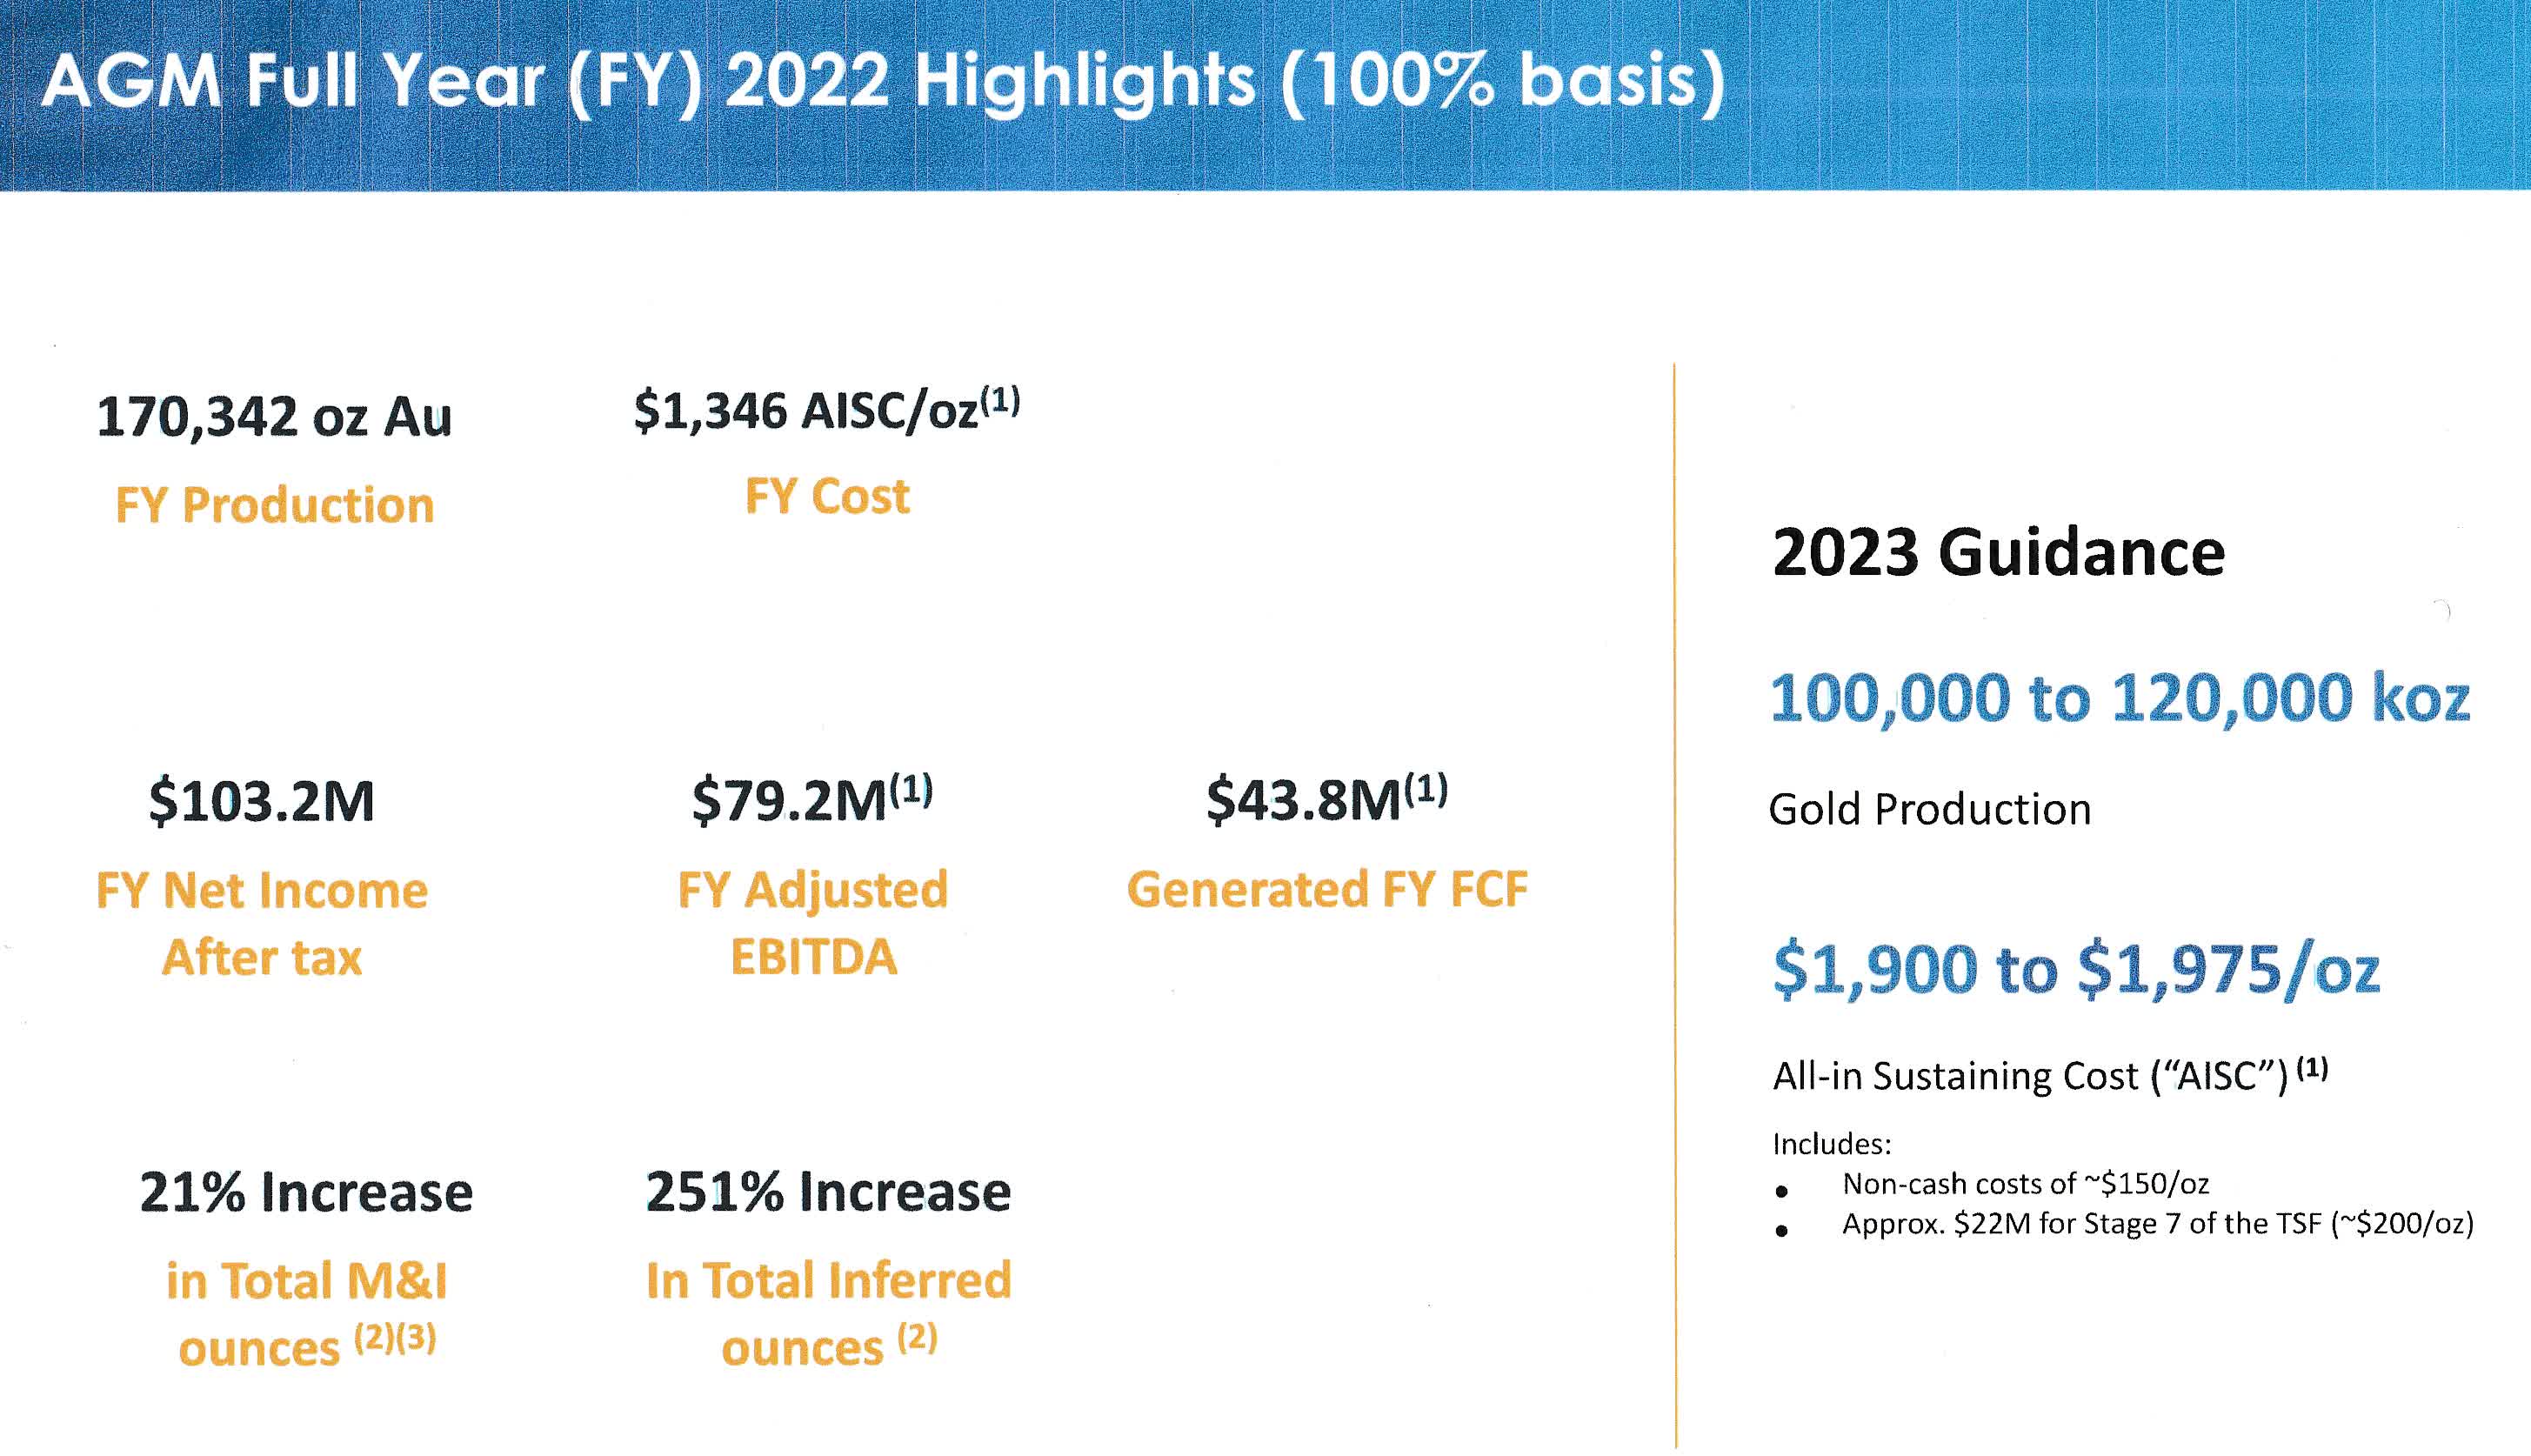
Gold production was 34,090 ounces during the 4Q22, and annual gold production of 170,342 ounces, achieving the upper end of the revised guidance of 160K to 170K ounces. During the year ended December 31, 2022, the AGM sold 167,849 ounces of gold.
Gold revenue was $296.5 million from 167,849 gold ounces sold at an average realized price of $1,767/oz in 2022 (AISC was $1,346 per ounce sold in 2022).
Net income after tax of $103.2 million during the year, which included an impairment reversal on mineral properties of $63.2 million and Adjusted EBITDA of $79.2 million (EBITDA $40.98 million).
2023 Guidance for gold is between 100K and 120K Au ounces at AISC between $1,900/oz and $1,975/oz. AISC will be elevated in 2023 primarily due to waste stripping necessary to restart mining at Abore, which will benefit future years' production and higher expenditures on the TSF.
GAU Highlights (100% basis) (GAU Presentation)
Galiano Gold reported that gold production at the Asanko gold mine in Ghana ("AGM") was 34,090 ounces during 4Q22, down 19.5% from 50,218 ounces produced in 4Q21.
The company reported a net income of $28.50 million during the quarter.
2 - Stock Performance
Galiano Gold has significantly outperformed the VanEck Gold Miners ETF ( GDX ) and is now up 18% on a one-year basis.
3 - Investment Thesis
My investment thesis for GAU has not changed much. I do not believe GAU is a stock for long-term investment purposes, but it is an excellent tool for short-term trading using the LIFO strategy.
The main issue is that the stock is based on one single JV in West Africa, considered high-risk from a long-term investor's perspective. Any problem related to Asanko Gold Mine will materially affect GAU, which has no backup, and the West African location is another uncertainty compared to North America.
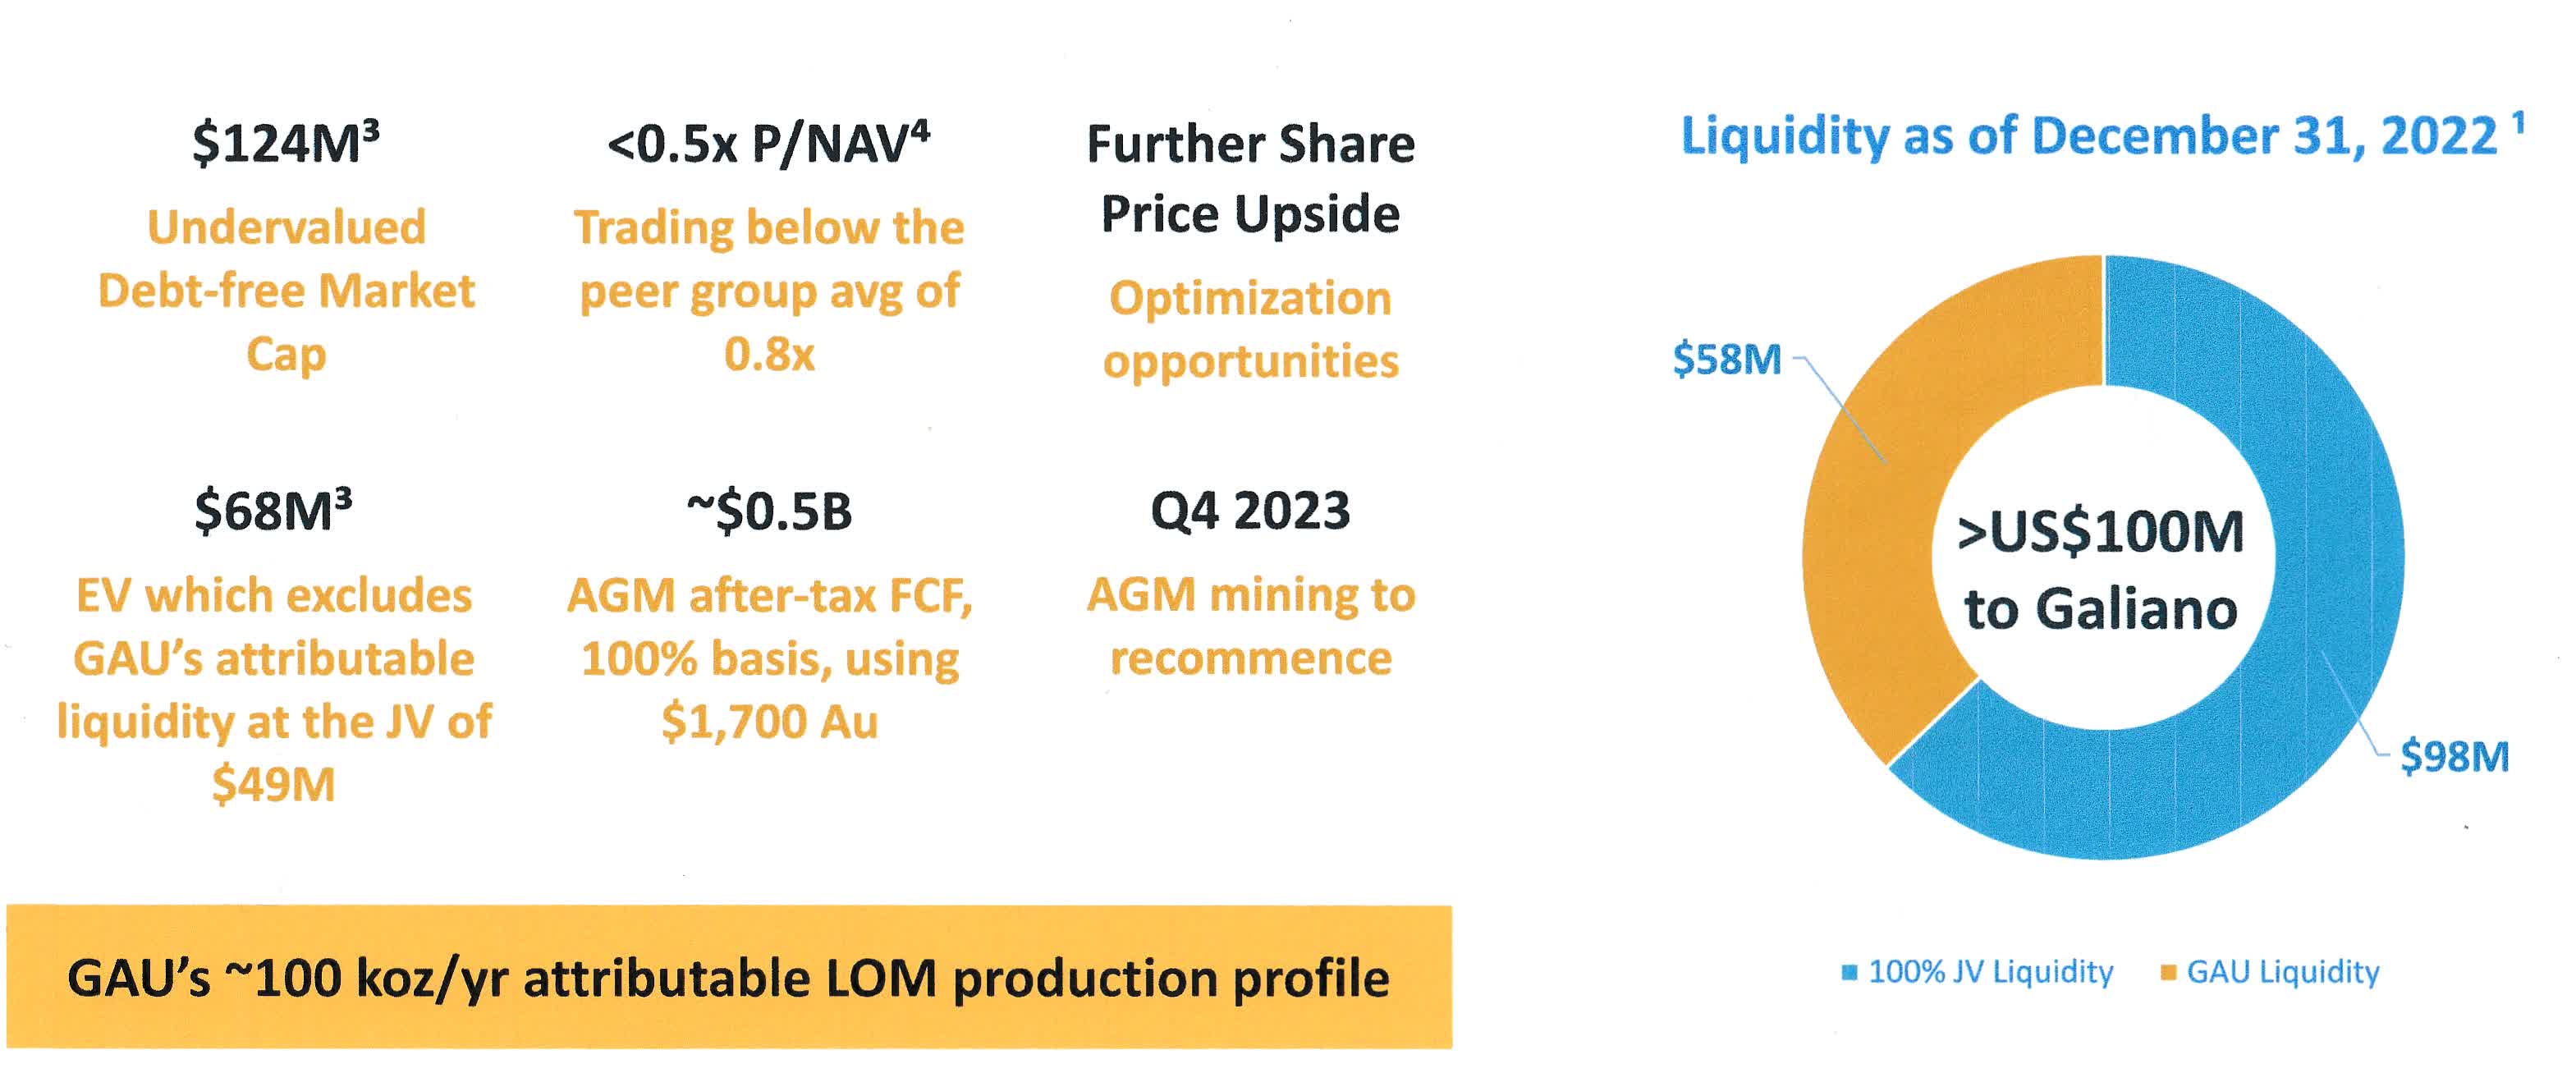
On the positive side, the company presents a solid balance sheet and excellent growth potential, significantly reducing the chances of short-term collapse. Galiano has over $100 million in liquidity (100% JV).
GAU Liquidity (GAU Presentation)
In the press release, GAU indicated exploration success.
Completed extensive infill drilling at Esaase, Miradani North, Abore, Midras and Nkran, the results of which were incorporated into the Independent FS, which saw a 21% increase in total Measured and Indicated ounces (after depletion) and a 251% increase in total Inferred ounces compared to the previous estimates dated February 28, 2022.
Also, insiders, notably the independent chairman Paul Wright, buy GAU regularly, another sign of confidence.
Finally, Gold Fields could acquire Galiano Gold's 45% stake in the JV after ending its takeover deal with Yamana Gold (YRI:CA) on November 8, 2022.
Thus, I recommend trading LIFO for about 60% of your overall position but keeping a small long-term position for a potential future acquisition offer in an all-share deal in 2023-2024.
Galiano Gold - 4Q22 Balance Sheet History. The Raw Numbers
Note: The Joint Venture is split 50/50 for the 90% economic interest, with Ghana Government holding 10%. Therefore, Galiano Gold owns 45% of the Joint Venture.
| Galiano Gold |
| 4Q21 |
| 1Q22 |
| 2Q22 |
| 3Q22 |
| 4Q22 |
| Total Revenues $ million (100% basis) |
| 91.08 |
| 75.53 |
| 84.89 |
| 76.91 |
| 57.81 |
| Quarterly Earnings in $ million |
| -91.03 |
| -1.54 |
| 12.57 |
| 1.28 |
| 28.50 |
| EBITDA $ million |
| -91.01 |
| -1.49 |
| 12.61 |
| 1.32 |
| 28.54 |
| EPS (diluted) $ per share |
| -0.41 |
| -0.01 |
| 0.06 |
| 0.01 |
| 0.13 |
| Operating Cash Flow $ million |
| -2.29 |
| -3.17 |
| 2.57 |
| 1.54 |
| 0.84 |
| CapEx in $ million |
| 0.03 |
| 0.00 |
| 0.00 |
| 0.00 |
| 0.00 |
| Free Cash Flow in $ million |
| -2.30 |
| -3.17 |
| 2.57 |
| 1.54 |
| 0.84 |
| Total cash in $ million (100% basis) |
| 53.52 |
| 50.38 |
| 53.01 |
| 54.72 |
| 56.11 |
| Total LT Debt (incl. current) in $ million |
| 0.00 |
| 0.00 |
| 0.00 |
| 0.00 |
| 0.00 |
| Shares Outstanding (diluted) in millions |
| 224.95 |
| 224.94 |
| 224.94 |
| 224.94 |
| 224.96 |
Source: Company M&A. Fun Trading files.
Analysis: Revenues, Free Cash Flow, Debt, And Gold Production
1 - Quarterly revenues were $57.88 million in 4Q22 (100% basis)
GAU Quarterly balance sheet history (Fun Trading) Galiano Gold announced that 4Q22 gold revenue was $57.81 million (on a 100% basis) based on 34,090 Au ounces sold at an average gold realized price of $1,686 per ounce. Net income in 4Q22 was $28.50 million, or $0.13 per diluted share. The adjusted net loss was $6.010 million or $0.03 per share in 4Q22. In 2022, the net income after tax was $40.8 million or $0.18 per share, which included the Company’s share of the JV’s net earnings for the year.
2 - Free Cash Flow was $0.84 million In 4Q22
Free cash flow is cash flow from operations minus CapEx. Trailing 12-month ttm free cash flow was $1.78 million, with a gain of $0.84 million in 4Q22.
Note: The company indicated an FCF of $5.528 million for 4Q22 for the JV.
3 - No Debt in 4Q22 and Total Cash of $56.11 Million
GAU Quarterly total cash history (Fun Trading) The chart above shows that the cash position has increased by 4.8% YoY. Galiano had $56.11 million in cash and no debt as of December 31, 2022.
4 - Quarterly Gold Production Analysis
Galiano Gold reported that gold production at the Asanko gold mine in Ghana was 34,090 ounces during 4Q22 and sold 34,202 ounces. The production in 4Q22 was weak.
On March 28, 2023, the Company posted an updated NI 43?101 Technical Report for the Asanko Gold Mine, which included the reinstatement of Mineral Reserves. It presented an improved long?term outlook for the mine.
The processing plant achieved a milling throughput of 1.518 Mt of ore at a grade of 0.8g/t and metallurgical recovery averaging 80%. All those numbers are weak due to lower than prior years due primarily to processing lower grade stockpiles.
GAU Quarterly Gold production history (Fun Trading) GAU Quarterly gold price and AISC history (Fun Trading)
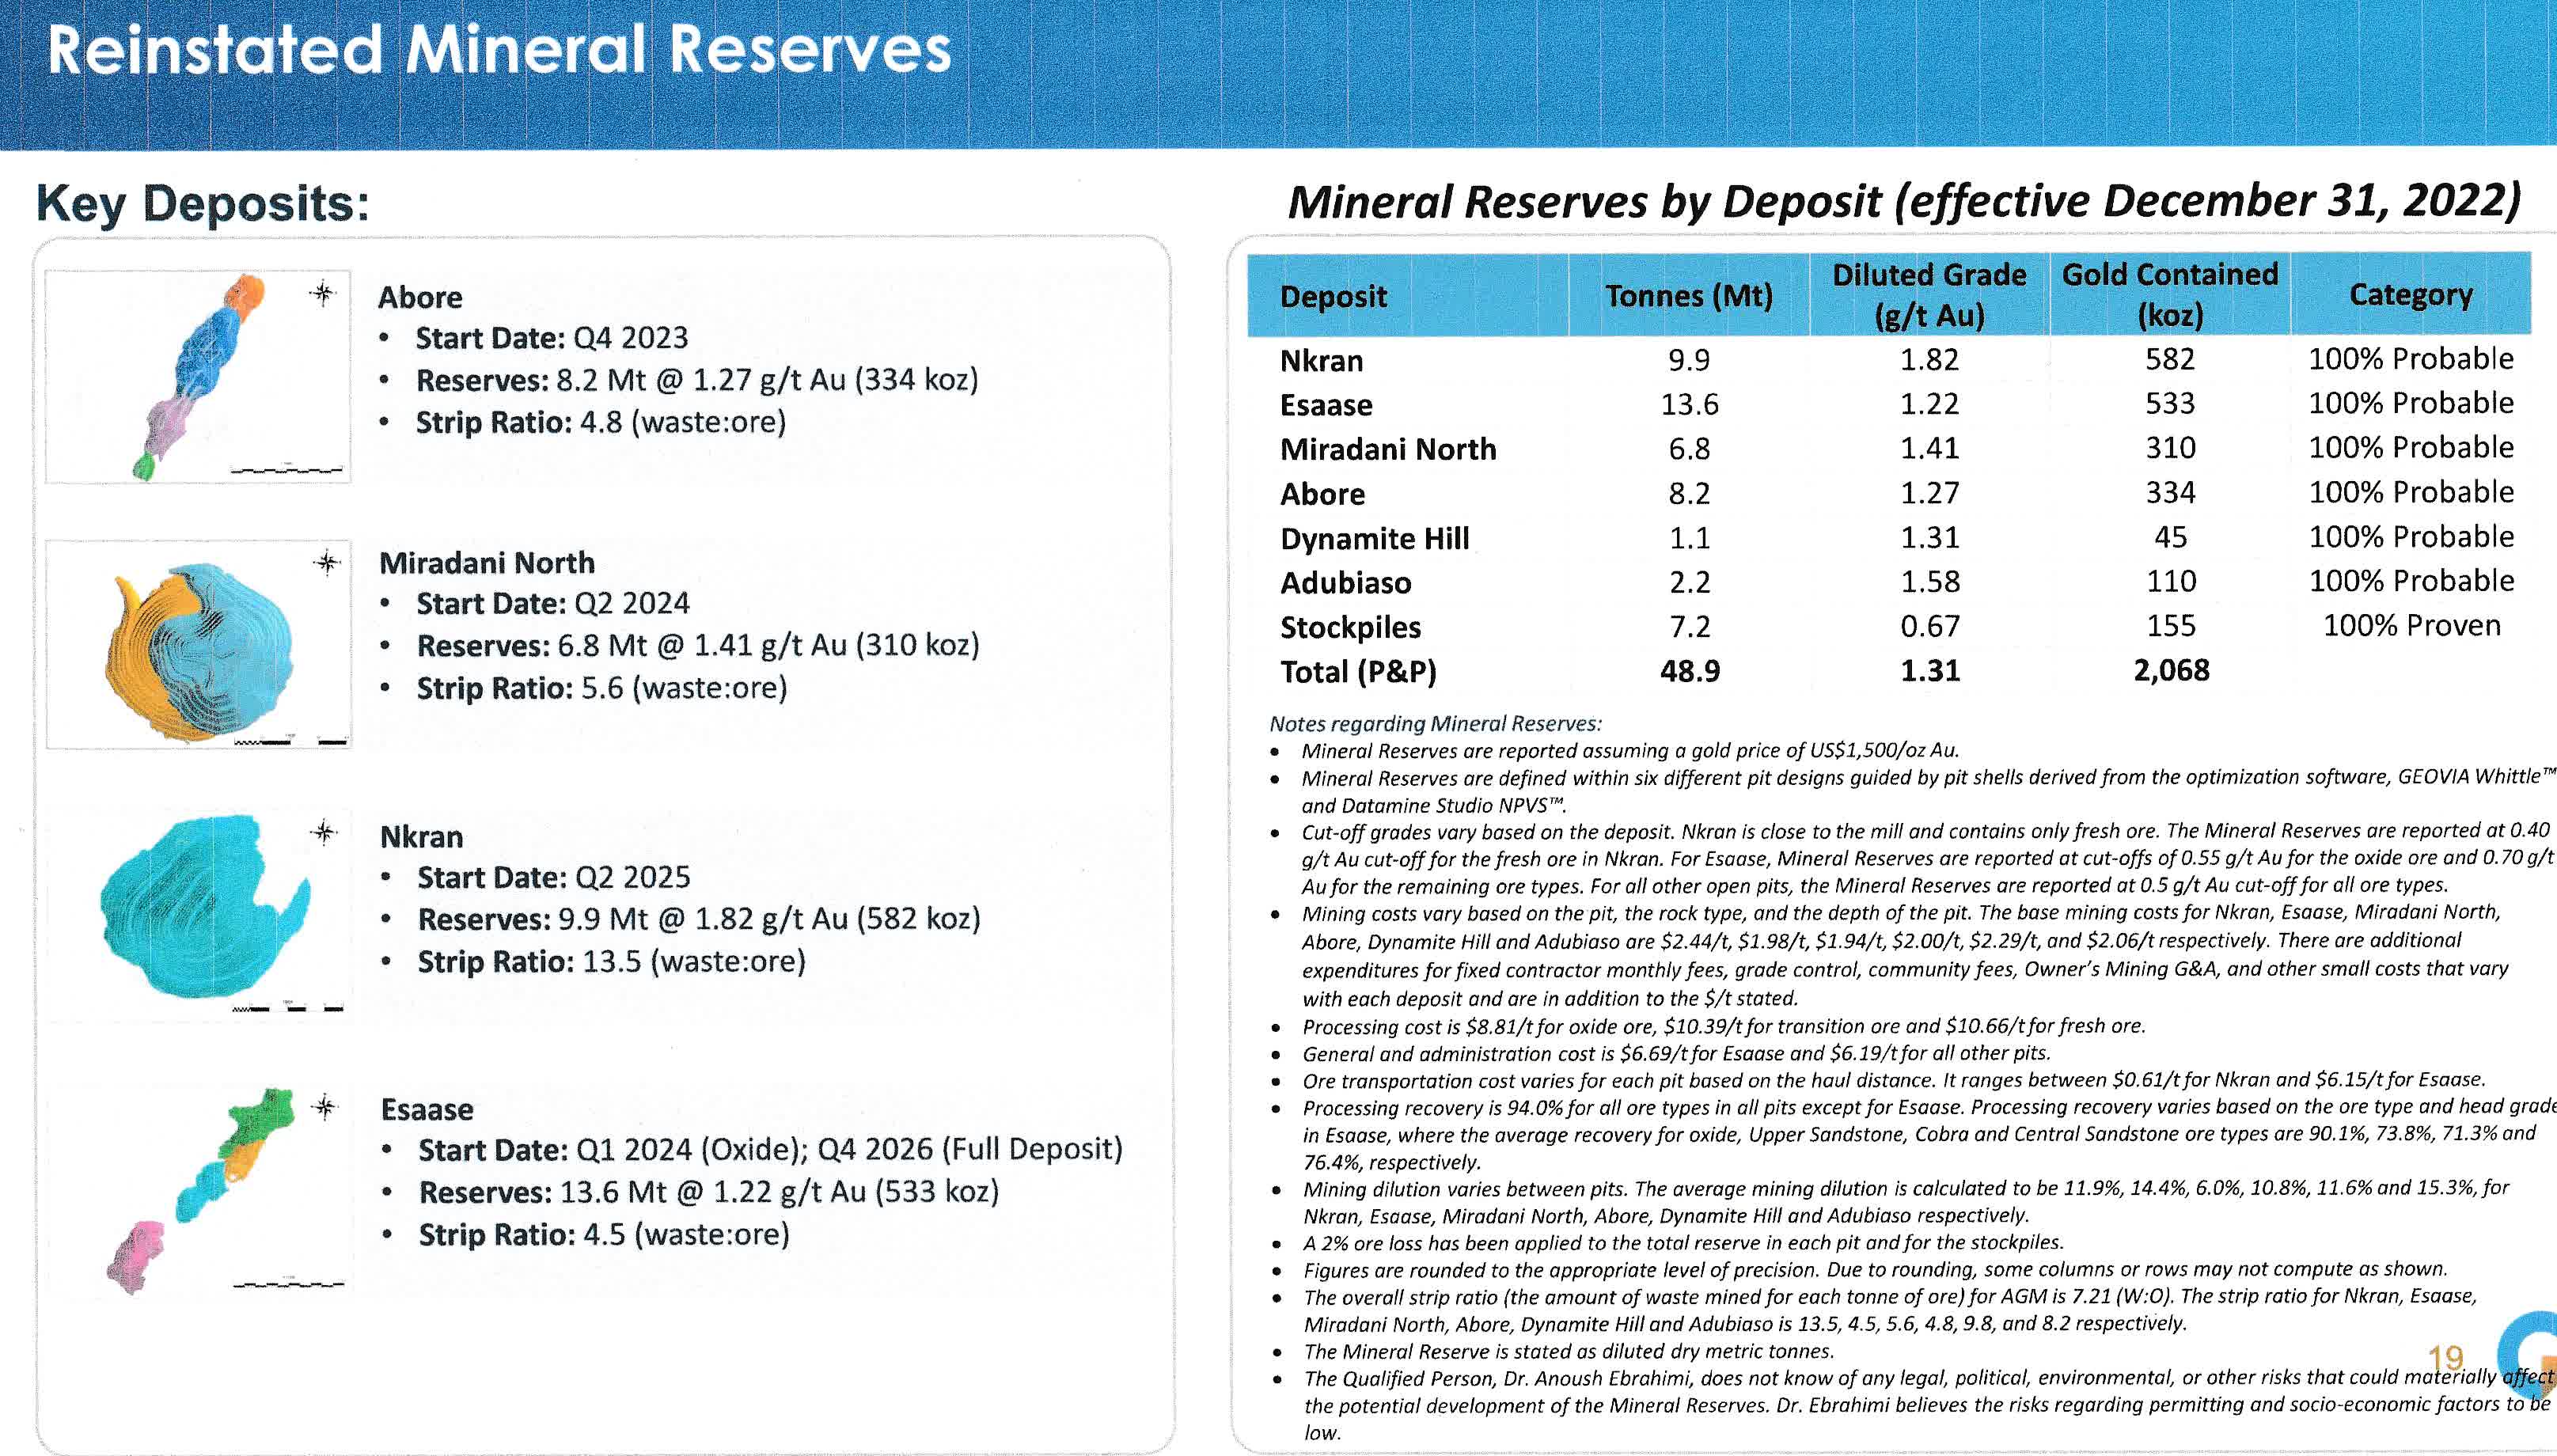
5 - Galiano Gold reinstated Mineral Reserves by Deposit.
Mineral reserves are now 2.068 Moz. LOM is now 8.5 years.
GAU Reserves (GAU Presentation)
Technical Analysis And Commentary
GAU TA Chart short-term (Fun Trading StockCharts)
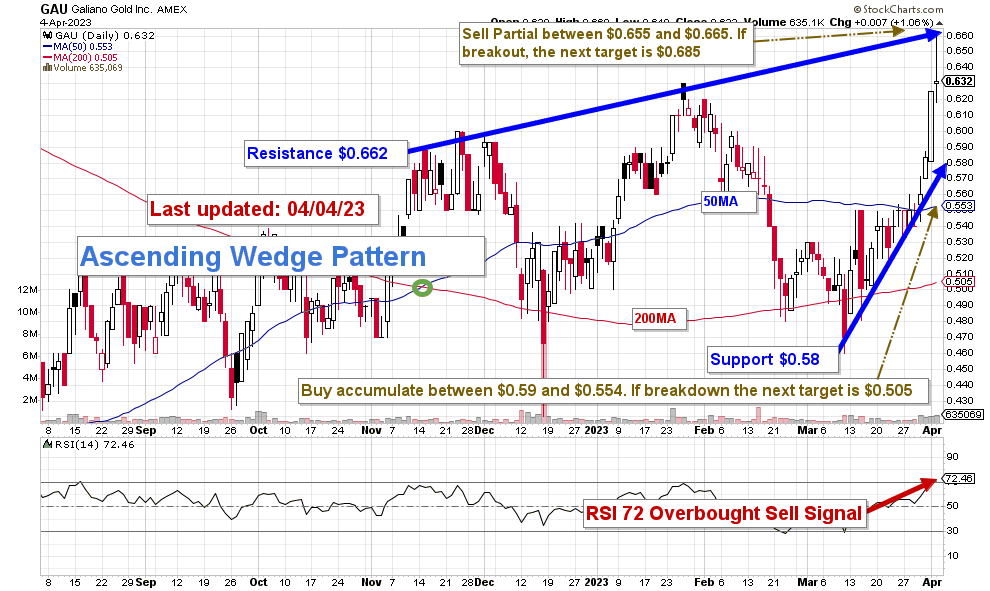
GAU forms an ascending wedge pattern with resistance at $0.66 and support at $0.58.
Ascending wedge patterns are bearish chart pattern that signals an imminent breakout to the downside. It is quite understandable with the recent increase and RSI now at 72.
The trading strategy is to sell partially between $0.655 and $0.665 with possible upper resistance at $0.685 and buy/accumulate between $0.59 and $0.554 with possible lower support at $0.505, whichever comes first.
Gold has been very bullish in the last weeks, which helped considerably GAU, which was not moving much from a depressed valuation.
Thus, I recommend trading LIFO for about 60% of your total position and keeping a tiny core long position for a test of $0.80-$0.90.
Watch the gold price like a hawk.
Warning: The TA chart must be updated frequently to be relevant. It is what I am doing in my stock tracker. The chart above has a possible validity of about a week. Remember, the TA chart is a tool only to help you adopt the right strategy. It is not a way to foresee the future. No one and nothing can.
For further details see:
Galiano Gold: Weak Production Expected In 2023