GIS - General Mills: Down 30% And Approaching Sale Aisle
2023-10-02 17:49:54 ET
Summary
- General Mills, Inc. is down a whopping 29.6% trading near 52-week lows at 15.6x TTM P/E.
- The company generates strong profits and cash flows and now yields a 3.7% dividend.
- With historic free cash flows indicating yields around 6.5%, General Mills is slowly moving onto my watch list at its now more realistic valuation.
General Mills, Inc. ( GIS ) is down a whopping 29.6%, trading near 52-week lows at 15.6x TTM P/E. Taking a closer look at this consumer staple company reveals anemic sales growth with price increases masking volume declines. The company has great cash flows, though with free cash flow ("FCF") yields now around 6.5% at the current valuation supporting the forward dividend yield of 3.7%. This article will take a look at the latest results at General Mills and the potential returns investors might be getting from this low-growth company.
Latest Quarterly Results
General Mill's latest Q1 fiscal year 2024 results showed total net sales of $4.9 billion increasing 4% with organic net sales also increasing 4%. Gross profits of $1.8 billion for the quarter were up 22.3% YoY and were driven by higher gross margins of 35.4% of sales (+5%) due to favorable net price realization and mix as input cost pressures were passed through to consumers. Adjusted operating profit of $899 million increased 2% in constant currency terms and also after adjusting for gains on divestitures in the prior year quarter (down 14% unadjusted). SG&A expenses were $839 million and were up 6.1% YoY which outpaced the 4% revenue growth for the quarter.
Operating profit of $930 million was down 14%, driven by the net gains on divestitures in the prior year and the higher SG&A expenses mentioned. This was partially offset by higher gross profit from price increases. All of this contributed to adjusted diluted EPS of $1.09 being down 1% in constant currency terms (GAAP diluted EPS of $1.14 being down 16 % due to the gains on divestitures from the prior year)
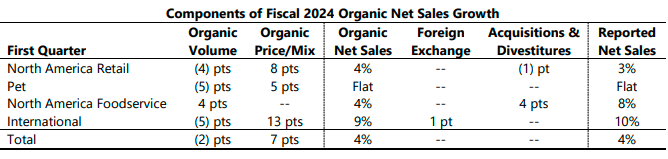
Both net and organic sales increased 4% to $4.9 billion driven by price/mix (+7%) but partially offset by lower pound volume (-2%). As can be seen below, volumes were disappointingly lower across all segments except North American Foodservice (+4%) with the critical Retail segment down 4%. The volume declines across the business were made up for by price increases which averaged 7% across all segments with International putting through the biggest increases of 13% and North American Retail having 8% increases.
Sales Growth Highlights (from General Mills' Q1 FY24 release)
Let's now take a step back and look at how these results fit into the longer-term trends at General Mills. Revenue on a per share basis has grown at an average rate of 4.8% since 2018 with EPS growing 8.5%. SG&A has grown at an average rate of 4.6% over this period which is roughly in line with revenue growth and continues to remain around 17% of sales. Gross profit margins of 33.9% in the latest quarter are right around the 34.1% average over the past 5 years. The increase in gross margins from the latest quarter is General Mill's playing catch-up for the input cost inflation seen in the prior year's quarter that pushed unadjusted gross margins down to 30.7%.
A Highly Profitable and Growing Company
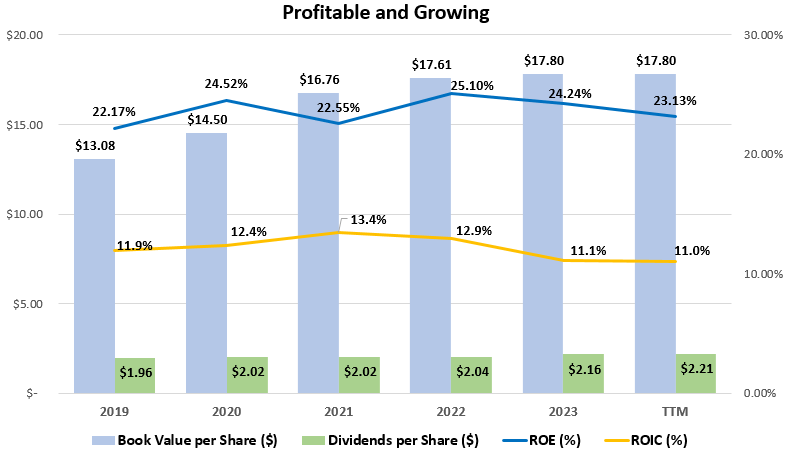
General Mills' brand portfolio has allowed the company to maintain a high level of profitability and return good cash flows to shareholders. Since 2018, the company has achieved average return on equity ((ROE)) and return on invested capital ((ROIC)) of 23.6% and 12.1% respectively. This level of profitability is well above my rule of thumb of 15% ROE and 9% ROIC, allowing me to be confident that, in my opinion, the company is able to maintain and possibly increase its intrinsic value in the future.
Historical Profits and Growth at General Mills (compiled by author from company financials)
Strong Brand & Huge Excess Cash Flows
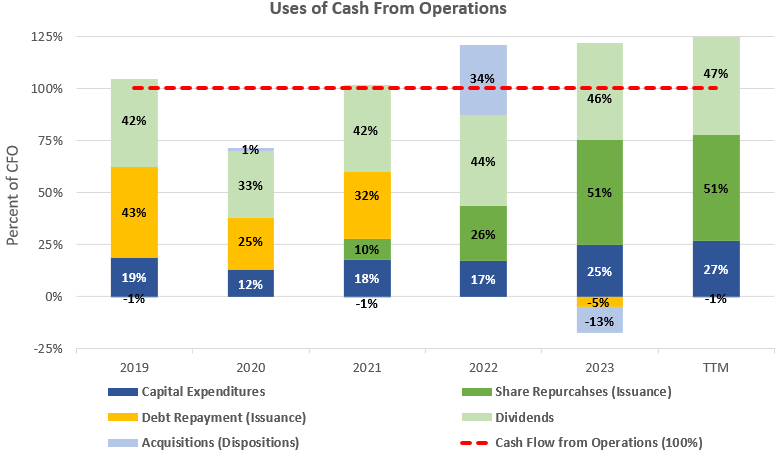
Strong businesses with well-known brands such as General Mills are able to generate cash beyond what is needed to fund operations. With capital expenditures and acquisitions taking up on average 20% and 3%, respectively, of cash flow from operations over the past five years, this leaves approximately 77% to be returned to investors in the form of dividends and share repurchases. With average cash flow from operations of $3.0 billion over the past three years, this 77% would imply free cash flow to shareholders of $2.4 billion for around a 6.5% free cash flow yield at the current $37.2 billion market capitalization. This is a decently high free cash flow yield at the near 52-week low stock price for General Mills and adding a conservative growth rate of 3% to represent the company growth alongside global growth could bring this yield above my target 9% rate.
Cash Flow Analysis of General Mills (compiled by author from company financials)
What does a Sustainable Growth Rate Look Like for General Mills?
We should compare General Mills' historical average growth rates mentioned earlier to what could theoretically be able to be achieved sustainably. A company's sustainable growth rate is the growth that can be achieved without changing the capital structure of the business which makes sense for a mature business such as General Mills. With an average ROE of 38.5% as discussed earlier and a dividend payout ratio of 54% over the TTM, General Mills' sustainable growth rate would be calculated at 10.9% (23.6% ROE x [100% - 54% payout rate]).
The SGR is greater than the 5-year historical growth rates mentioned earlier which average 6.6% (revenue growth 4.8% and EPS growing 8.5%). Seeing this SGR helps me get comfortable adding the historical growth on top of the pre-growth earnings yields. However, I would be hesitant to add the full SGR as that higher growth rate has not been achieved historically. We will take this long-term growth rate and add it on top of the other shareholder yields we have discussed in this article.
Getting a Sense of Valuation
General Mill's 15.6x TTM P/E ratio can also be expressed as a 6.4% earnings yield, but I also always like to examine the relationship between average ROE and price-to-book value in what I call the Investors' Adjusted ROE. It examines the average ROE over a business cycle and adjusts that ROE for the price investors are currently paying for the company's book value or equity per share. General Mills has a great ROE, but potential returns for investors depend on the multiple paid for the book value of equity in the public stock market.
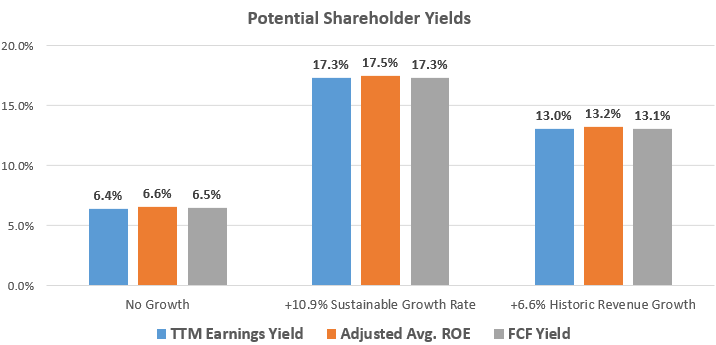
With General Mills earning an average ROE of 23.6% since 2018 and shares currently trading at a price-to-book value of 3.6x when the price is $63.99, this would yield an investors' Adjusted ROE of 6.6% for an investors' equity at that purchase price, if history repeats itself. This is no growth rate is slightly below the 9% that I like to see, but adding the growth rates discussed earlier could increase this potential total return beyond my 9% target. Below is a table outlining the potential earnings yield estimates from this investors' adjusted ROE figure as well as the cash flow and earnings yields discussed.
Potential Shareholder Yields from General Mills (compiled by author from market data and company financials)
Takeaway for Investors
General Mills, Inc. stock is starting to approach value territory after its nearly 30% slide to 52-week lows. However, the company has rather anemic growth with mainly price increases seen supporting revenues in recent quarters. The historic low sales growth and little potential for outsized growth make General Mills' mid-teen P/E hard to justify long-term.
General Mills, Inc. stock looks to be a good hedge to inflation from recent price increases commanded. With both TTM earnings and free cash flows indicating yields around 6.5%, General Mills is slowly moving onto my watch list at its now more realistic valuation.
For further details see:
General Mills: Down 30% And Approaching Sale Aisle