GIS - General Mills Needs Volume Growth
Summary
- General Mills is overvalued based on valuation metrics and discounted cash flow model.
- High inventory costs are a concern across consumer staples and the industrial sectors.
- Not a good time to carry a high debt load.
General Mills (GIS) has a great collection of brands and is holding or gaining market share across many of its product lines. The company can grow at a low single-digit pace but is currently valued as a growth stock. The Consumer Staples sector had a good run over the past year, with the Vanguard Consumer Staples ETF (VDC) dropping just 4%, while the Vanguard S&P 500 ETF (VOO) dropped 11.4%. But this run may have run out of steam. General Mills may yet report a couple of more good quarterly growth rates, but the growth may not be sustainable for the long term. Investors may be better off waiting for a pullback in the stock.
The unsustainable price increases will take a toll on volumes
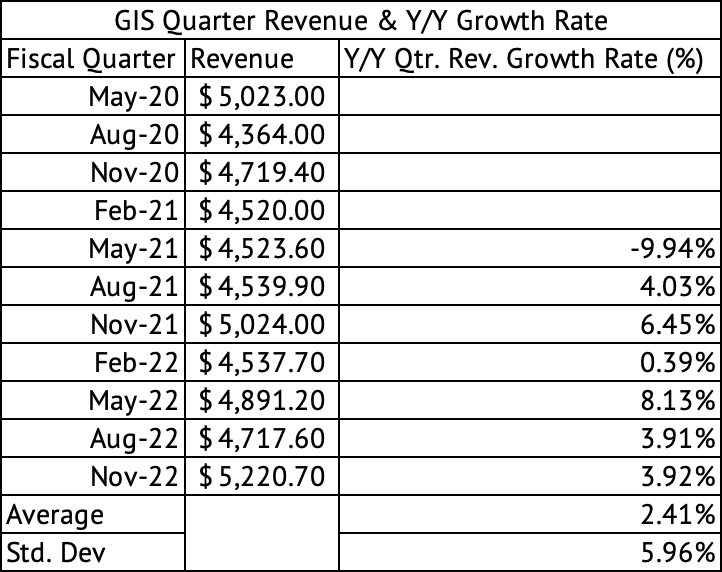
The company has seen uneven revenue growth over the years, with an annual average growth rate of 0.83%. The company's revenue growth has relatively high variability, with a high standard deviation of 4.8%. Since May 2020, the company's y/y quarterly revenue growth rate has averaged 2.4% (Exhibit 1) . But Q2 2023 revenue growth was driven by price increases of 17%, while volume declined by 6%, leading to organic growth of 11% (Exhibit 2) . Total net sales increased in Q2 2023 by 4% compared to the previous year. The company's divestitures reduced revenue by 5%, and the strong dollar reduced revenue by 1%.
Exhibit 1:
General Mills Quarterly Revenue and Y/Y Growth Rate (Seeking Alpha, Author Compilation)
Exhibit 2:
General Mills Components of Q2 2023 Sales Growth (Seeking Alpha)
The company painted a similar picture in Q1 2023, with a 15% price increase driving sales while volume declined by 5%. The company has experienced inelastic demand in the face of double-digit price increases. But, that pricing power may not last, and at some point, consumers will get a sticker shock and cut back on their consumption.
Overvalued based on valuation metrics and DCF
General Mills is valued as a growth stock but overvalued based on valuation metrics and a discounted cash flow model. The stock trades at a trailing GAAP P.E. of 17x and a forward P.E. of 18x , compared to a five-year average of 16.5x. The company sells at a forward price to sales of 2.4x compared to its five-year average of 1.98x.
A discounted cash flow model, which assumes a long-term growth rate of 5%, a free cash flow margin of 12%, and a discount rate of 10%, yields a per-share equity value of $62.05 (Exhibit 3) . The company is currently trading at $77.46, overvalued by 24%. A 5% revenue growth rate may be too optimistic, given that the company grew at an average annual rate of less than 0.8%. The company averaged an annual free cash flow [Operating Cash Flow - CapEx] margin of 12.5% with a standard deviation of 2.3%. So, assuming a 12% long-term free cash flow margin may be appropriate for the company.
Exhibit 3:
General Mills Discounted Cash Flow Model (Seeking Alpha, Author Calculations)
Watch the rising inventory levels for signs of slowing sales
Investors should closely watch the rising inventory levels at the company. Over the past ten years, General Mills carried an average of 52 days' worth of sales in inventory with a standard deviation of 4 (Exhibit 4) . One standard deviation from the mean would be 48 to 56 days of sales in inventory. As of the trailing twelve-month data, the company is carrying 59 days' worth of sales in inventory, well above the one standard deviation from the mean. The company's volume declines have been muted in the face of double-digit price increases, but that may not continue if inflation remains persistent and the company implements further price increases. If volume declines hasten, there could be a further spike in inventory levels that could dampen sales and pressure margins.
Exhibit 4:
General Mills Days Sales in Inventory (Seeking Alpha, Author Calculations)
Consumer staples and industrial companies have seen a spike in inventory costs (Exhibit 5) in the past year. Some of them, such as RPM International (RPM), is now forecasting lower sales, which was portended by the spike in inventory levels. McCormick (MKC), which reports quarterly earnings on January 26, may be in trouble due to its high inventory levels of 125 days of sales compared to its average of 101.
Exhibit 5:
ADM, INGR, MKC, CLX, PG, SJM, GIS, CAG, KMB Days Sales in Inventory (Seeking Alpha, Author Calculations)
Dividend, debt, and buybacks
General Mills grew its dividend by 2.9% over the past year, while its average growth rate was 1.3% over the past five years. The company pays a dividend of 2.6%, a good yield compared to that of the Vanguard S&P 500 Index ETF, which yields 1.6%, but poor compared to the risk-free 2-year U.S. Treasury Yield of 4.2%. It has a manageable payout ratio of 50%.
GIS is carrying a relatively high debt load of $11.7 billion, which puts its current debt-to-EBITDA ratio at just above 3x. The company's short-term liquidity is low, as measured by current and quick ratios. Its operating cash flow over the twelve months was $3.01 billion, putting its debt-to-operating cash flow ratio at a high 3.8x. The company has focused on share buybacks at the expense of debt repayments.
Between 2013 and 2022, the company did $7.9 billion in share repurchases while issuing $2.6 billion worth of new shares. While it continues to make share repurchases, it is refinancing its debt. GIS will gain more financial and strategic flexibility if it gets its debt-to-EBITDA ratio to 2x or below.
Price momentum
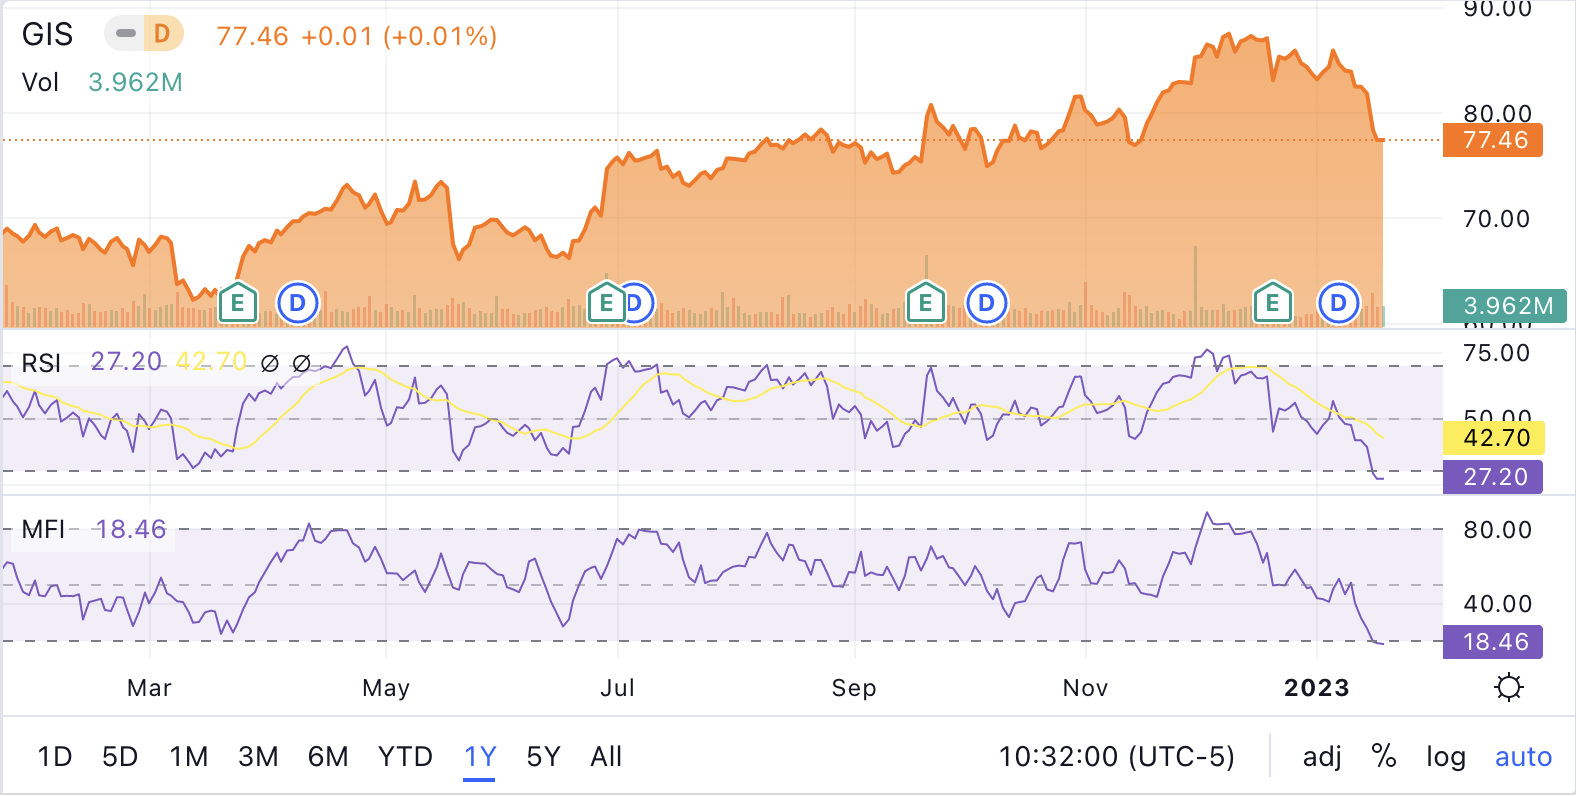
The stock has returned 13.1%, while the Vanguard S&P 500 Index ETF returned a negative 11.4% over the past year. The stock has lower volatility than the market, with a beta of 0.33. But, the stock's RSI and MFI technical indicators are approaching oversold levels (Exhibit 6) . The turbulence in the market has pushed investors to take refuge in the consumer staples sector, which is packed with low-beta stocks, expanding its valuation multiples.
But, since the beginning of 2023, investors have returned to high-beta technology stocks, with the Invesco QQQ ETF ( QQQ ) (NASDAQ-100 companies) returning 6.8% YTD. This rally in the NASDAQ may have fueled a sell-off in consumer staples stocks, with General Mills dropping 6.9% YTD. If the NASDAQ rally continues, consumer staples stock may get hit hard. If the valuation drops further, this sell-off may present a buying opportunity.
Exhibit 6:
General Mills RSI and MFI Technical Indicators at Oversold Levels (Seeking Alpha)
General Mills has outperformed the market over the past year, but its price momentum is fading. The stock is overvalued based on valuation metrics and a discounted cash flow model. The company carries a high debt load, but its dividend needs to grow faster to catch up with the yield offered by the 2-year U.S. Treasury. General Mills has great brands and good stock to own for the long term, but there will be better times to buy its stock.
For further details see:
General Mills Needs Volume Growth