GIS - General Mills: Promising Opportunity With A High Price Tag
2023-06-28 09:14:40 ET
Summary
- General Mills holds a 3.60% market share in the global food market, which is expected to grow from $9.24 trillion in 2023 to $13.11 trillion in 2028.
- The company's focus on snacks, cereals, convenient meals, and other segments is projected to grow at an annual rate of 7.38%, in line with overall market growth.
- General Mills may rely on mergers and acquisitions for returns due to its smaller size compared to rivals like PepsiCo, Nestlé, and Unilever.
Thesis
The worldwide food and beverage market is expected to grow at a pace of 7.25%. Among all of those markets, the ones in which General Mills, Inc. ( GIS ) operates are expected to grow at a slightly higher pace of 7.38%. Furthermore, General Mills only controls 3.6% of the world's food & beverages industry, leaving plenty of room for expansion. I conducted a DCF model valuation, which yielded a price target of $145.07. This indicates an upside potential of 77% from 2023 to 2028.
General Mills has been trading in the opposite direction of the market trend. While the market has been on a bearish trend since January 2022, General Mills has experienced a bullish trend driven by its earnings beats and food inflation. This positive performance was influenced by consumers having extra disposable income from the pandemic. It's worth noting that the stock is currently overvalued compared to the average peers' ratios. However, the potential downside of 10% suggests that not buying the stock solely because of its overvaluation may not be a wise decision.
Therefore, I assign a stock price target of $145.07 for 2028 and a "buy" rating, because the current stock price may be relatively overvalued for the current state of the company, however, the cash flows General Mills is likely going to generate in the future still, in my opinion, offer a good upside.
Market Overview
The global food & beverage market is highly fragmented , with various companies competing for market share. Currently, General Mills holds approximately 3.6% of the market. However, when looking at the chart below, it becomes evident that General Mills still has ample room for growth in order to secure a place among the top three companies.
| Company |
| Market Share |
| Country |
| Nestle ( NSRGY ) |
| 20.20% |
| Switzerland |
| PepsiCo ( PEP ) |
| 12.30% |
| United States |
| Coca-Cola ( KO ) |
| 10.80% |
| United States |
| Unilever ( UL ) |
| 9.40% |
| United Kingdom/Netherlands |
| Mondelez International ( MDLZ ) |
| 7.70% |
| United States |
| Danone ( DANOY ) |
| 6.60% |
| France |
| Tyson Foods ( TSN ) |
| 5.50% |
| United States |
| The Kraft Heinz Company ( KHC ) |
| 4.70% |
| United States |
| The Hershey Company ( HSY ) |
| 4.10% |
| United States |
| JBS ( JBS ) |
| 3.90% |
| Brazil |
| Archer-Daniels-Midland ( ADM ) |
| 3.80% |
| United States |
| Cargill |
| 3.70% |
| United States |
| General Mills |
| 3.60% |
| United States |
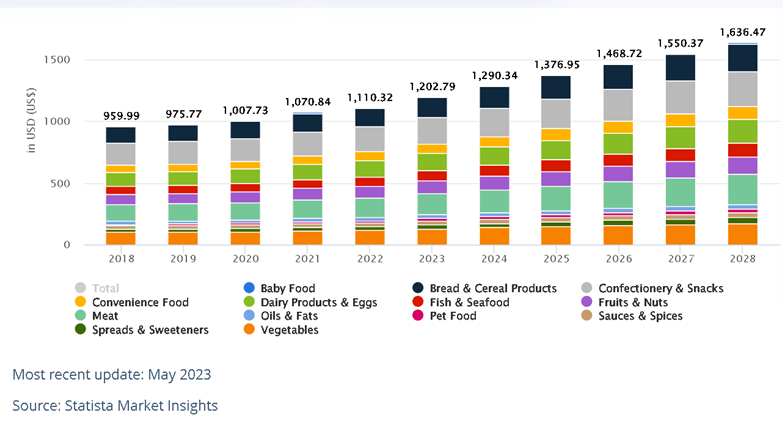
The revenue of the worldwide food market is expected to grow at an annual rate of 7.25% from 2013 to 2028 . As of 2023, the current revenue of the worldwide food market stands at $9.24 trillion, and it is projected to reach $13.11 trillion by 2028.
Projections of the Worldwide Food Market (Statista)
According to the 2022 annual report, General Mills focuses on selling snacks, cereals, convenient meals, refrigerated dough, baking mixes, yogurt, and super-premium ice cream. These segments are expected to grow at an annual rate of 7.38%, which aligns with the overall market growth rate.
| (In trillions of USD) |
| 2023 |
| 2024 |
| 2025 |
| 2026 |
| 2027 |
| 2028 |
| Confectionery & Snacks |
| $1.65 |
| $1.77 |
| $1.89 |
| $2.01 |
| $2.13 |
| $2.25 |
| Convenience food |
| $0.60 |
| $0.65 |
| $0.70 |
| $0.75 |
| $0.80 |
| $0.85 |
| Pet Food |
| $0.15 |
| $0.16 |
| $0.17 |
| $0.19 |
| $0.20 |
| $0.22 |
| Bread & Cereal products |
| $1.25 |
| $1.36 |
| $1.47 |
| $1.59 |
| $1.69 |
| $1.80 |
| Dairy Products |
| $1.08 |
| $1.17 |
| $1.25 |
| $1.35 |
| $1.45 |
| $1.55 |
| Total |
| $4.73 |
| $5.11 |
| $5.48 |
| $5.89 |
| $6.27 |
| $6.67 |
| Change % |
| 8.73% |
| 8.0% |
| 7.2% |
| 7.5% |
| 6.5% |
| 6.4% |
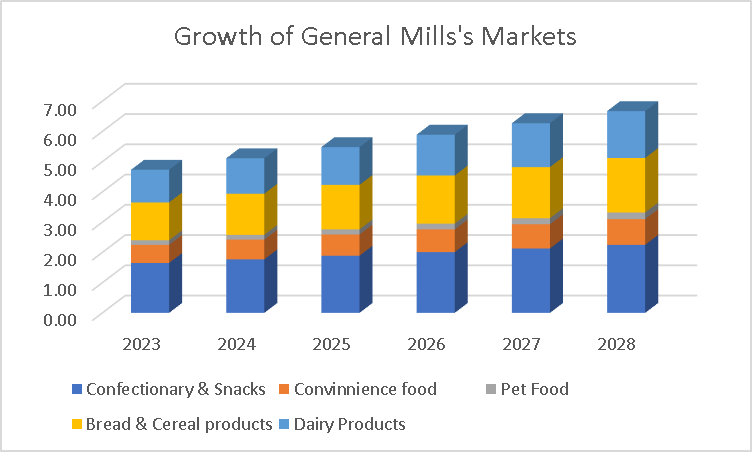
Growth of General Mills' Markets (Author's Calculations based on Statista)
While this growth rate may be considered slow compared to other markets like semiconductors or cloud computing, it presents General Mills with opportunities for extraordinary returns through mergers and acquisitions. Given General Mills' smaller size compared to rivals such as PepsiCo, Nestlé SA, or Unilever, there is significant room for expansion.
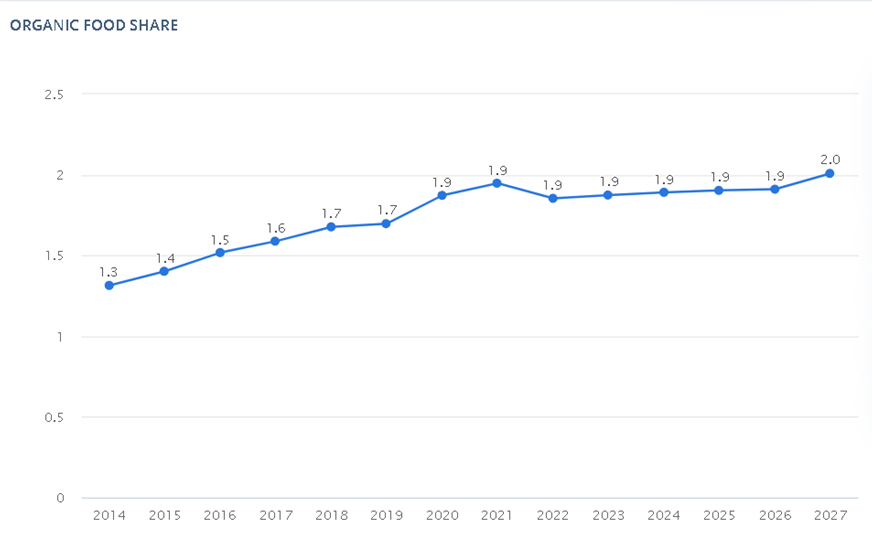
Furthermore, the increasing market share of organic foods is an important aspect for General Mills' growth. Although the overall market projection for organic foods is relatively stagnant, General Mills currently holds a 1.44% market share in this segment. This indicates that they have ample room to continue expanding even if the overall market experiences limited growth.
Organic Food Share of the Worldwide Food Market (Statista)
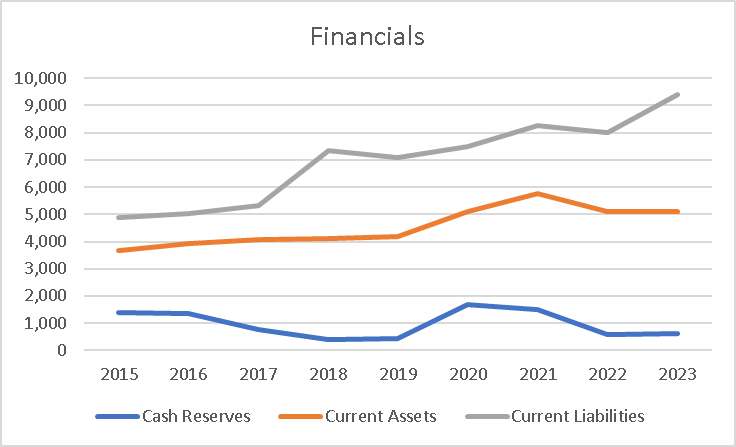
Financials (In Millions of USD Unless Stated Otherwise)
General Mills has been investing in mergers and acquisitions (M&A) in response to the slow market growth. From 2015 to 2022, General mills has made the following acquisitions:
Annie's Homegrown - 2015
Epic Provisions -2017
Blue Buffalo Pet Products - 2018
Yoplait Canada - 2021
Tyson Foods' Pet Treats business - 2021
TNT Crust - 2022
The company's cash reserves have been predominantly declining, dropping from $1.38 billion in 2015 to $618 million in 2023. Consequently, this has led to a situation where the company possesses 84% more current liabilities than current assets.
Financials (Author's Calculation)
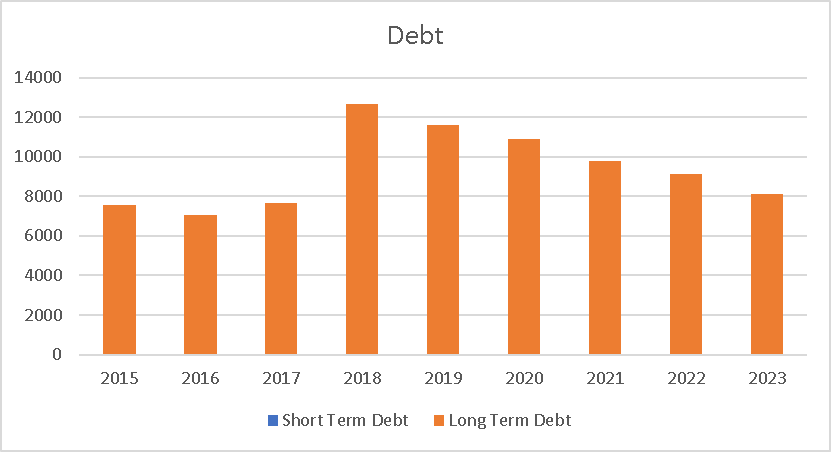
Regarding debt, General Mills has been steadily reducing its long-term debt since 2018. It currently stands at $8.14 billion, down 35% from the $12.6 billion in 2018. This indicates that despite engaging in numerous M&A activities, they are pursuing a rational approach rather than an aggressive one. This approach is similar to that of Panama's Copa Holdings, S.A. ( CPA ), where they avoid carrying significant debt loads and focus on growing profitability while making strategic investments. General Mills can leverage this strategy due to operating in a market that is not highly capital-intensive.
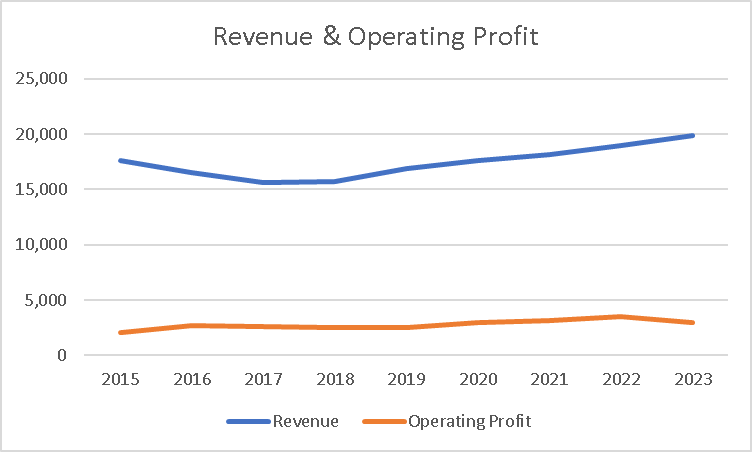
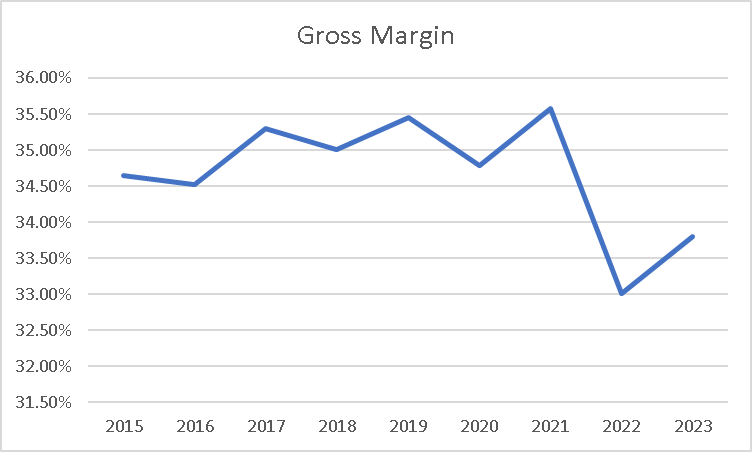
General Mills' revenue has been growing at an annual pace of 4.40% since 2018. However, when looking back to 2015, the annual growth rate in revenues is merely 1%. The operating profit has experienced a growth rate close to that of revenue, at 4.7%. Their gross margin has shown little to no improvement in efficiency, partly due to inflation in commodity prices and supply chain bottlenecks. These bottlenecks have resulted in a cost of $1.5 billion in 2022. The resolution of these problems serves as a catalyst for the stock, as General Mills has been diligently expanding its Holistic Margin Management ((HMM)) across all business segments. The additional costs incurred have been offset by price increases, for now.
| Revenue |
| Operating Profit |
| 2015 |
| $17,630 |
| $2,077 |
| 2016 |
| $16,563 |
| $2,707 |
| 2017 |
| $15,619 |
| $2,566 |
| 2018 |
| $15,740 |
| $2,509 |
| 2019 |
| $16,865 |
| $2,515 |
| 2020 |
| $17,626 |
| $2,953 |
| 2021 |
| $18,126 |
| $3,145 |
| 2022 |
| $18,992 |
| $3,475 |
| 2023 |
| $19,900 |
| $2,959 |
Revenue & Operating Profit (Author's Calculation) Gross Margin (Author's Calculation)
Overall it is a financially fine company, its gross margin will probably be fixed as commodities prices decrease.
Valuation (In USD Unless Stated Otherwise)
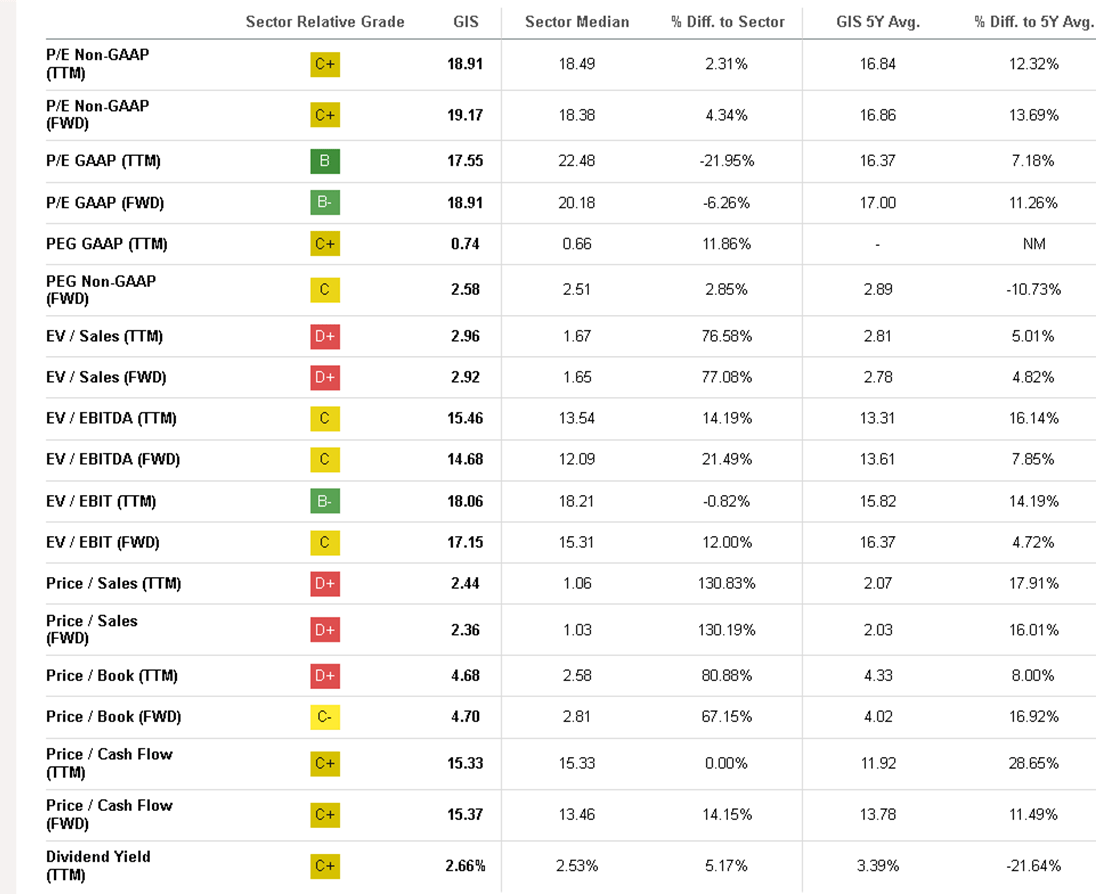
First of all, it is important to note that General Mills, in its current form, is overvalued compared to its peers (which is the "high price tag" I mentioned in the title). Therefore, I need to determine if General Mills' future cash flows, can deliver a good upside potential.
Seeking Alpha's Relative Valuation (Seeking Alpha)
To determine a target for General Mills, I will utilize a Discounted Cash Flow model to assess whether it is worth buying at its current stock price of $81.58. As previously mentioned, General Mills is currently overvalued compared to its peers, but it is important to evaluate whether the projected future cash flows offer a suitable upside potential from now until 2028.
Firstly, I will refer to a table representing the expected growth rates of the food segments in which General Mills operates. The anticipated growth rates for the upcoming years are as follows: 8.73% for 2023, 8% for 2024, 7.2% for 2025, 7.5% for 2026, 6.5% for 2027, and 6.4% for 2028.
Based on this information, I will project the growth rates onto General Mills' revenue, which would appear as follows:
| Revenue |
| 2023 |
| $20,650,000,000 |
| 2024 |
| $22,302,000,000 |
| 2025 |
| $23,907,000,000 |
| 2026 |
| $25,700,000,000 |
| 2027 |
| $27,371,000,000 |
| 2028 |
| $29,123,000,000 |
Next, I will proceed to calculate the expected net income before taxes by applying a simple proportion based on historical data, specifically the ratio of net income to General Mills' revenue, which stands at 16%. However, it is important to note that the model cannot predict the precise effects of the HMM strategy. Some individuals may assume that the strategy will yield positive results, while others may have reservations. Regardless, for the purpose of this analysis, I will maintain this proportion unchanged. If the HMM strategy proves successful, it would indicate that General Mills has a higher value.
| Revenue |
| Net Income |
| 2023 |
| $20,650,000,000 |
| $3,304,000,000 |
| 2024 |
| $22,302,000,000 |
| $3,568,320,000 |
| 2025 |
| $23,907,000,000 |
| $3,825,120,000 |
| 2026 |
| $25,700,000,000 |
| $4,112,000,000 |
| 2027 |
| $27,371,000,000 |
| $4,379,360,000 |
| 2028 |
| $29,123,000,000 |
| $4,659,680,000 |
Next, let's move on to projecting the D&A (Depreciation and Amortization) expenses, as well as interest expenses, using historical data as a reference. The average variation in D&A expenses from 2015 to 2023 is 4.5%, while the corresponding figure for interest expenses is -6.1%.
| D&A Projection |
| Interest Projection |
| 2023 |
| $544,967,500 |
| $304,329,900.00 |
| 2024 |
| $569,491,037.50 |
| $285,765,776.10 |
| 2025 |
| $595,118,134.188 |
| $268,334,063.76 |
| 2026 |
| $621,898,450.226 |
| $251,965,685.87 |
| 2027 |
| $649,883,880.486 |
| $236,595,779.03 |
| 2028 |
| $679,128,655.108 |
| $222,163,436.51 |
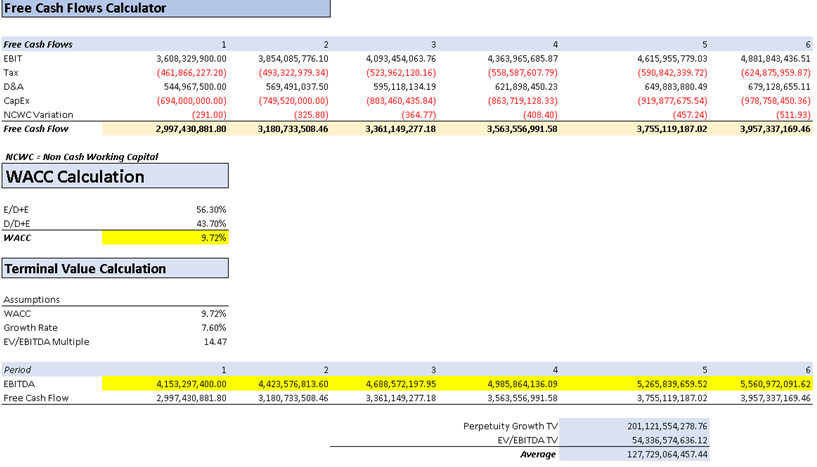
Now, we can assemble the table to calculate the EBITDA (Earnings Before Interest, Taxes, Depreciation, and Amortization) for each of the years included in this projection:
| Revenue |
| Net Income |
| Plus D&A |
| Plus Interest |
| 2023 |
| $20,650,000,000 |
| $3,304,000,000 |
| $3,848,967,500 |
| $4,153,297,400 |
| 2024 |
| $22,302,000,000 |
| $3,568,320,000 |
| $4,137,811,038 |
| $4,423,576,814 |
| 2025 |
| $23,907,000,000 |
| $3,825,120,000 |
| $4,420,238,134 |
| $4,688,572,198 |
| 2026 |
| $25,700,000,000 |
| $4,112,000,000 |
| $4,733,898,450 |
| $4,985,864,136 |
| 2027 |
| $27,371,000,000 |
| $4,379,360,000 |
| $5,029,243,880 |
| $5,265,839,660 |
| 2028 |
| $29,123,000,000 |
| $4,659,680,000 |
| $5,338,808,655 |
| $5,560,972,092 |
| ^Final EBITA^ |
Finally, it is time to gather the necessary assumptions for the DCF model. The projections for capital expenditures are based on a calculated CapEx margin, derived by dividing capital expenses by revenue. As shown, the margin stands at 3.36%, which is used to project capital expenditures from 2023 to 2028. Another aspect to consider is the changes in Non-Cash Working Capital, for which I once again rely on historical variations, resulting in an average of -$291.
| (In millions) |
| NCWC |
| Change % |
| Change |
| 2015 |
| $(2,591) |
| - |
| - |
| 2016 |
| $(2,437) |
| -5.94% |
| $154 |
| 2017 |
| $(2,035) |
| -16.50% |
| $402 |
| 2018 |
| $(3,617) |
| 77.74% |
| $(1,582) |
| 2019 |
| $(3,351) |
| -7.35% |
| $266 |
| 2020 |
| $(4,047) |
| 20.77% |
| $(696) |
| 2021 |
| $(4,016) |
| -0.77% |
| $31 |
| 2022 |
| $(3,499) |
| -12.87% |
| $517 |
| 2023 |
| $(4,920) |
| 40.61% |
| $(1,421) |
| 11.96% |
| $(291) |
Assumptions (Author's Calculation)
DCF Part 1 (Author's Calculation)
DCF Part 2 (Author's Calculation)
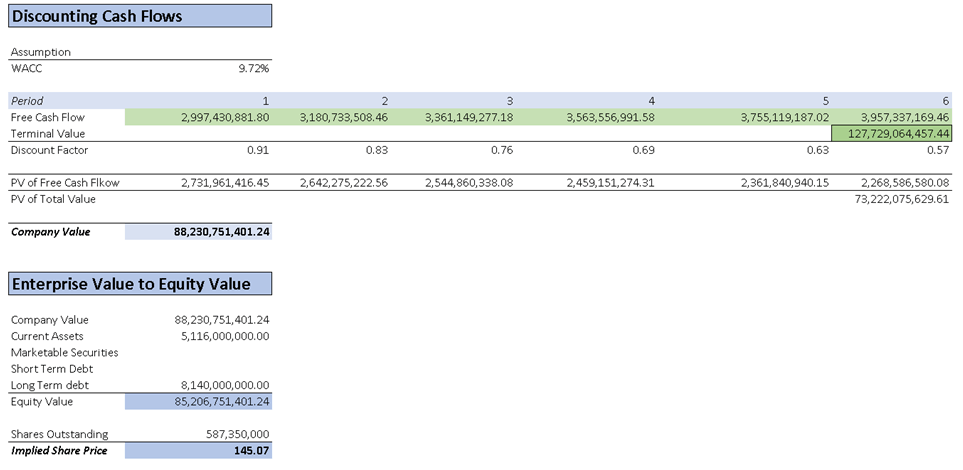
The DCF model projects a stock price of $145.06, indicating a potential upside of 77% from the current stock price of $81.58. General Mills' stock price has experienced a decline of 9.8% from its peak of $90 on May 12, which, in my view, presents a significant enough decrease to consider entering the stock. Furthermore, the stock currently offers a dividend yield of 2.66%, which has grown at an average rate of 1.96% over the past five years. Considering these factors, I feel comfortable entering the market at this point and believe there is still a good upside left, making it worthwhile to buy the stock despite its overvalued state.
Another crucial aspect is the negative market sentiment at present, and this sentiment may continue to decline unless positive news emerges, such as a better-than-expected jobs report, CPI report, or higher-than-anticipated Q2 earnings for General Mills on June 28. However, there is the possibility that, even if General Mills exceeds estimates in its June 28 earnings, market sentiment may not support a significant increase in the stock price. In that scenario, I predict that the stock could decline to $73.27 (The number I obtained is the average price after adjusting all the multiples to match those of the peers) after the initial price spike due to a supposed earnings beat, representing a decrease of approximately 10% from the current price of $81.58. Nevertheless, if it does beats in earnings, it could push the stock closer to a fair valuation. Furthermore, it's worth noting that General Mills has not followed the overall downward trend of the stock market since January 2022. In the chart below you can see the suggested stock prices by adjusting General Mills' multiples to those of the peers:
| Price/Sales |
| Price/Cash Flow |
| Price/Book |
| P/E |
| EV/EBITDA |
| EV/Sales |
| EV/EBIT |
| $35.94 |
| $81.10 |
| $45.00 |
| $107.00 |
| $87.40 |
| $55.50 |
| $101.00 |
| Average Stock Price |
| $73.28 |
I propose a price target of $145.07 for General Mills, representing a 77% upside potential from 2023 to 2028. Considering the company's positive growth, the stock's performance contrasting the overall bearish trend, an annual growth rate of 12.8% in a conservative DCF analysis, and the additional dividend yield of 2.66%, I assign a "buy" rating.
Risks to Thesis
There are three risks associated with this thesis. The first risk is that General Mills may eventually align with the downward trend of the stock market, resulting in a decrease in its stock price even if the company beats estimates. The second risk is the potential loss of market share by General Mills over the projected six-year period. Lastly, the third risk pertains to the possibility of unsuccessful merger and acquisition (M&A) activities within the same timeframe, which could negatively impact the company's fundamentals, and therefore, cause General Mills to not be able to achieve the price target I put.
Conclusion
General Mills operates in the global food and beverages market, holding a small market share but with room to expand. The company focuses on various food segments expected to grow at a rate in line with the overall market. General Mills has been investing in mergers and acquisitions to generate extraordinary returns in a slow-growth market. Its growth in the organic food segment has been a significant driver, despite the market's overall low growth projection.
Financially, General Mills has managed its liabilities and debt, recovering cash reserves while reducing long-term debt. Although revenue and operating profit have grown moderately, the gross margin has not shown significant improvement due to external factors.
Using a DCF model, the projected stock price for General Mills is $145.06, indicating a potential upside of 77% from the current stock price, which for me, it's good enough to enter the stock despite it being overvalued in relation to its peers.
Risks to the thesis include the potential alignment of General Mills with the downward trend of the stock market, market share losses, and the impact of unsuccessful M&A activities.
In conclusion, General Mills is rated as a "buy" due to its growth potential, contrary trading trend, and a combination of annual growth rate and dividend yield. Nonetheless, monitoring market conditions and considering the identified risks is crucial.
For further details see:
General Mills: Promising Opportunity With A High Price Tag