GIS - General Mills: Things Are Looking Up
2023-08-30 15:28:19 ET
Summary
- General Mills, Inc. has faced a challenging year, but the worst may be over.
- The company is poised to deliver improving operating leverage over the next two years and forward valuations don't reflect that.
- GIS's cash conversion is poised to improve by 150bps this year, improving the prospects of better shareholder distributions.
- We like the risk-reward on the charts and we also appreciate the stock's increasingly low sensitivity to the broader markets.
Introduction
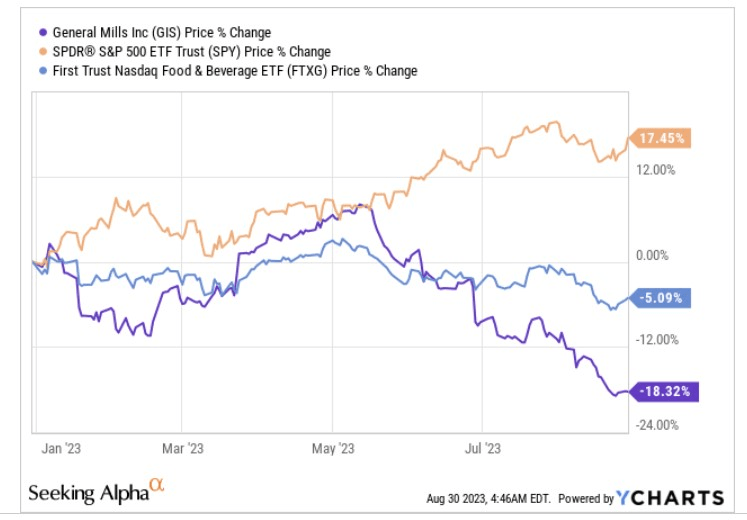
General Mills, Inc. ( GIS ), the US-based branded consumer foods company, has faced a challenging 2022; admittedly, food and beverage stocks in general, haven’t enjoyed the brightest of years (a popular food and beverages ETF-FTXG is down by mid-single-digits on a YTD basis), but GIS’s underperformance has been a lot more pronounced. With only one-third of the year left to go, it could be asking for a lot to expect GIS to recoup all its losses, but we’d like to think the worst is over, and the prospects may well change from hereon.
Let’s expand on some of the underlying sub-themes that are behind our more optimistic stance.
Financial Outlook And Valuations
The consumer environment in the US may not necessarily be the most resilient and even otherwise, the consumer staples sector isn’t the most high-growth avenue around. Yet despite all that, we still see quite a few encouraging cogs within GIS’s future outlook.
Firstly, note that the company’s long-term “organic” net sales target is only 2-3% , yet the expected growth for FY May 2024 is a higher cadence of 3-4% .
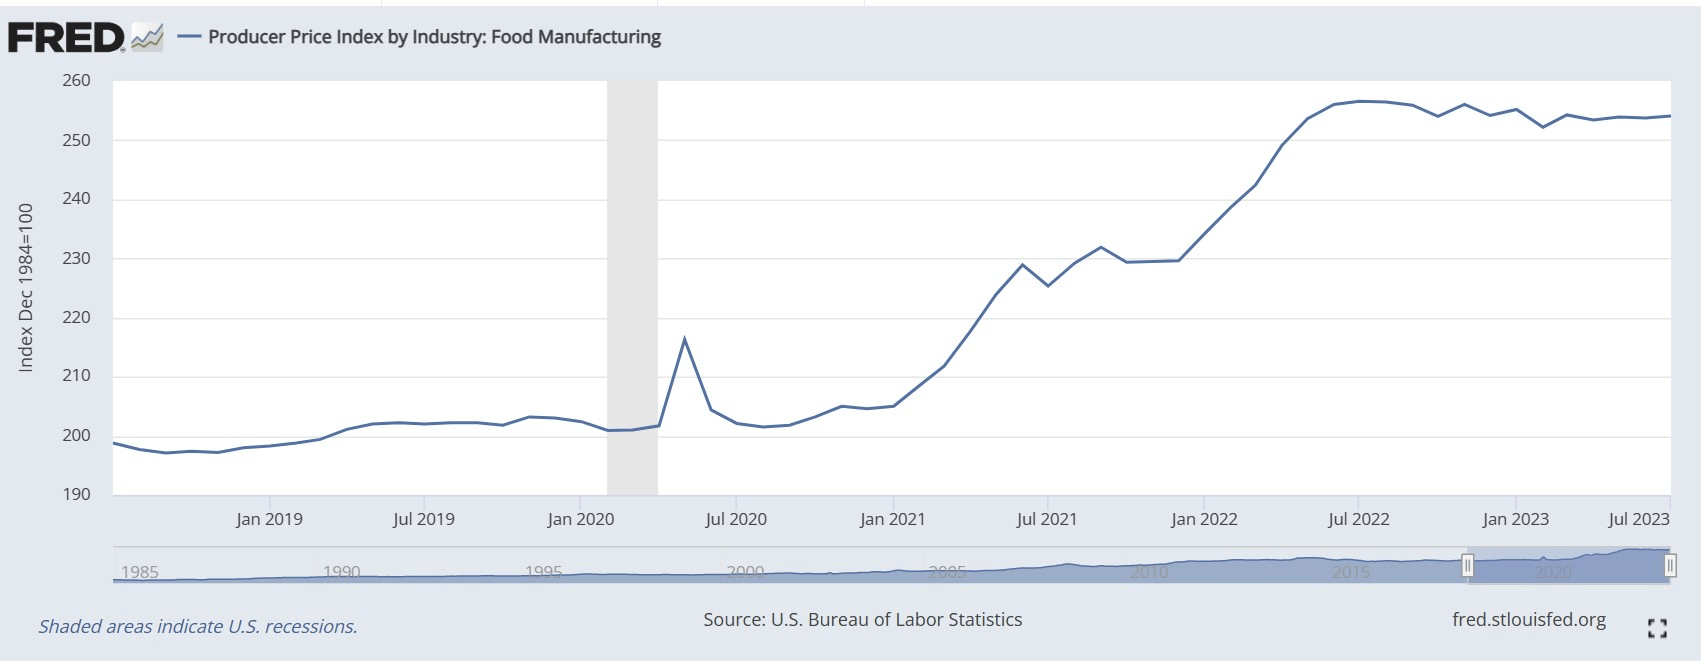
G ross margins last year finished rather strongly at 34.2%, a 120bps improvement over the previous year, yet management feels that they can continue to build on this for the coming year as well. Productivity levels in the Pet segment are in a better place, and some of the pricing measures taken across the overall business last year will also be felt this year. Data from FRED shows that the PPI for food manufacturers hasn’t really come off in a big way but continues to stabilize, reflecting the degree of pricing strength.
Crucially, supply chain disruptions of the past are unlikely to leave a bulky effect on GIS’s cost base. All these factors put the company in a better space to get back to delivering 4% HMM (Holistic Margin Management) cost savings at the COGS level.
Q4 Presentation
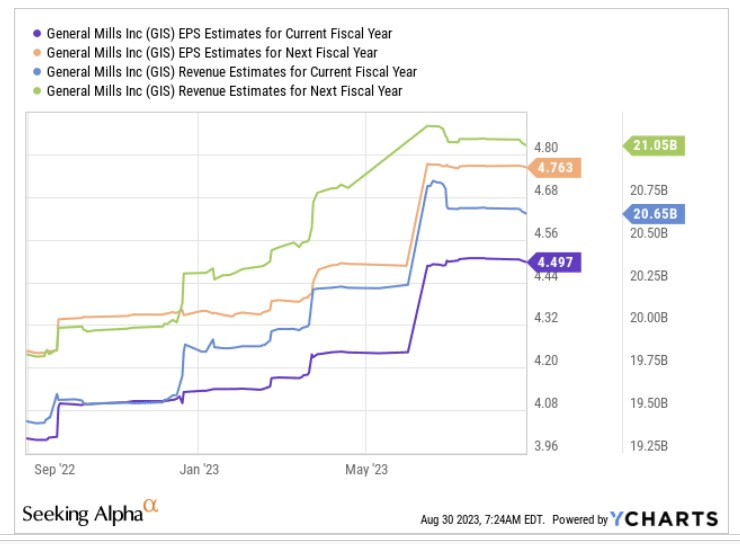
All in all, if one looks at consensus estimates for GIS over the next two years, we feel rather enthused by the improving operating leverage that is in store. For the year ending May 2024, GIS’s YoY EPS growth (3.1%) is poised to exceed net sales growth (not organic growth) by 30bps, and the following year, the differential between the top and bottom line will widen even more to 400bps, with GIS poised to deliver YoY EPS growth of nearly 6%!
YCharts
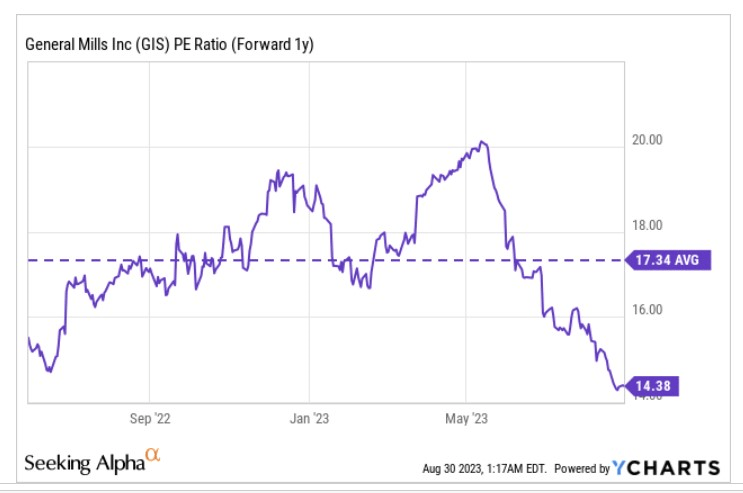
Given the improving degree of operating leverage that could be seen over the next two years, we feel it is a good opportunity to pick up the stock on the cheap. Based on the May 2025 EPS estimate, the stock is priced at only 14.4x forward P/E, a 17% discount to its 5-year average multiple.
Cash Generation And Dividend
A potentially better bottom line trajectory also puts GIS in a better place to engender superior cash generation. The company's long-term goal is to convert 95% of its adjusted post-tax earnings to free cash flow. Last year, however, they fell quite short of this mark, delivering a conversion rate of only 80%.
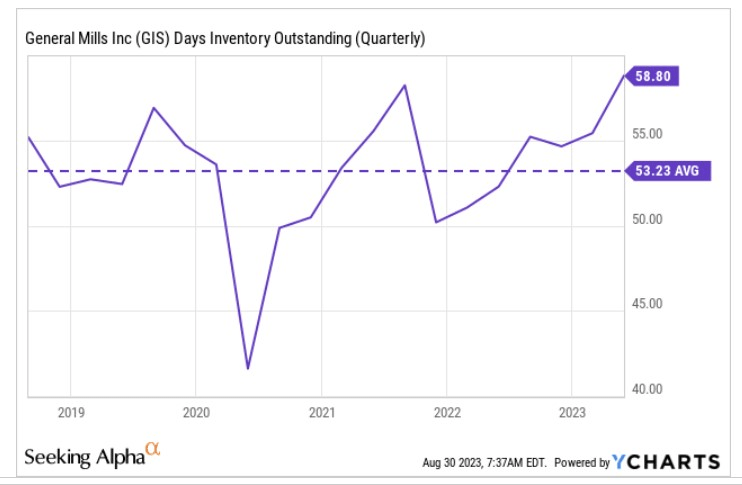
For the coming year, management is on record stating that the FCF conversion will likely trend back to its long-term goal of 95%, driven mainly by better supply chain visibility which in turn facilitates better inventory management. As you can see from the image below, the days in inventory is currently 10% above what they normally maintain and it should drop down in the quarters ahead.
Some investors may be wary of the retailer inventory reduction challenges witnessed in the North American region, but on the Q4 call, management was quick to point out that this is issue is not specific to GIS alone and is unlikely to linger going forward.
Nonetheless, better FCF generation also increases the prospect of superior distributions, as GIS’s goal is to return 80-90% of its FCF to shareholders. Just for some perspective, also consider that this is a business whose dividend growth has been trending up over time; most recently in July, the company hiked its dividend by an impressive 9%, up from 6% previously. On account of the superior hike, investors also get to pocket a more attractive yield (3.45%), around 30bps higher than the stock’s 4-year average yield figure.
Seeking Alpha
Closing Thoughts: Risk-Reward And Hedging
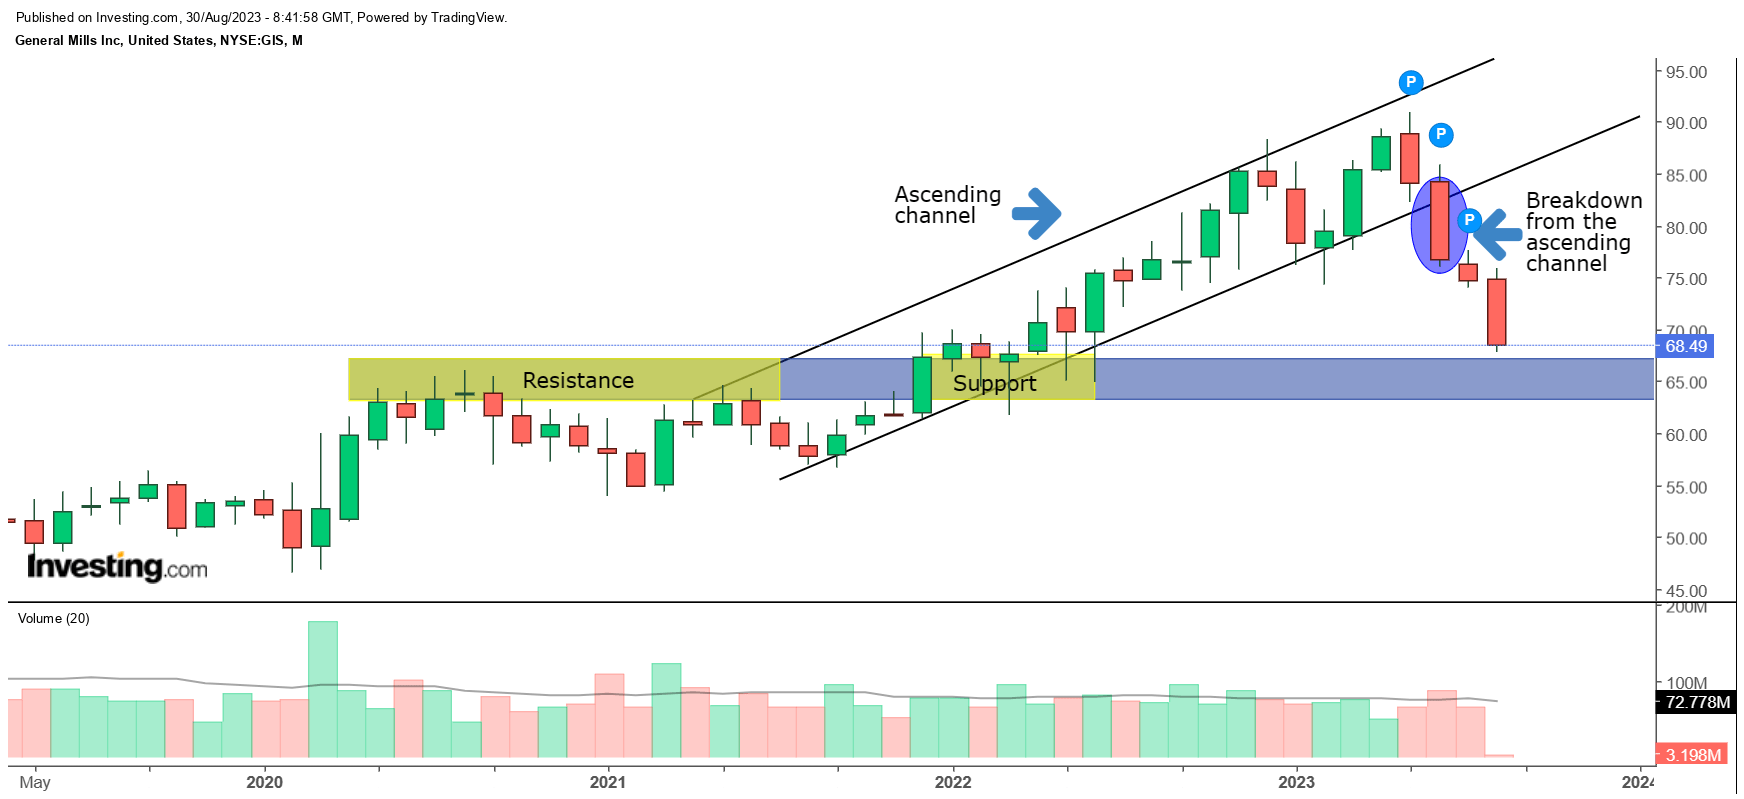
If one looks at GIS’s monthly price imprints, we can see that the stock is currently in a bad way, but there’s potential for this to change soon enough. Firstly, note that from November 2021 till May 2023, the stock had been trending up in the form of a tight ascending channel.
In June, we saw a breakdown from this channel, with the onset of a large red-bodied candle. Since then, the selling has persisted with no signs yet of an end in the downward trend. Unless something monumental happens over the next two days it looks all but certain that August will be the fourth successive month where the monthly close was lower than the monthly open. This gives you a sense of how strong the selling momentum has been.
Having said that we think the stock could be close to hitting a bottom of sorts, as it is not too far away from testing the $63-$67 zone. Why does this zone matter? Well, if you look at the period from May 2020-June 2021, one can see that this terrain served as a point of resistance (area highlighted in yellow); once again in H1-22, we saw the same terrain serve as a source of support, with some long wick candles highlighting the presence of bargain hunters. Basically, the takeaway here is that the price typically recoils from that zone, and thus one wouldn’t be surprised to see this serve as a pivot zone yet again.
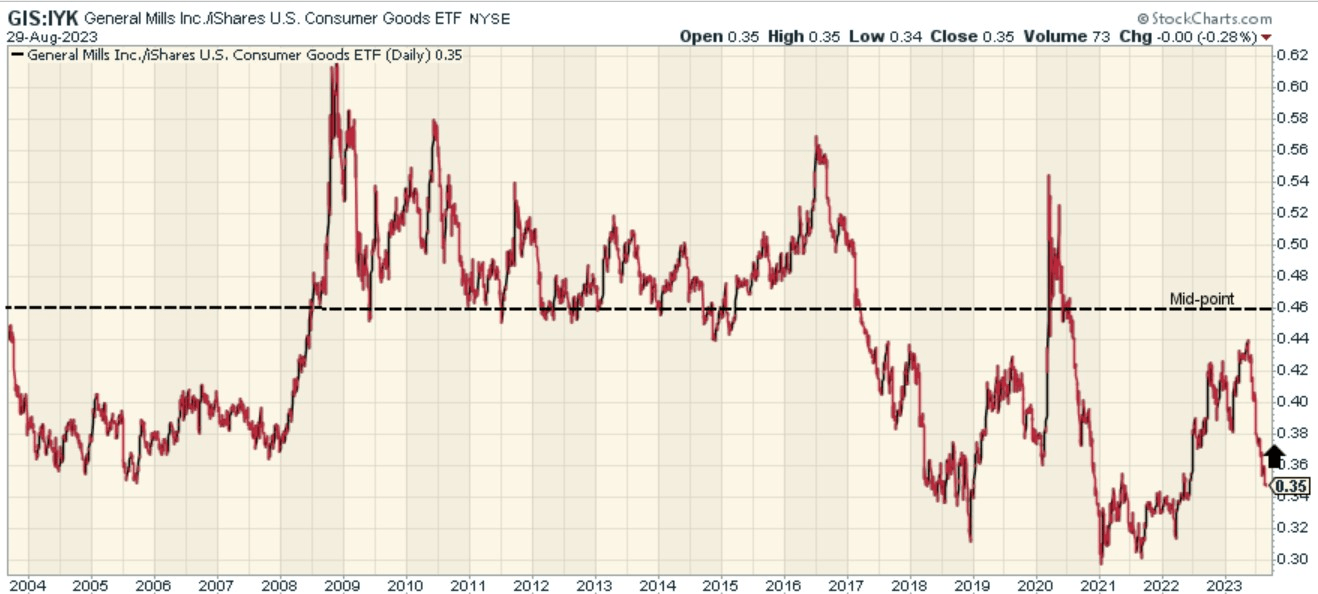
The weakness for much of this year also means that GIS now looks much better positioned to mean-revert vs. other options from the consumer staples universe. The image below highlights how the relative strength ratio of GIS as a function of staple stocks is around ~24% off the mid-point of its long-term range.
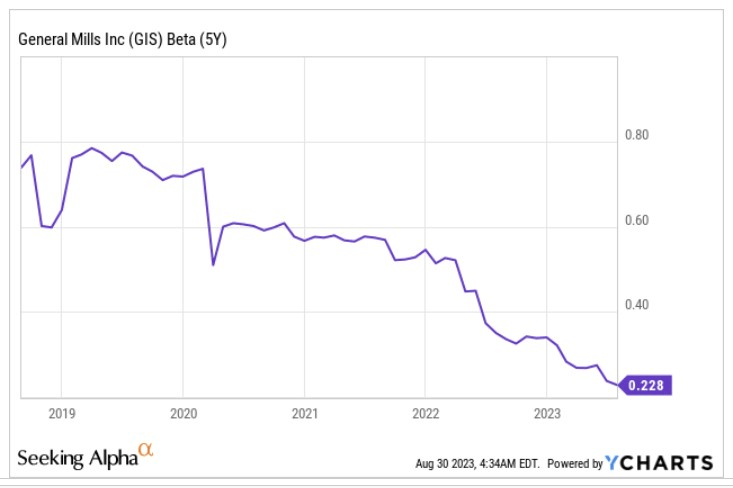
We also think there’s something to be said about GIS’s growing stature as a prospective hedge to the broader markets. The markets have enjoyed a relatively decent 2022 so far (~17% returns), but September has traditionally proven to be the worst month of the year (as per data going back to 1945 ). Recent macro data also suggests that the economy could be close to peaking with the valuations of the broader markets not quite reflecting these risks.
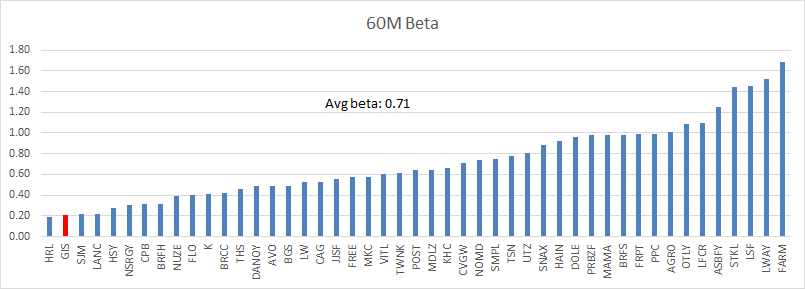
Nonetheless, the image above highlights how the stock’s sensitivity to the broader markets has been declining over time. Also, interestingly enough, amongst the 48 odd packaged food stocks around, GIS’s sensitivity is one of the lowest, making it one of the standout defensive hedges.
For further details see:
General Mills: Things Are Looking Up