TLT - Global Stocks Suffer A December Drop; VT Consolidates In A Bear Flag
Summary
- US stocks, large and small, led markets to the downside to cap off 2022.
- An early-month rally in bonds swiftly faded as rates rose into year-end.
- All eyes will be on the upcoming corporate earnings season, while foreign equities sport compelling valuations.
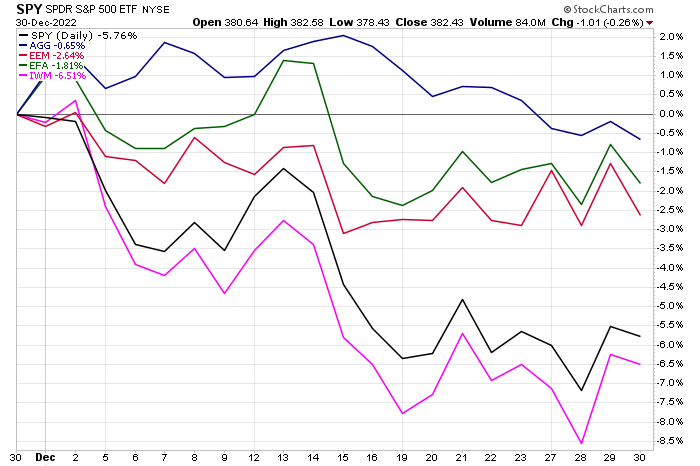
It was not a December to remember for the bulls. The S&P 500 fell nearly 6% to wrap up the worst year on Wall Street since 2008. In small-cap land, the iShares Russell 2000 ETF ( IWM ) underperformed their large-cap peers with a 6.5% decline. The pain was less intense overseas, though, as evidenced by just a 1.8% total return loss in EFA, the major non-US developed markets fund. Emerging markets also managed significant alpha relative to domestic equities – EEM gave back just 2.6%.
In the bond space, it was a bullish first half of the month as interest rates settled lower, but a rather steep rise in yields across the Treasury curve led to about a 2.5% fall in the iShares US Aggregate Bond ETF ( AGG ) over the back half of December. In all, hope has faded for a decent Santa Claus rally – which typically extends through the first two sessions of the new year. More on traders’ minds are recession fears and an uncertain upcoming earnings season which kicks off in less than three weeks when JPMorgan Chase ( JPM ) reports fourth-quarter results on Friday the 13 th.
December Recap: Everything Was Down
The global stock market, as measured by the Vanguard Total World Stock Market ETF ( VT ) dropped an even 18% in 2022. The final month of the year featured a decline of 4.44%, including dividends.
VT: Weak Year, Strong Quarter, Disappointing December
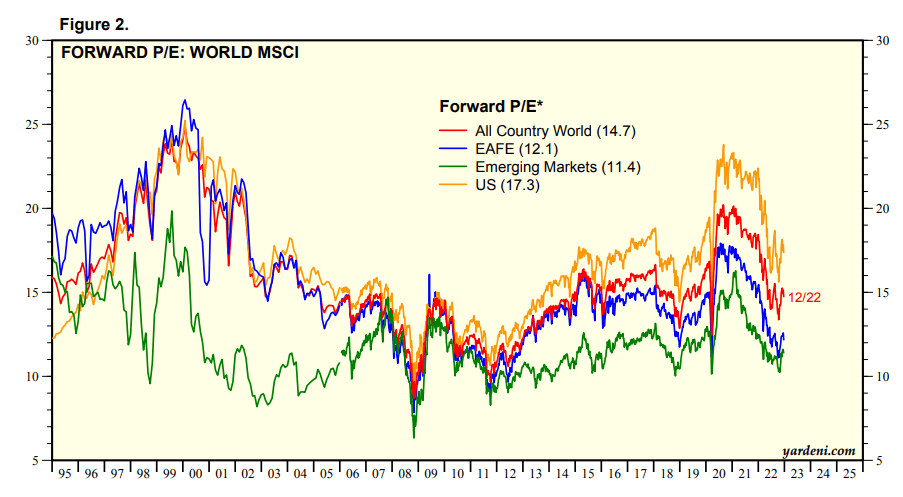
On valuation, the All-Country World Index ( ACWI ) now trades at a somewhat attractive 14.7 forward 12-month operating P/E multiple. Ex-US regions are generally cheap compared to the TMT-dominated US market. I continue to assert that foreign shares sport a solid valuation here. But will the near-term pain continue? We’ll look at the chart for clues later.
Valuation Check: US Stocks Somewhat Expensive, Ex-US Cheap
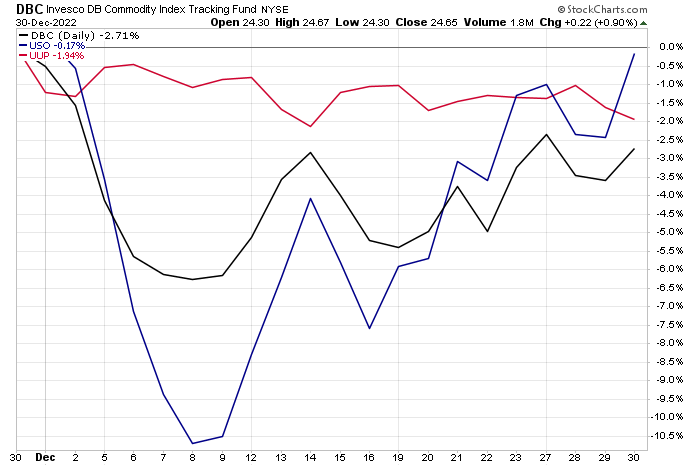
Elsewhere across markets, the US dollar drifted lower over the past several weeks while crude oil staged a significant rally off its December 8 low, helping to lift the Invesco DB Commodity Index Tracking ETF ( DBC ) to wrap up the month near the flat line. Interestingly, RBOB gasoline futures rose big from near $2 at their low to nearly $2.50 by year-end.
Commodities Post A Big Year-End Rally
The Technical Take
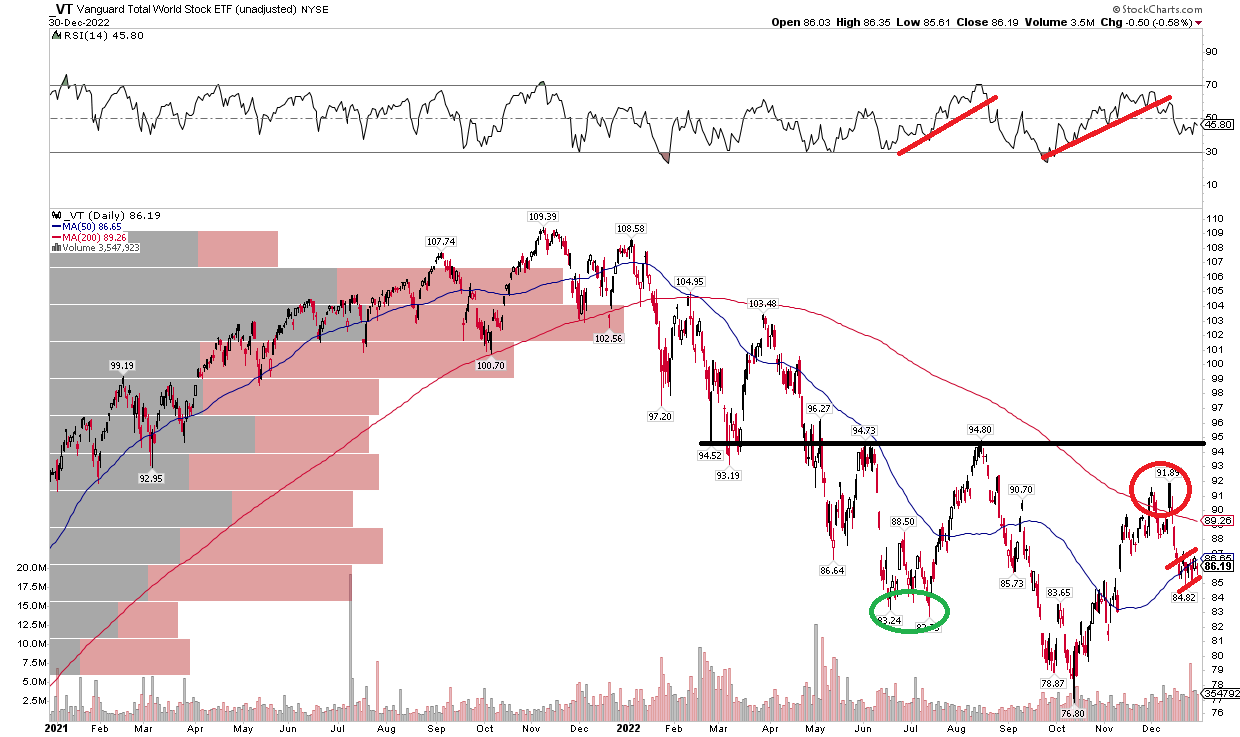
Digging deeper into the outlook for 2023 on the world of stocks, notice in the chart below that VT is at a critical juncture. Recent price action has the hallmarks of a bear flag, but it could also be the right shoulder to a bullish inverse head and shoulders pattern. What plays out in my view? I see the former as being more likely than the latter. Here’s why: The RSI at the top of the chart shows two clear uptrend breaks in momentum that coincided with the end of bear market rallies. Perhaps we must once again reach technical oversold conditions on VT before we can call this latest drop history.
Moreover, VT snuck a peek above its 200-day moving average in early December but then was swiftly taken lower by the bears. It appears more work is needed (to the downside) before global equities can rise again. But be sure to keep your eye on how this bear flag resolves – a move higher, particularly above the 95 level would help support a bullish longer-term thesis. The ultimate target on an inverse head and shoulders would be north of $115. There’s a long way to go, obviously.
VT: Bear Flag Or Right Shoulder?
The Bottom Line
It was a bruising month for the bulls. December started with some cheer, but ultimately a lump of coal was delivered during the second half of the month – normally a bullish stretch. With a fair valuation and a somewhat bearish chart, more downside could be on the horizon in the coming months before the global stock market can regain its footing.
For further details see:
Global Stocks Suffer A December Drop; VT Consolidates In A Bear Flag