XOM - Halliburton And Devon: You May Want To Buckle Up For This Next Part
2023-05-09 10:38:07 ET
Summary
- We have been patiently waiting for this pullback/consolidation period in the energy sector to complete.
- What happens over the next few weeks is highly variable but the bigger picture clearly projects higher prices.
- A swing trading setup also is provided in our new feature specifically designed for shorter time frames.
By Levi at StockWaves , produced with Avi Gilburt
Forbearance. Tolerance. Restraint. Call it what you like, but patience, even by any other word, is not easy. It was nearly a year ago now that we began to warn our members of an impending pullback/consolidation period across the energy sector.
And, here we are, now in the neighborhood of 12 months lapsed that most energy stocks have been resting after a monster rally run up from the October 2020 lows. They now appear to be readying for the next leg of the race.
Let’s take a look at the fundamental framework of the entire sector with specialist and analyst extraordinaire, Lyn Alden . (We discussed this as well in our prior piece focused on Apache ( APA ), Pioneer ( PXD ) and ConocoPhillips ( COP ). Th is is a continuation of that analysis.)
Energy Sector Summary With Lyn Alden
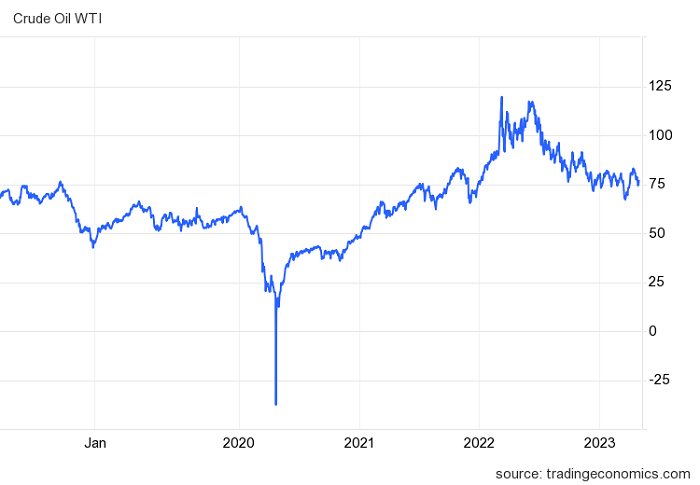
The prospects for energy stocks remain unclear for the next six months as the United States works through its current liquidity problem and potential 2H 2023 recession.
In the meantime, oil prices have been finding a consolidation range above $70/barrel. We could see further sharp illiquid spikes below that level like we did in March, especially during a recession, but overall with the Strategic Petroleum Reserve already drawn down to multi-decade lows and OPEC+ willing to cut production to defend this price level, it’s a decent risk/reward to assume that prices will pop back up over $70 within a reasonable timeframe if they temporarily go under that level like they did in March.
Overall, most energy stocks never became particularly expensive even when oil was $120 in 2022, and thus have held up well even as oil has corrected back to sub-$80. Even at these middling oil price levels, many large-cap oil producers make good money and trade at low valuations, which makes them able to pay high dividend yields, buy back a lot of shares, and strengthen their balance sheets.
There hasn’t been much of a capex spree or M&A spree in this oil cycle yet, which continues to suggest it’s still in its early innings. There isn’t a lot of new supply coming online on the observable capex horizon, even as the spread between supply and demand remains rather tight. Higher interest rates also increase the development cost for new production, and so while they can rein in demand to varying degrees, they also rein in new supply.
Oil and Gas Supermajors: Cash Rich
Many oil companies made harmful acquisitions at the top of the prior energy cycle. They bought when prices were high, and when those prices collapsed, they had to write down massive losses on those acquisitions. As a result, many of them are being picky with acquisitions and new drilling at this time, and instead are focusing on maintaining steady-state production and returning a lot of capital to shareholders.
Some of the supermajors like Exxon Mobil ( XOM ) have lower borrowing costs than Canadian Natural Resources ( CNQ ), and have been using almost a bank-like strategy. The yield on Exxon’s $37 billion worth of long-term debt is around 3%, which is lower than what T-bills and similar cash equivalents earn these days. Exxon has more than $29 billion in cash equivalents, and due to higher yields they might actually be earning more total income on that cash than they are paying in total interest on their debt, or roughly so.
Smaller Oil and Gas Producers: Acquisition Targets
Compared to large producers, smaller energy companies provide more upside potential, but have a lot more insolvency and/or dilution risk during bear markets. I’m willing to hold large and diversified energy companies through bear markets for tax-efficient long-term compounding, but to the extent that I trade around smaller companies, I want to protect my downside a bit more and focus on up-cycles.
This sector seems to remain under appreciated across the board:
- Large oil and gas producers with low decline rates likewise are inexpensive cash cows in this environment, even with $70 oil in many cases. Their balance sheets are generally great, and they're roughly maintaining production levels while sending a lot of capital back to shareholders. Some have expanded production more than others, but as an industry they’ve been using a conservative strategy overall.
- Small producers are generally very cheap relative to reserves at this time and represent attractive acquisition targets, but have more volatility and insolvency risk during periods of lower oil and gas prices.
- The pipeline companies that issue K-1 forms during tax season, like Enterprise Products Partners ( EPD ), remain historically cheap, high-yielding, and with above-average distribution coverage ratios. Rather than constantly issuing equity like they used to, some of them are even buying back units.
Apart from the oil price, a key risk for these companies continues to be windfall taxes and other external interventions. Oil company stocks have generally been rangebound for a decade or two, meaning they massively underperformed other stocks. Now that they're experiencing their current windfall, many of them are under pressure by politicians. Rather than rush into acquisitions or rapid drilling like they did in the prior cycle, oil and gas producers are generally being a lot more conservative, which will likely continue to be the case until oil prices become elevated for longer periods of time.
Lyn provides our members with invaluable insights, diving deep into the fundamentals of the landscape we find ourselves at any given moment and then projecting a likely path forward. We have found many charts in the energy sector that are strongly agreeing with Lyn’s assessments.
The Fibonacci Princess Proclamation
This is a new feature in our articles to the readership. Tammy Marshall, who we affectionately know as the "Fibonacci Princess," will make proclamations from time to time. Those that are familiar with Carolyn Boroden’s methodology will quickly recognize Tammy’s work and its value, especially to swing traders.
(Please see the prior article here introducing the effort and providing more details.)
Onward with the proclamation!
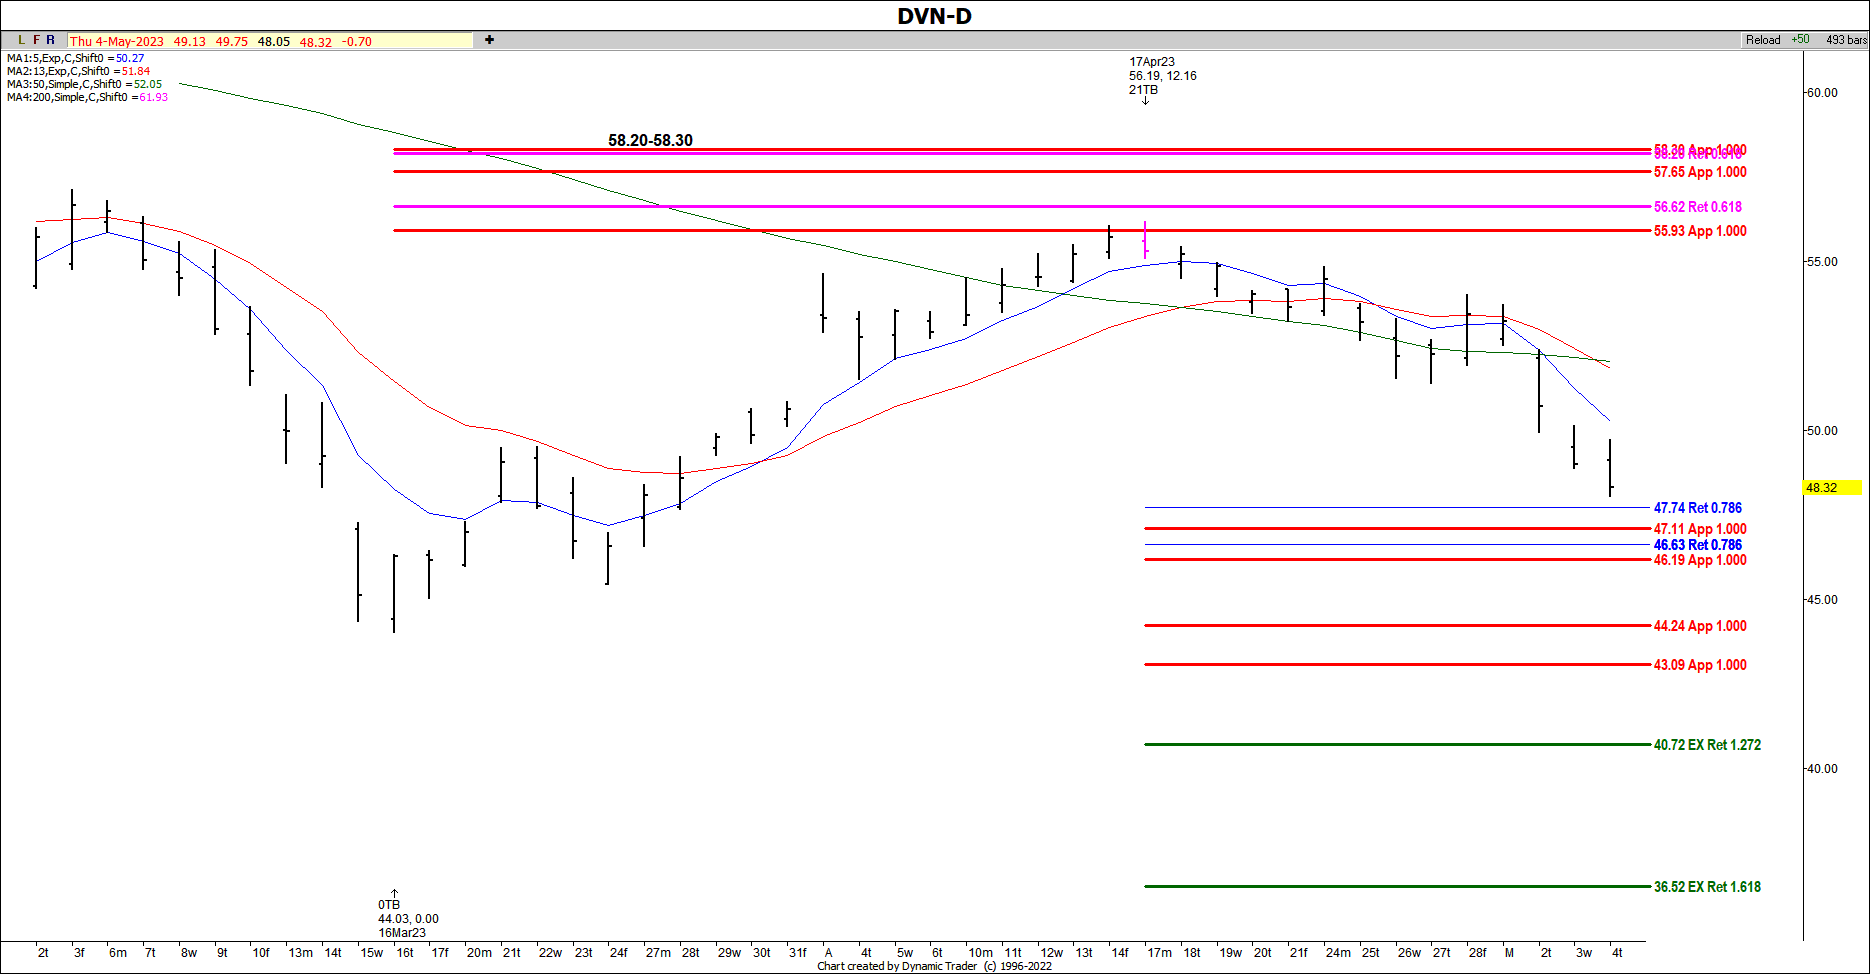
Devon ( DVN ) has all of the moving averages on the side of the bears (below the 5SMA, 13SMA, 50EMA and 200EMA) and it’s broken the bullish symmetry of this last swing up. I’ve made some symmetrical projections to help define risk if you want to get bullish (symmetry is at the red 1.000 lines). However, we are currently failing off of the zone of resistance 55.93-56.62 and could potentially take out the low from March 16 and reach the targets off resistance of 40.72 and 36.52.
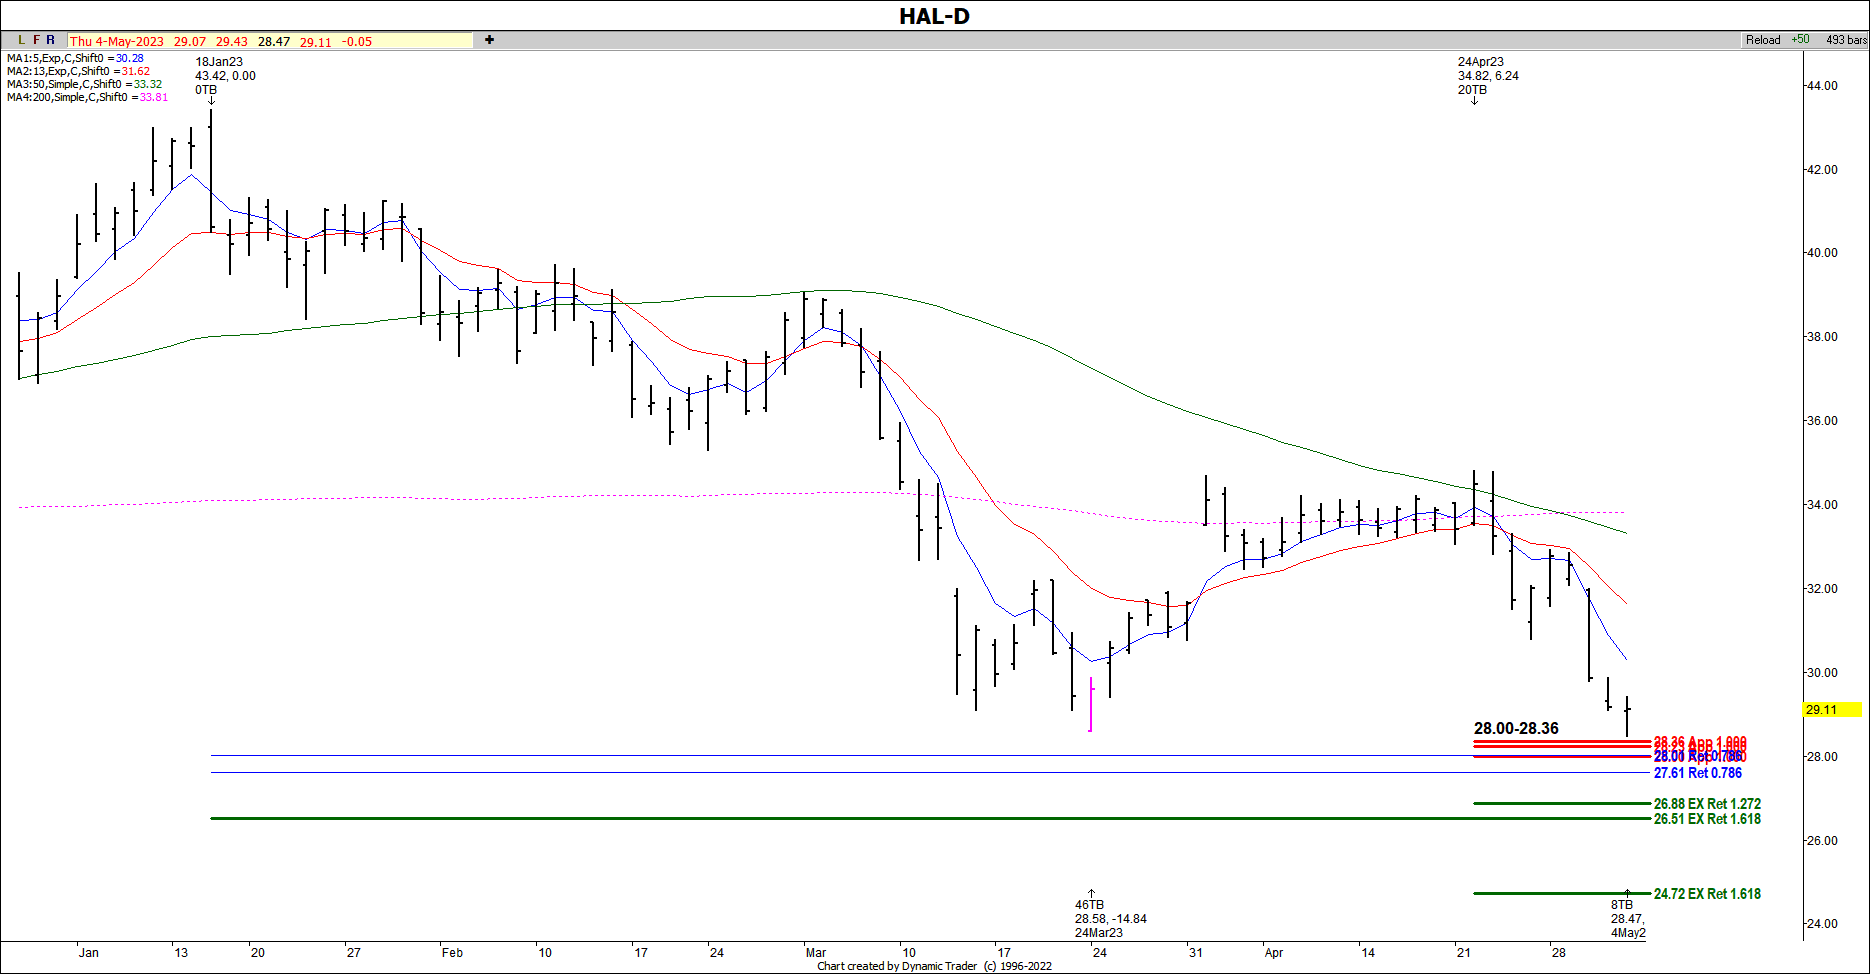
Halliburton ( HAL ) has all of the moving averages on the side of the bears also. We’ve taken out the Ma rch 24 low, but haven’t had a big enough bounce to recalculate new resistance. I have a zone of risk if you’d like to get bullish 28.00-28.36, but please be aware that this is countertrend and you need to place a stop underneath the zone.
The Bigger Technical Picture
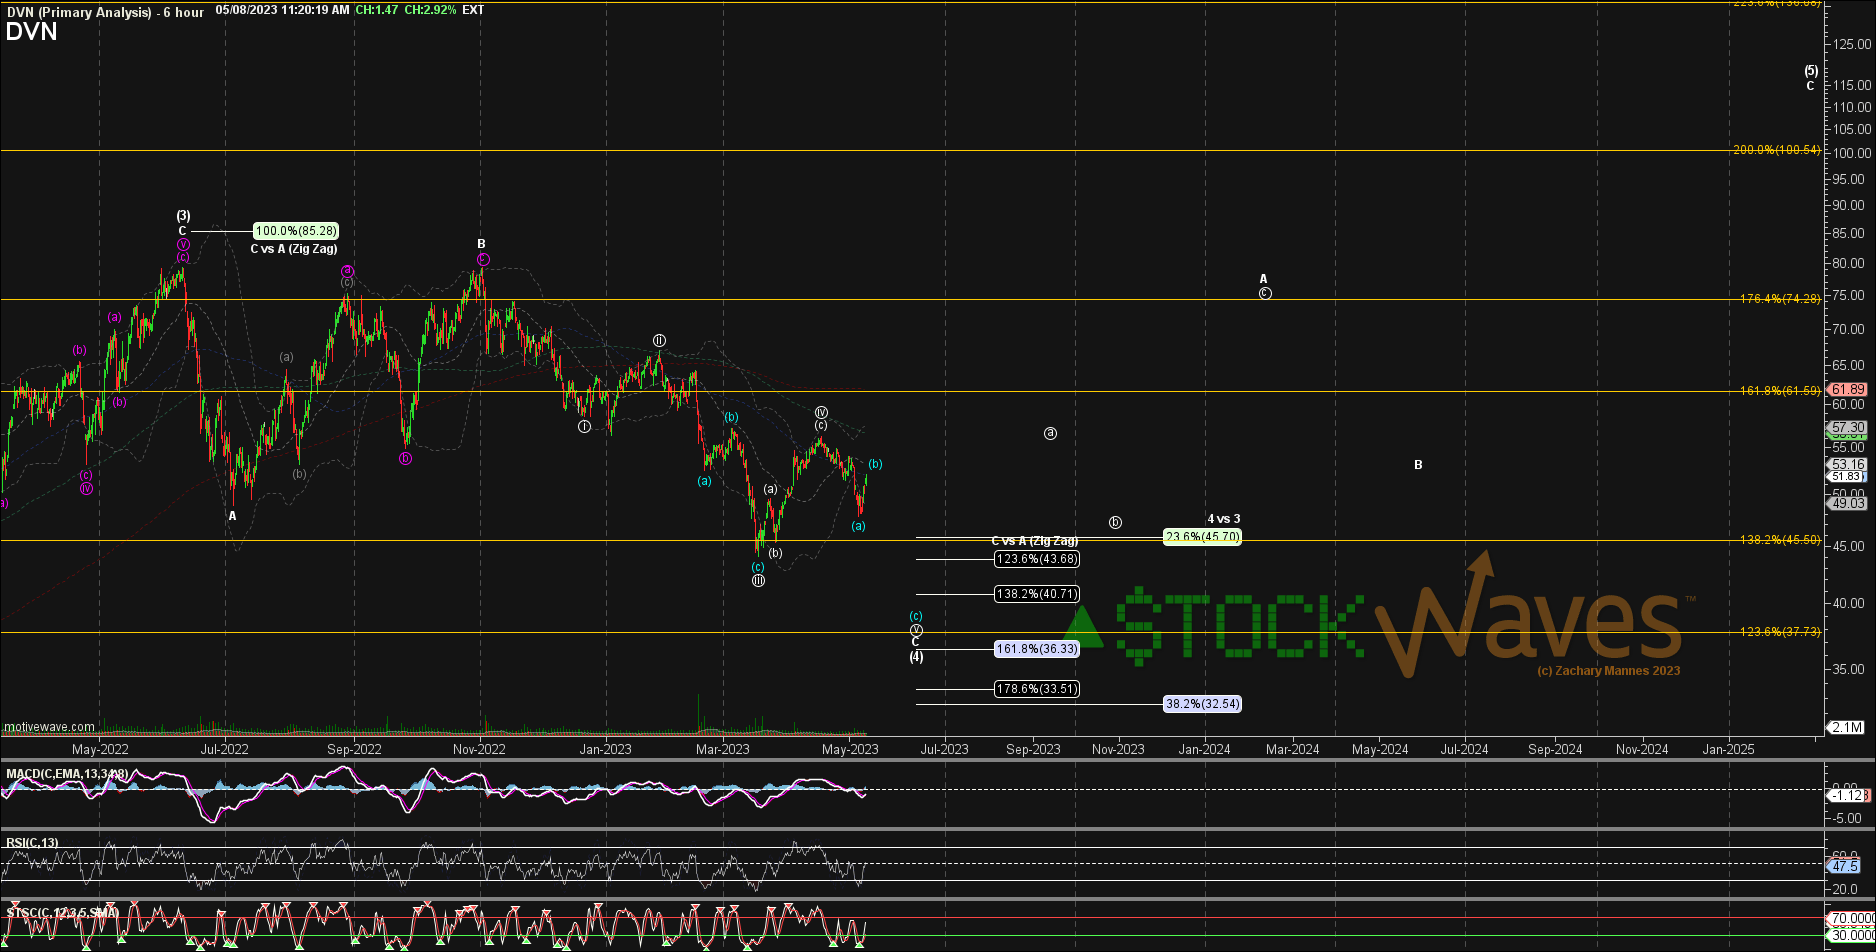
Did you note Tammy’s comment, "DVN has all of the moving averages on the side of the bears?" This dovetails nicely with what we have been tracing out for our members in StockWaves over the last several months.
For some time now we have been projecting lower for DVN. It's anticipated to potentially strike a new swing low in price just under the $44 level struck in March. This low, perhaps in the $40 area, should complete the entire correction, this being wave C of [4], as you can see on Zac’s chart above.
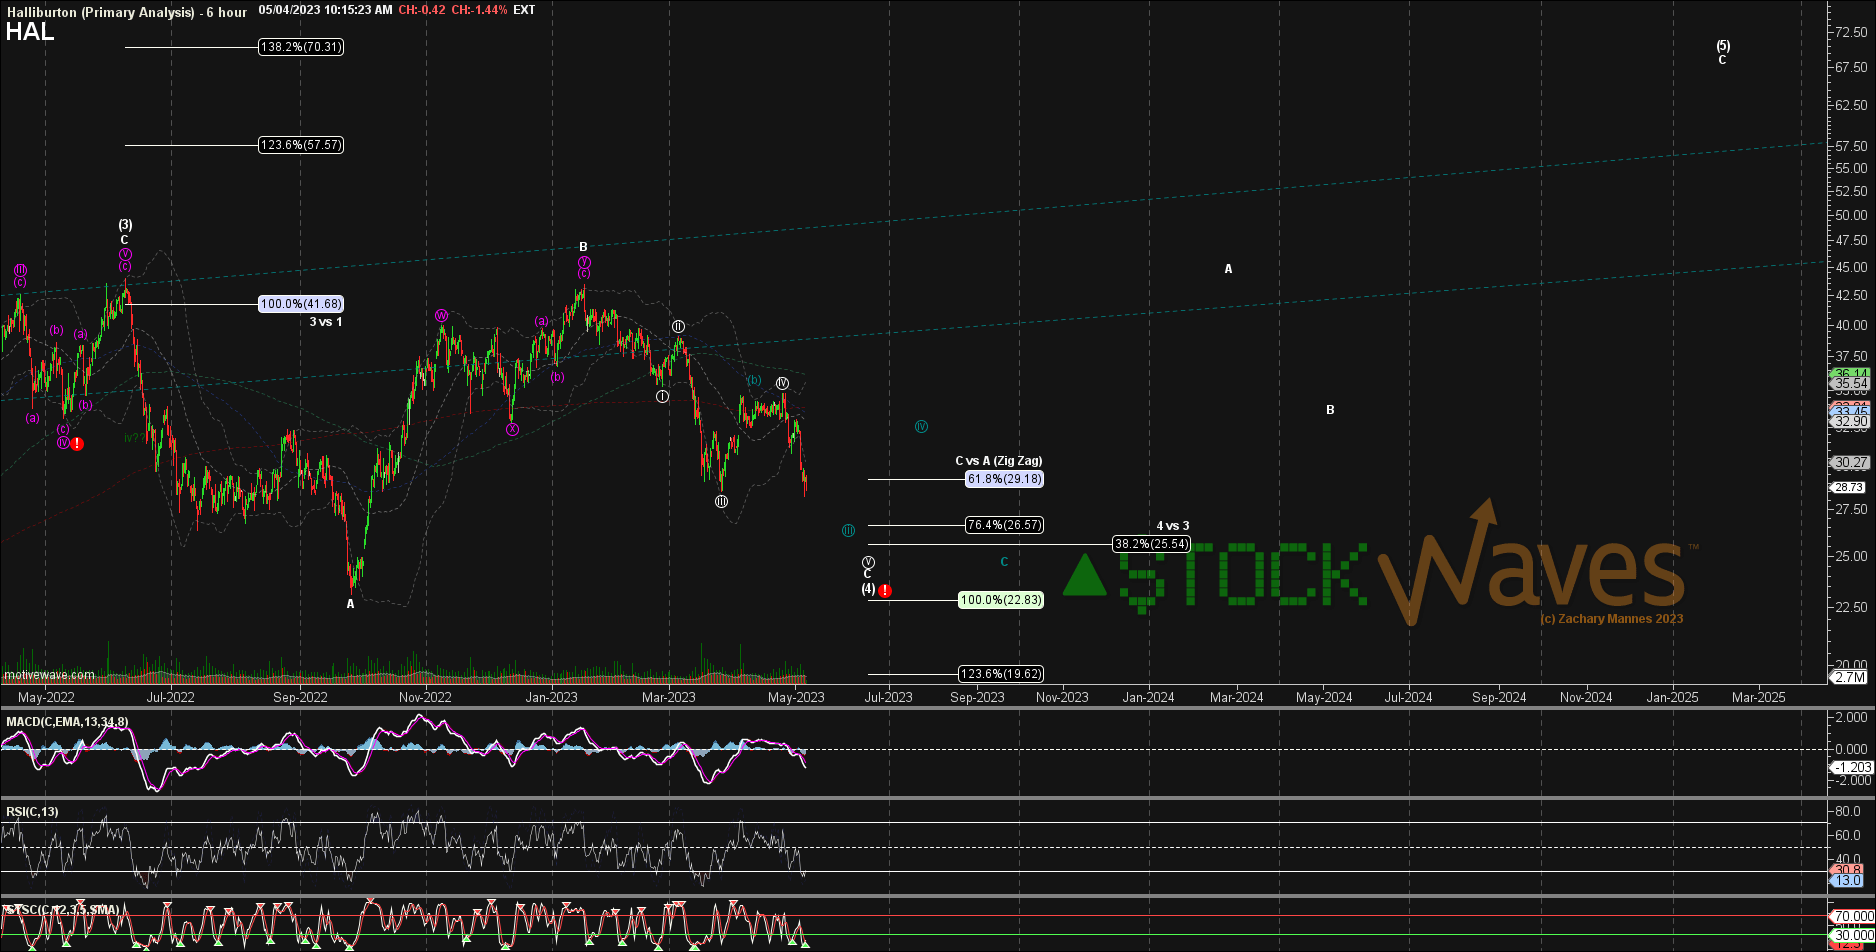
HAL can find the completion of its C of [4] anywhere under the $28 level. There is some confluence of price projections in the $25-$26 region and then in the $22-$23 area.
Both of these names are very near to finishing up their respective year-long corrective patterns. Looking at the right side of the charts you can see where wave [5] projects to and the risk vs reward for those with a six- to 12-month horizon.
Risks
Should DVN break below $32 and HAL below $20 then something else may be afoot here. Also, it’s plausible to see some sort of truncated low in these names. Truncations are not common and they're only recognized after the fact by taking out key resistance levels overhead.
Conclusion
These are just two of the names that we're following in the energy sector. Note the upside potential in each chart based on the larger structure of price. Whether they start the next move up from current levels or just a bit lower, they would seem to represent some of the best risk vs reward setups that we are able to identify at the moment.
I would like to take this opportunity to remind you that we provide our perspective by ranking probabilistic market movements based upon the structure of the market price action. And if we maintain a certain primary perspective as to how the market will move next, and the market breaks that pattern, it clearly tells us that we were wrong in our initial assessment. But here's the most important part of the analysis: We also provide you with an alternative perspective at the same time we provide you with our primary expectation, and let you know when to adopt that alternative perspective before it happens.
There are many ways to analyze and track stocks and the market they form. Some are more consistent than others. For us, this method has proved the most reliable and keeps us on the right side of the trade much more often than not. Nothing is perfect in this world, but for those looking to open their eyes to a new universe of trading and investing, why not consider studying this further? It may just be one of the most illuminating projects you undertake.
For further details see:
Halliburton And Devon: You May Want To Buckle Up For This Next Part