BKR - Halliburton And Schlumberger: Solid Players In Oilfield Services
2023-06-12 10:33:58 ET
Summary
- Halliburton Company posted $5.677 billion in revenue for the first quarter of 2023.
- Both Halliburton and Schlumberger Limited generated significant returns in 2022. However, both stocks dropped since their peak in January 2023. However, Halliburton is lagging significantly.
- I recommend buying Halliburton between $27 and $28, with lower support possible at $26.
Introduction
In the oilfield equipment and services for the oil & gas industry worldwide, two leading players come to mind first and foremost. Halliburton Company ( HAL ) and Schlumberger Limited ( SLB ).
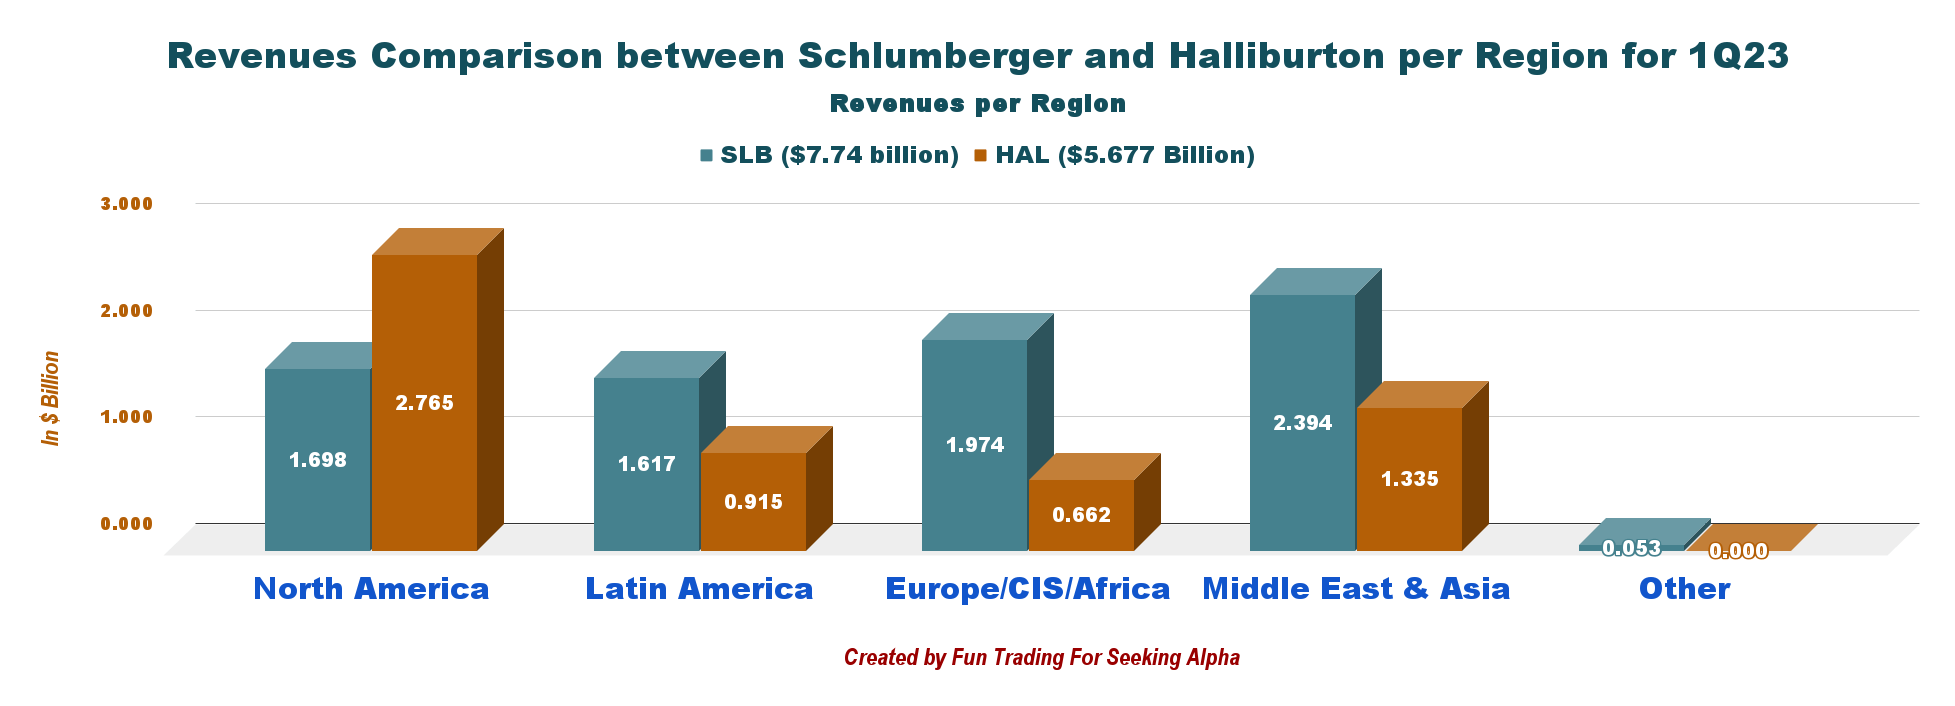
One significant contrast between them is their "business regional focus." One is mainly North American business-oriented, HAL, and the other is more widespread, SLB. We can see it clearly in the chart below when we analyze the revenues per region:
HAL Comparison Revenue per segment SLB versus HAL 1Q23 (Fun Trading)
Schlumberger generated 36.3% more revenue than Halliburton in the first quarter of 2023. As we can see, Halliburton generated $2.765 billion in revenue from North America, or 48.7% of its total revenue in 1Q23, versus 21.9% for Schlumberger.
Note: I strongly recommend reading my article on Schlumberger, published on May 29, 2023.
Both companies generated significant returns in 2022. However, both stocks have dropped significantly since their peaks in January 2023. HAL is down 20% over this period, while SLB is up only 0.6%.
CEO Jeff Miller said in the conference call:
Halliburton's performance in the first quarter again demonstrated the earnings power of our strategy, strong competitive position and execution for our customers. Here are some highlights from the first quarter. Total company revenue increased 33% compared to the first quarter of 2022 with strong activity in both North America and international markets. Operating income grew 91% year-over-year.
Q1 2023 Balance Sheet Comparison: HAL versus SLB
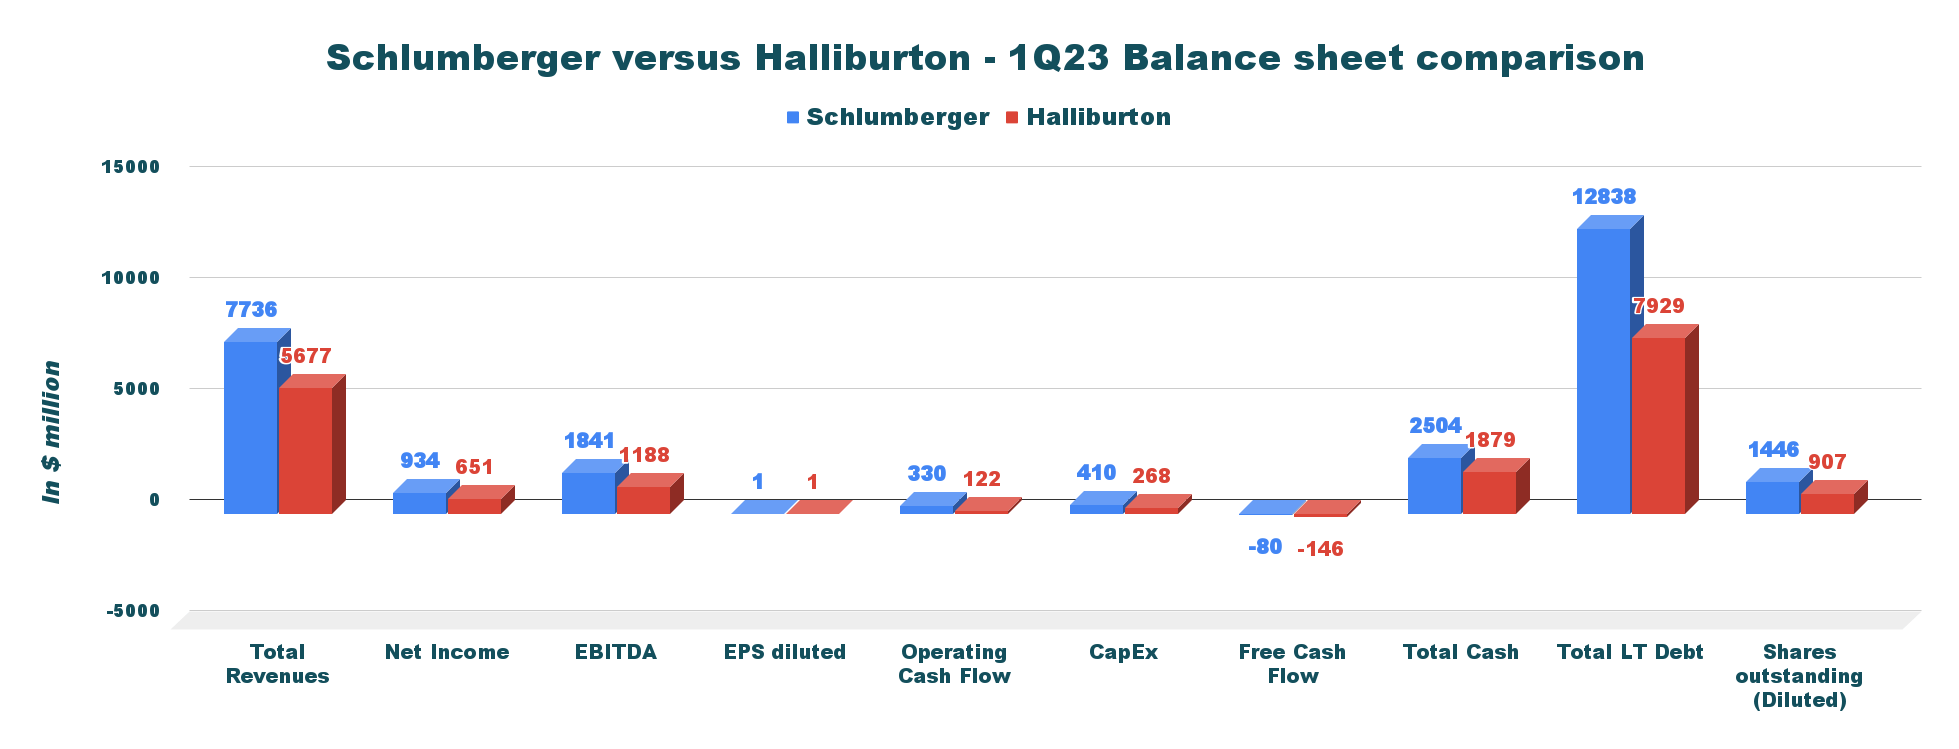
The chart below is a thorough comparison between Halliburton and Schlumberger. Most of the metrics slightly favor Schlumberger versus Halliburton.
EBITDA per diluted share shows $4.33 for HAL and $4.46 for SLB, and the trailing 12-month free cash flow is $1,324 million or $1.46 per diluted share for HAL versus $2,545 million or $1.48 for SLB.
Conversely, Halliburton has a better debt profile than SLB, with net debt of $6.05 billion in 1Q23 versus $10.33 billion for SLB. It is $6.67 per diluted share for HAL versus $7.14 for SLB.
The dividend yield is very similar and is around 2% .
HAL Balance Sheet Comparison SLB versus HAL 1Q23 (Fun Trading)
Halliburton: Financials History - The Raw Numbers until First Quarter 2023
| Halliburton |
| 1Q22 |
| 2Q22 |
| 3Q22 |
| 4Q22 |
| 1Q23 |
| Total Revenues in $ Billion |
| 4.28 |
| 5.07 |
| 5.36 |
| 5.58 |
| 5.68 |
| Net income in $ Million |
| 263 |
| 109 |
| 544 |
| 656 |
| 651 |
| EBITDA $ Million |
| 671 |
| 594 |
| 1,063 |
| 1,078 |
| 1,188 |
| EPS diluted in $/share |
| 0.29 |
| 0.12 |
| 0.60 |
| 0.72 |
| 0.72 |
| Operating Cash Flow in $ Million |
| -50 |
| 376 |
| 753 |
| 1,163 |
| 122 |
| CapEx in $ Million |
| 189 |
| 221 |
| 251 |
| 350 |
| 268 |
| Free Cash Flow in $ Million |
| -239 |
| 155 |
| 502 |
| 813 |
| -146 |
| Total cash $ Billion |
| 2.15 |
| 2.23 |
| 1.98 |
| 2.35 |
| 1.88 |
| Total LT Debt in $ billion |
| 8.53 |
| 8.53 |
| 7.93 |
| 7.93 |
| 7.93 |
| Dividend per share in $ |
| 0.12 |
| 0.12 |
| 0.12 |
| 0.16 |
| 0.16 |
| Shares Outstanding (Diluted) in Million |
| 903 |
| 909 |
| 910 |
| 911 |
| 907 |
Source: HAL filings.
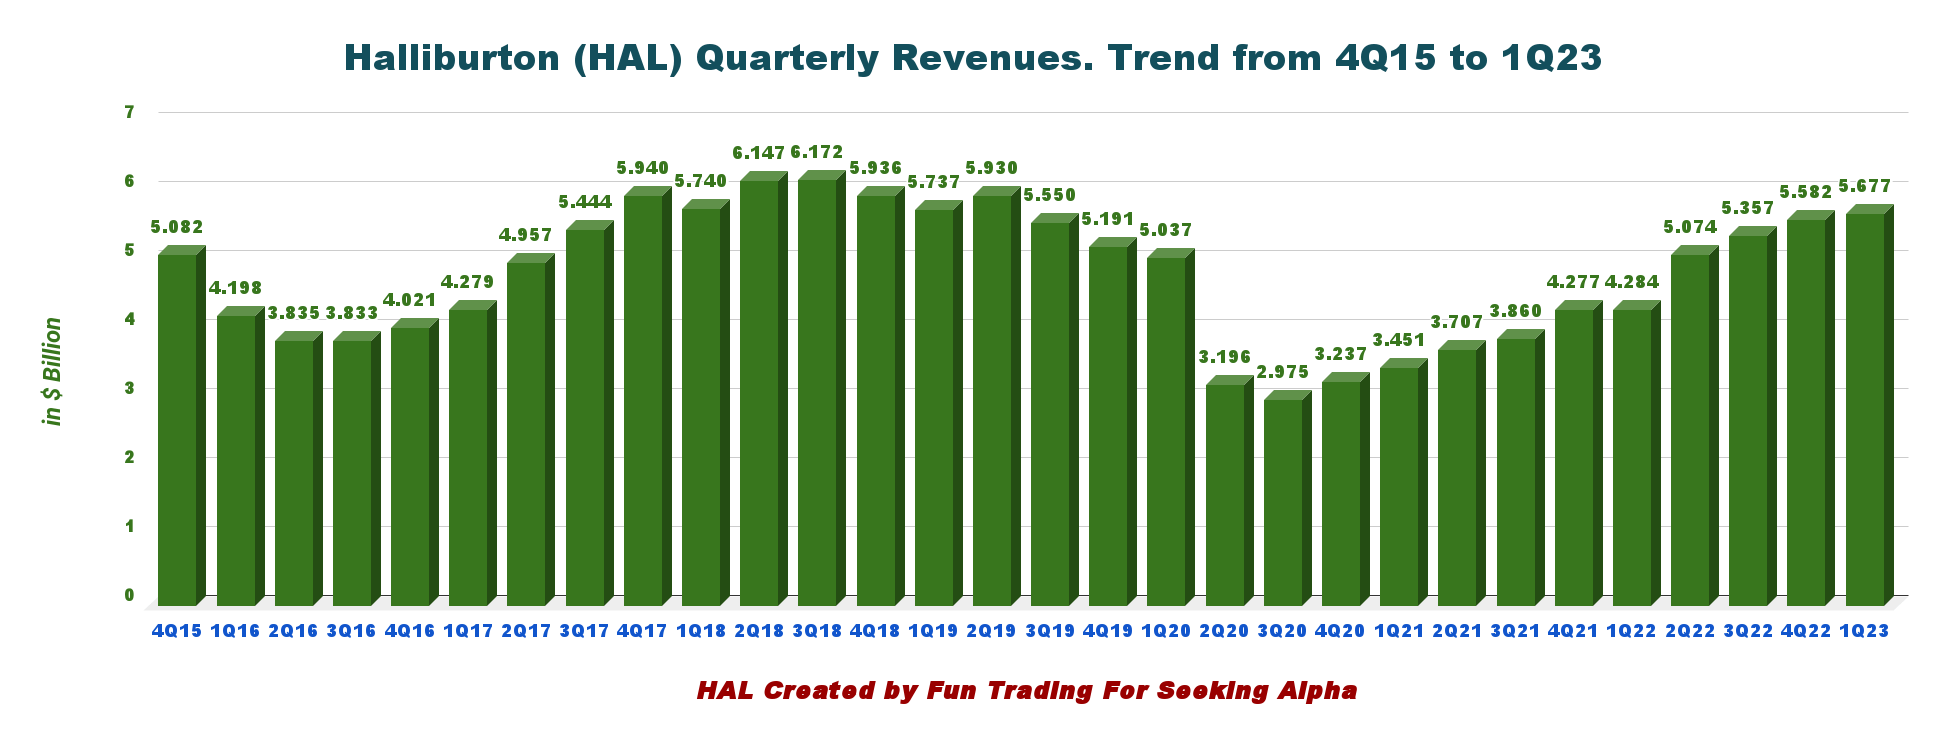
1 - Revenues of $5.677 billion in 1Q23
HAL Quarterly Revenue History (Fun Trading)
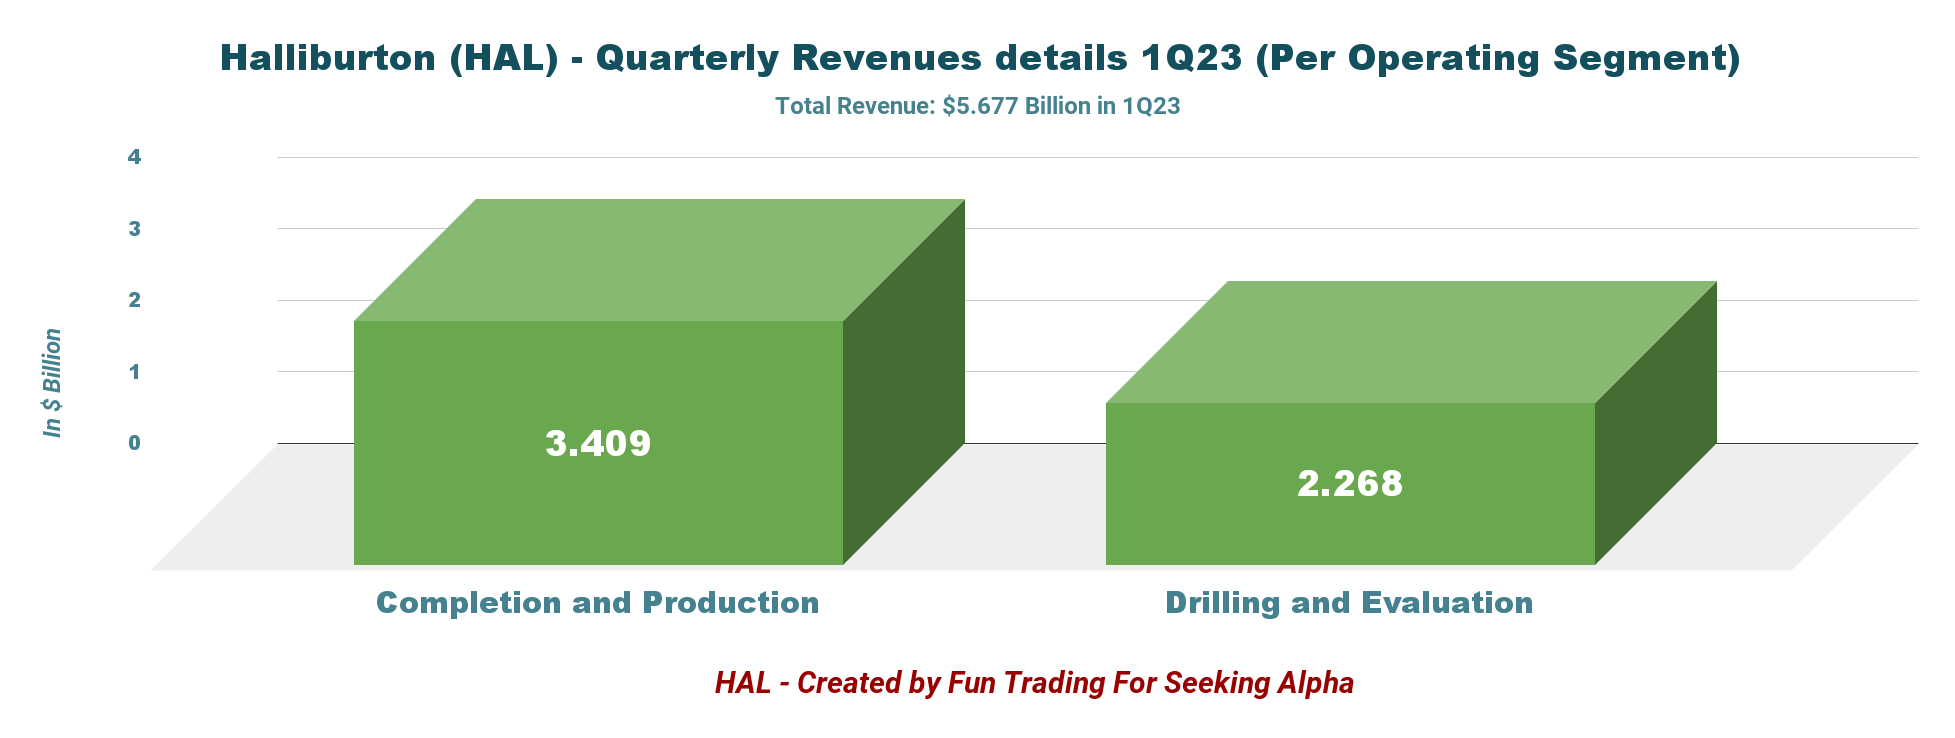
Halliburton posted $5.677 billion in revenue for the first quarter of 2023,
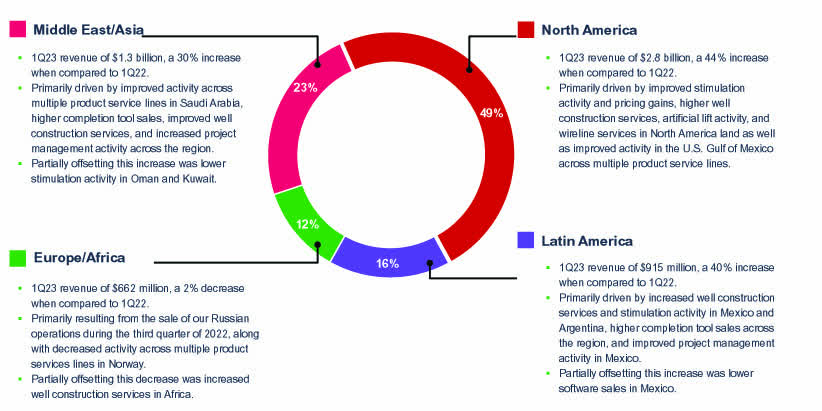
The North American revenue was $2.765 billion (44% increase from 1Q22), and income from Halliburton's international was $2.912 billion.
The company posted a net income of $651 million, or $0.72 per diluted share.
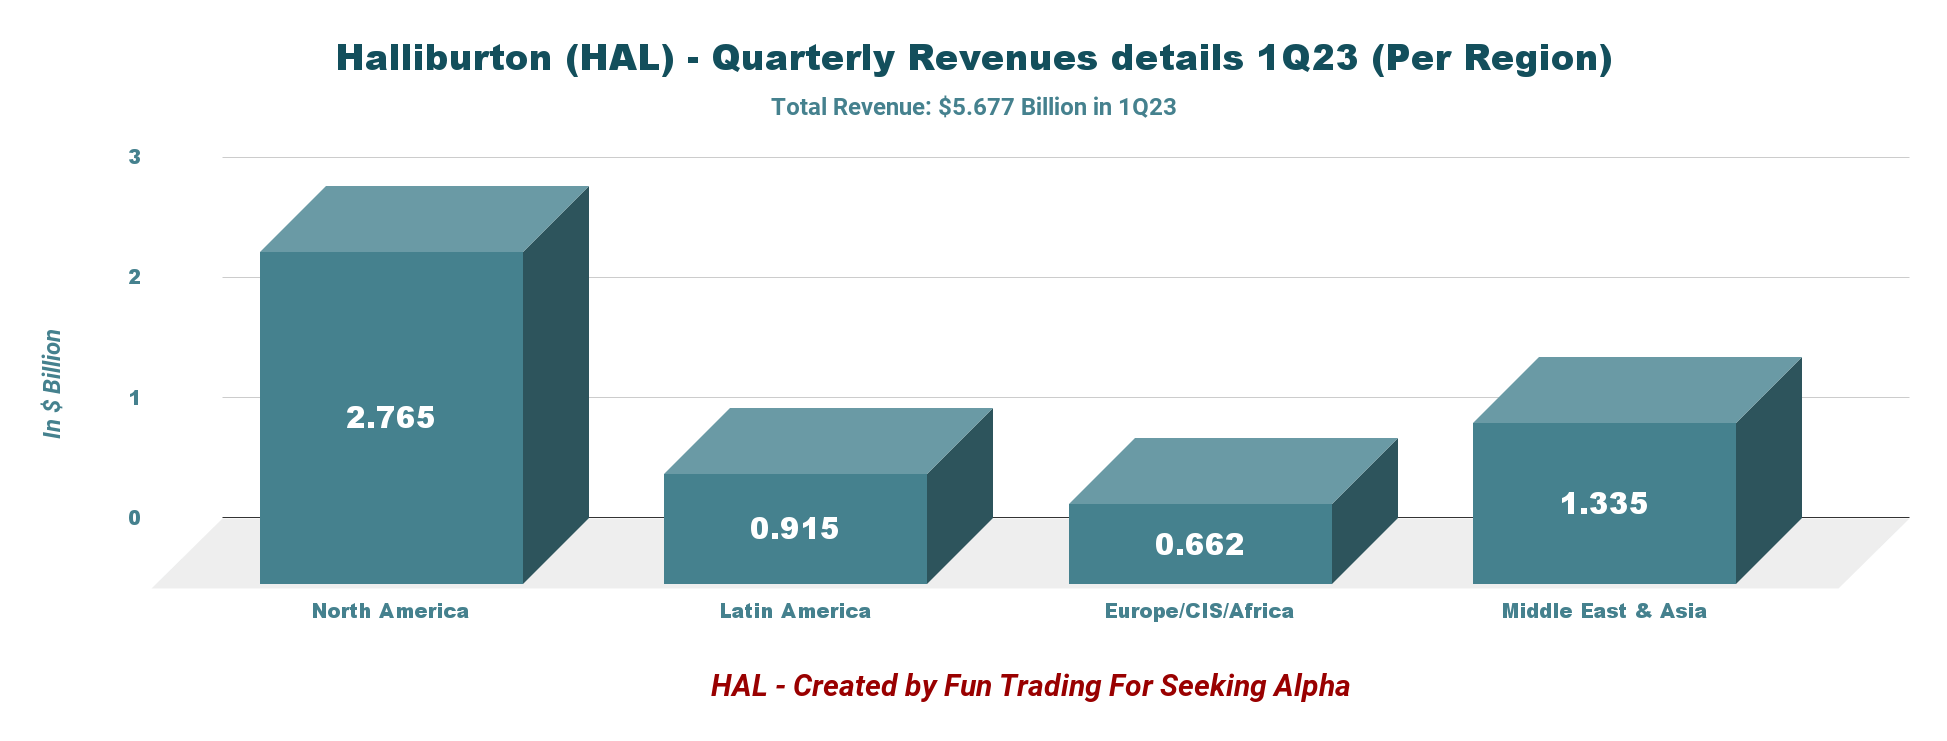
Below is the revenue repartition per region.
HAL Quarterly Revenue per Region 1Q23 (Fun Trading)
Halliburton's business model is based on two distinct segments:
- Completion and Production (60% in 1Q23)
- Drilling and Evaluation (40% in 1Q23).
HAL Quarterly Revenue Per Segment 1Q23 (Fun Trading) HAL Revenue Breakdown (HAL Presentation)
2 - Generic Free Cash Flow was a loss of $146 million in 1Q23
HAL Quarterly Free Cash Flow History (Fun Trading)
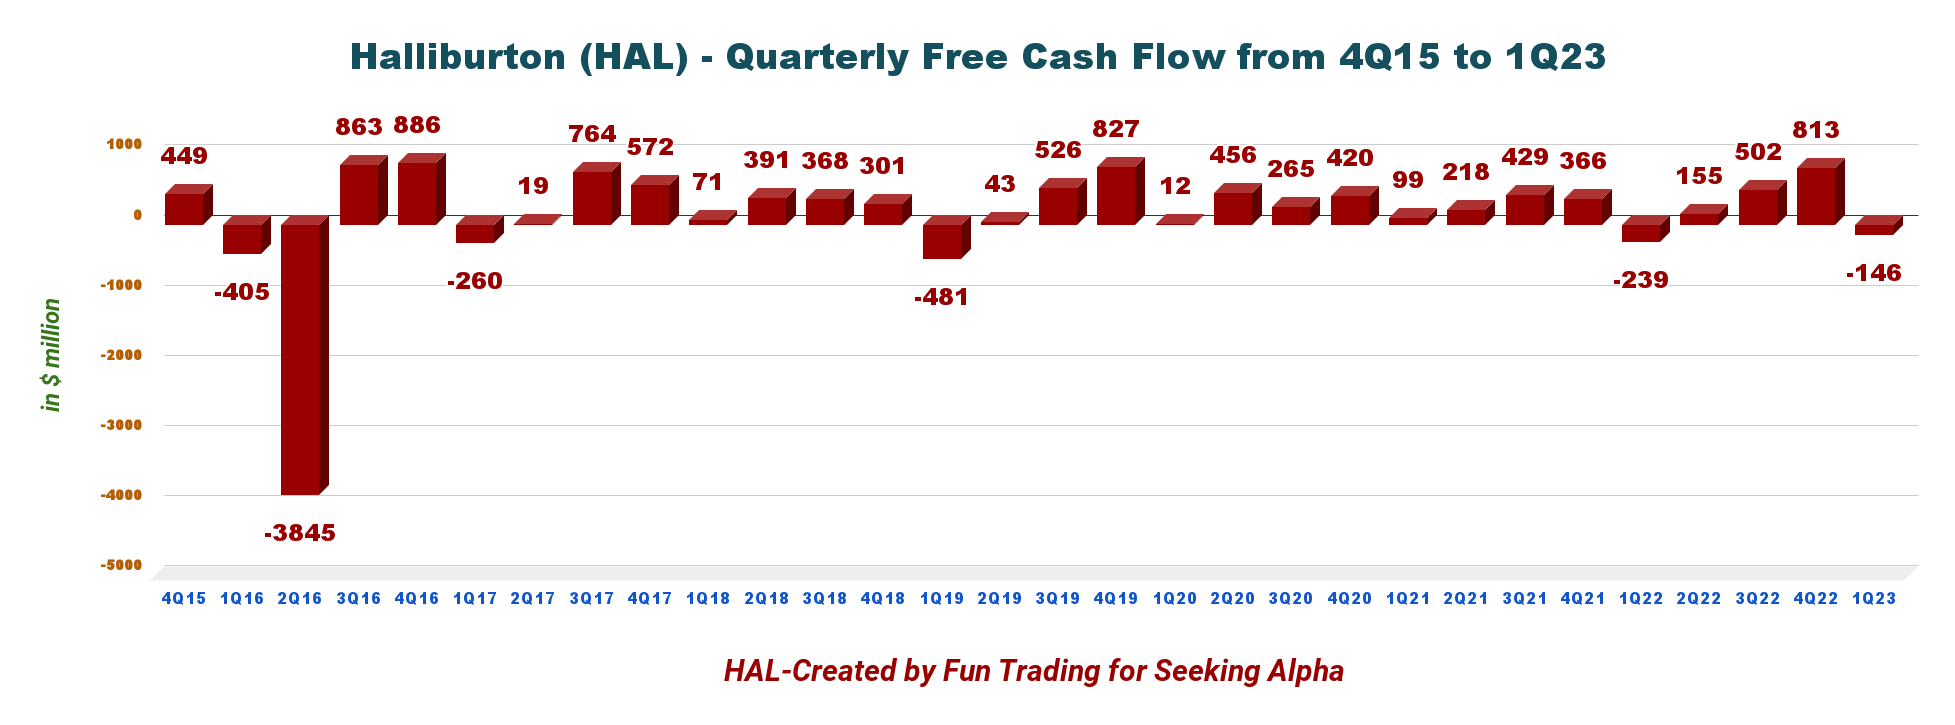
Note: The generic free cash flow is the cash from operations minus CapEx. HAL indicates a loss of $105 million with a different calculation.
Trailing Twelve months free cash flow is estimated at $1,324 million ("ttm"), with a generic free cash flow loss of $146 million in 1Q23.
The company pays a quarterly dividend of $0.16 per share. The dividend yield is now down to 2%.
3 - Net debt is now $6.05 billion in 1Q23
HAL Quarterly Cash versus Debt History (Fun Trading)
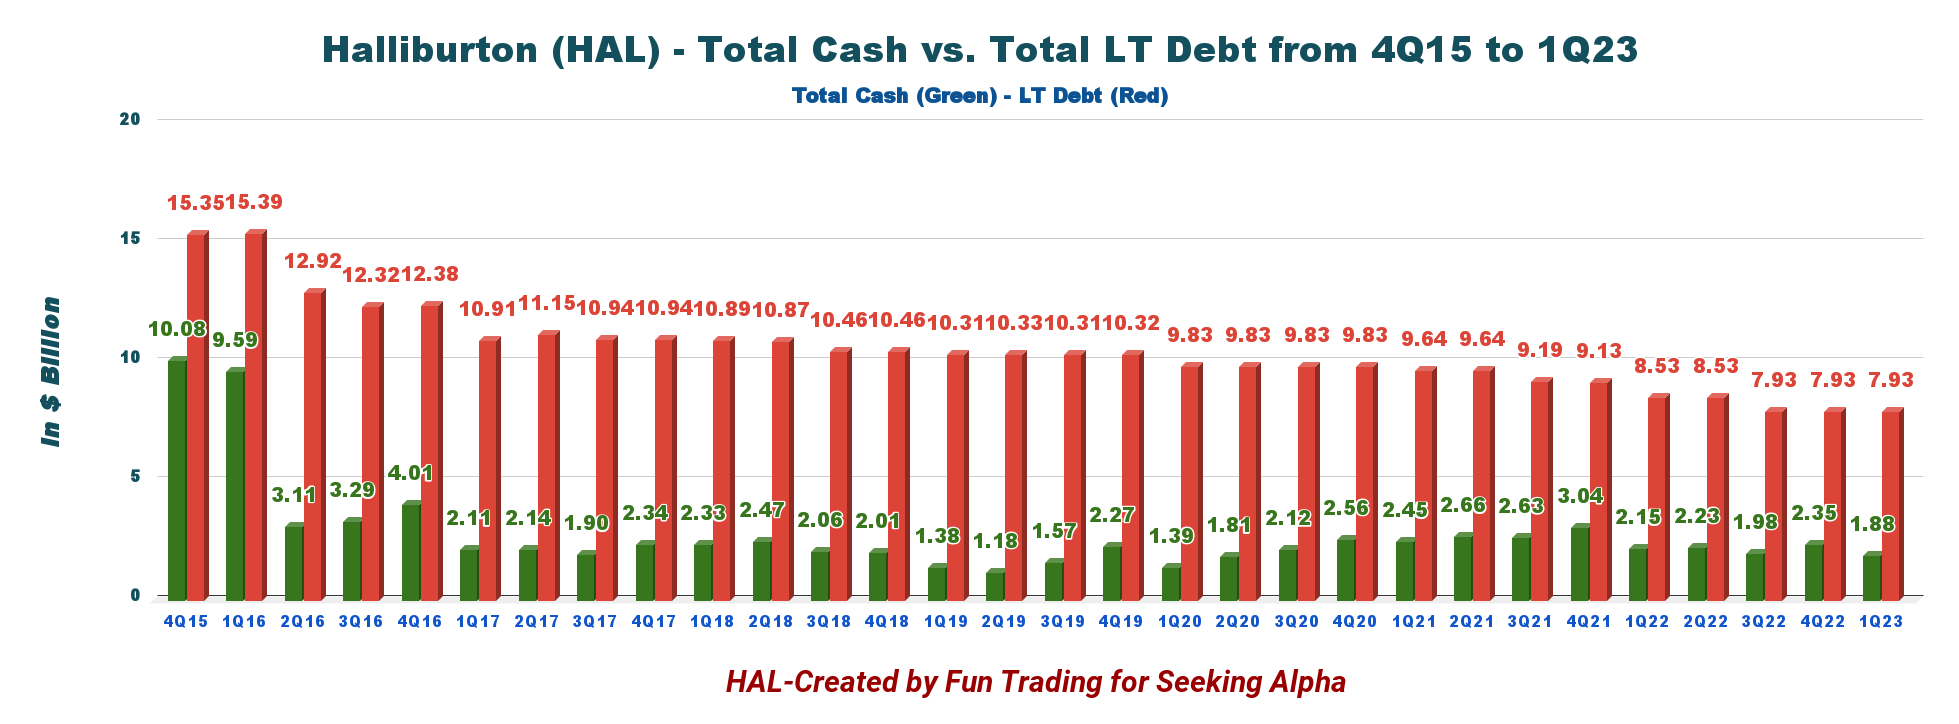
As we can see in the chart above, the company is doing an excellent job of reducing its massive debt load. However, debt is still a sensitive issue. Net debt is $6.05 billion.
As of March 31, 2023, the company had $1.879 billion in cash/cash equivalents and $7.929 billion in long-term debt.
4 - Schlumberger versus HAL - Commentary
Halliburton and Schlumberger are the world's two most reliable oilfield services. Hence, both companies can be considered suitable long-term investments from a savvy investor's perspective. However, what has changed from the preceding quarter is the outlook is not bullish anymore, and HAL and SLB stocks have been falling regularly since January.
The global oilfield services industry outlook is still positive worldwide, with the onshore segment accounting for a significant share of the oilfield services industry. North America is the leading region and is anticipated to continue its supremacy in the global market until 2030.
On April 2023, according to Consegic, the CAGR is expected to grow by 5.9% or $469 Billion between 2023 and 2030.
However, in 2023,
" market players might incur losses due to a huge gap in currency translation followed by contracting revenues, shrinking profit margins & cost pressure on logistics and supply chain."
Hence, I do not expect another stellar year in 2023 but a moderate one for the industry assuming commodity prices can stabilize soon. Oil and Natural Gas prices have been falling consistently since the start of 2023, and the mood among E&P companies is no longer toward aggressive CapEx spending.
HAL and SLB did not generate Free Cash Flow in 1Q23, showing that the business has cooled down.
Technical Analysis
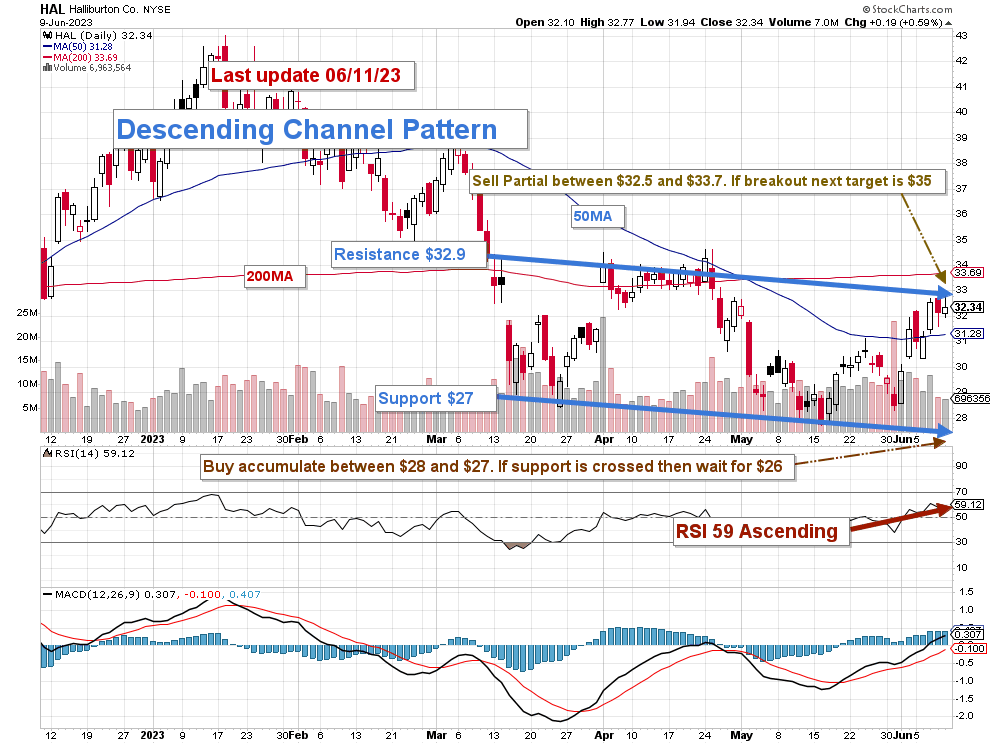
HAL TA Chart Short-Term (Fun Trading StockCharts) Note: the chart has been adjusted for dividends.
HAL forms a descending channel pattern, with resistance at $32.9 and support at $27. RSI is 59 and suggests we will enter an overbought territory soon.
As I said in my investment thesis, I suggest trading short-term LIFO for about 50% of your position. I recommend selling partially between $32.5 and $33.7, possibly with higher resistance at $35. Conversely, it is reasonable to accumulate HAL between $27 and $28, with lower support possible at $26.
Trading LIFO is an excellent way of trading your long core position. It means that you are selling first your recent purchases and keeping your older position for a higher level.
Warning: The TA chart must be updated frequently to be relevant. It is what I am doing in my stock tracker. The chart above has a possible validity of about a week. Remember, the TA chart is a tool only to help you adopt the right strategy. It is not a way to foresee the future. No one and nothing can.
For further details see:
Halliburton And Schlumberger: Solid Players In Oilfield Services