SLB - Halliburton Or Schlumberger: A Matter Of Priority Only
2023-03-07 12:53:28 ET
Summary
- Which is the best investment, Halliburton Company or Schlumberger Limited?
- A look at the companies' fundamentals gives us what we need to pick the best stock.
- While the outlook for the next few years is still bright, the industry faces some headwinds in 2023.
Introduction
Two or three leading players dominate the oilfield equipment and services for the oil & gas industry. Baker Hughes Company (BKR), Halliburton Company (HAL), and Schlumberger Limited (SLB).
However, the industry leaders are obviously HAL and SLB. Thus, It is noteworthy to compare those two companies' fundamentals to decide which is the most adapted to your need, especially if you do not want to invest excessively in this volatile segment.
This article is an update of my preceding article , published on January 18, 2023.
As I said in my preceding article, one meaningful difference is their "business regional focus." Halliburton is mainly North American business-oriented, whereas Schlumberger is more widespread. The other notable difference is that Schlumberger has a much larger revenue worldwide. SLB revenues were over 40% bigger than HAL.
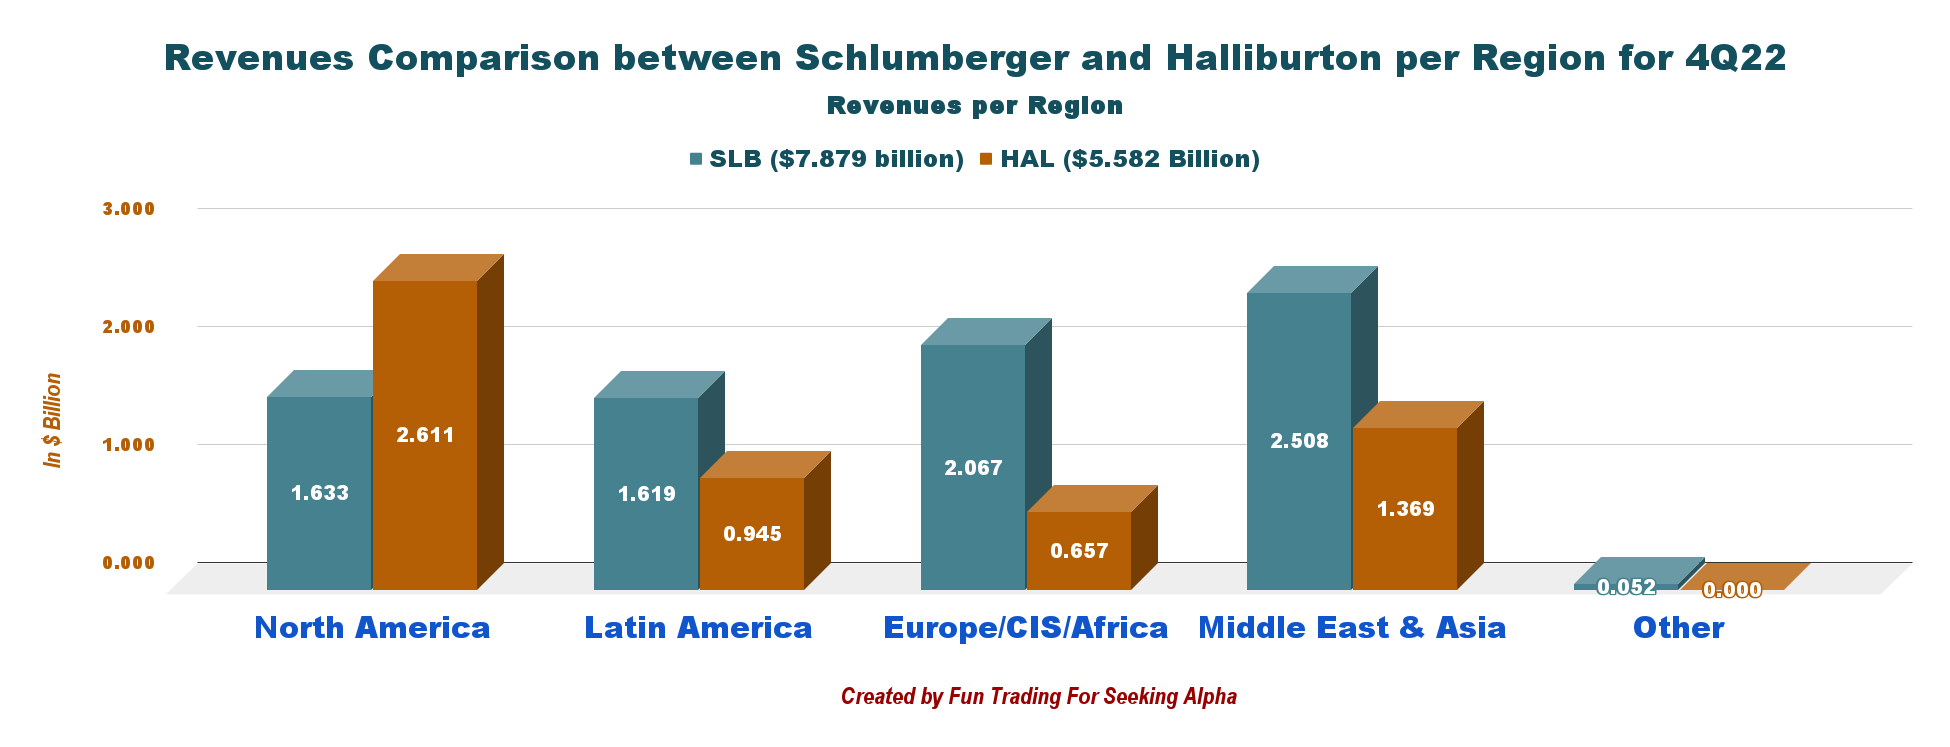
We can see it clearly in the chart below when we analyze the revenues per region:
HAL SLB Revenue per region comparison 4Q22 (Fun Trading)
Schlumberger generated 41% more revenue than Halliburton in the fourth quarter of 2022. As we can see, Halliburton generated $2.611 billion in revenue from North America, or 46.8% of its total revenue in 4Q22, versus 20.7% for Schlumberger.
Note: I highly recommend reading my article on Schlumberger, published on February 23, 2023.
Both companies have generated significant returns over the twelve months. HAL gained 14% over this period, while SLB returned 42%. We can see a plateau forming.
4Q22 balance sheet comparison: HAL versus SLB
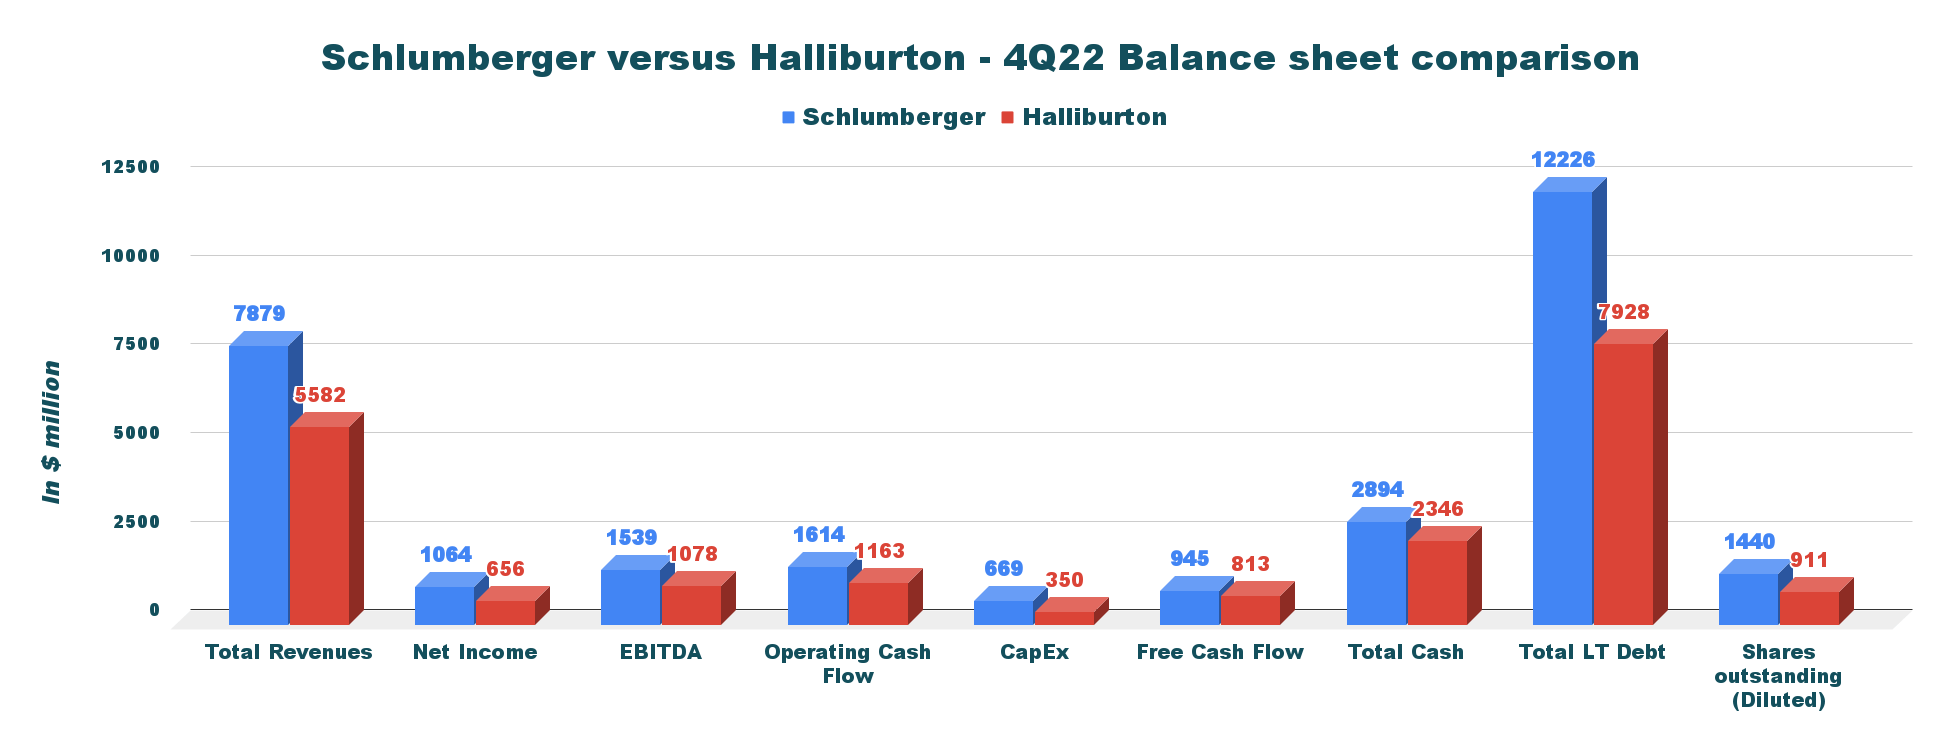
The chart below is a thorough comparison between Halliburton and Schlumberger. Most of the metrics favor Schlumberger versus Halliburton.
EBITDA per diluted share shows $1.18 for HAL and $1.07 for SLB, and the trailing 12-month free cash flow is $1,231 million or $1.35 per diluted share for HAL versus $2,005 million or $1.39 for SLB.
However, Halliburton has a slightly better debt profile than SLB, with net debt of $5.58 billion in 4Q22 versus $9.33 billion for SLB. It is $6.13 per diluted share for HAL versus $6.48 for SLB.
The dividend yield is very similar and is around 1.7%-1.8%.
You can access the detailed SLB balance sheet in my article reference earlier.
HAL versus SLB Balance sheet 4Q22 (Fun Trading)
Halliburton: Financials history - The raw numbers - Fourth quarter 2022
| Halliburton |
| 4Q21 |
| 1Q22 |
| 2Q22 |
| 3Q22 |
| 4Q22 |
| Total Revenues in $ Billion |
| 4.28 |
| 4.28 |
| 5.07 |
| 5.36 |
| 5.58 |
| Net income in $ Million |
| 824 |
| 263 |
| 109 |
| 544 |
| 656 |
| EBITDA $ Million |
| 757 |
| 671 |
| 594 |
| 1,063 |
| 1,078 |
| EPS diluted in $/share |
| 0.92 |
| 0.29 |
| 0.12 |
| 0.60 |
| 0.72 |
| Operating Cash Flow in $ Million |
| 682 |
| -50 |
| 376 |
| 753 |
| 1,163 |
| CapEx in $ Million |
| 316 |
| 189 |
| 221 |
| 251 |
| 350 |
| Free Cash Flow in $ Million |
| 366 |
| -239 |
| 155 |
| 502 |
| 813 |
| Total cash $ Billion |
| 3.04 |
| 2.15 |
| 2.23 |
| 1.98 |
| 2.35 |
| Total LT Debt in $ billion |
| 9.13 |
| 8.53 |
| 8.53 |
| 7.93 |
| 7.93 |
| Dividend per share in $ |
| 0.12 |
| 0.12 |
| 0.12 |
| 0.12 |
| 0.16 |
| Shares Outstanding (Diluted) in Million |
| 895 |
| 903 |
| 909 |
| 910 |
| 911 |
Source: HAL filings.
Commentary
After analyzing, Halliburton and Schlumberger's balance sheets, we can conclude that they can be considered suitable long-term investments from a savvy investor's perspective. Furthermore, the long-term outlook remains positive, albeit at a lower rate.
What is the global oilfield services industry outlook?
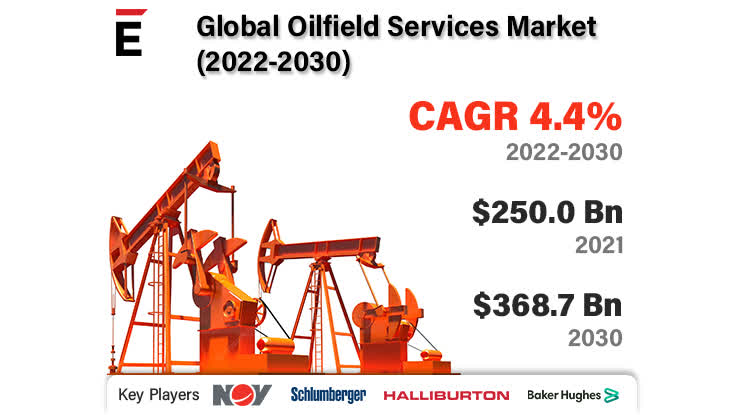
Extrapolate released an extensive and upbeat report about the global oilfield services industry outlook.
Global Oilfield Services Market size was worth around USD 250 Billion in 2021 and is predicted to grow to around USD 368.72 Billion by 2030 with a compound annual growth rate of roughly 4.4 % between 2022 and 2030.
HAL Extrapolate outlook (Extrapolate)
The industry forecast is cheerful worldwide for the next eight years, with the onshore segment accounting for a significant share of the oilfield services industry.
I take it with a grain of salt. I am not sure this long-trend outlook can be justified for an industry notoriously volatile and inconsistent, shaken by recurring grey swans.
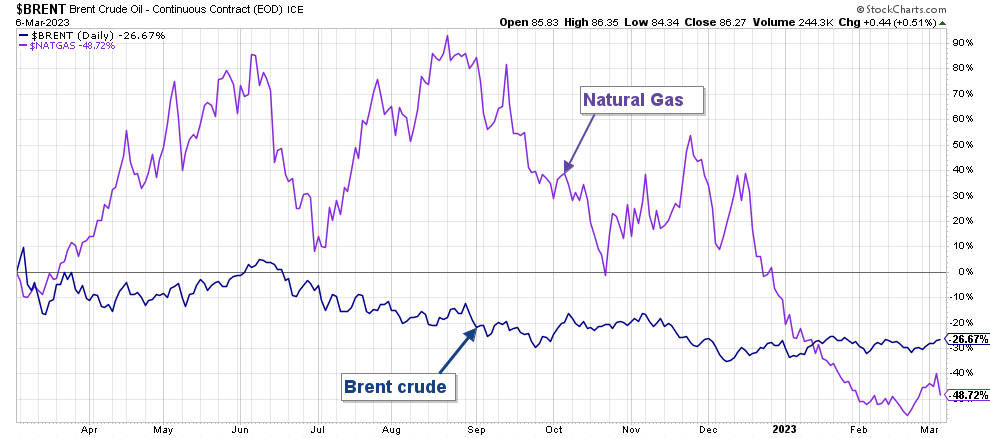
Undeniably, the O&G industry will enter 2023 with a strong balance sheet, supporting the oilfields services market, but this year will not be as bright as 2022. Oil and natural gas prices have decreased significantly from their high in 2022, and the sector is in the process of consolidating to adapt to the new paradigm.
We can see already a resistance forming that could be the precursor of a slow downtrend in 2023.
HAL brent and NG Price 1-Year chart (Fun Trading StockCharts)
Thus, I do not expect any miracles in 2023, and investing in this sector, while entirely secure, may not result in a significant return for shareholders who will rely mainly on the dividend, which is poor.
Which is the best, HAL or SLB?
I find Schlumberger a slightly better choice because of its lesser exposure in North America. The company's more versatile business model protects it better from sudden regional issues. However, on the other hand, doing business in the USA is a good sign of stability and lower risks.
Thus, HAL and SLB are truly equivalent, showing no real winner or loser.
Finally, the technical analysis confirms a slightly better outlook for SLB. The chart below shows the ratio SLB/HAL.
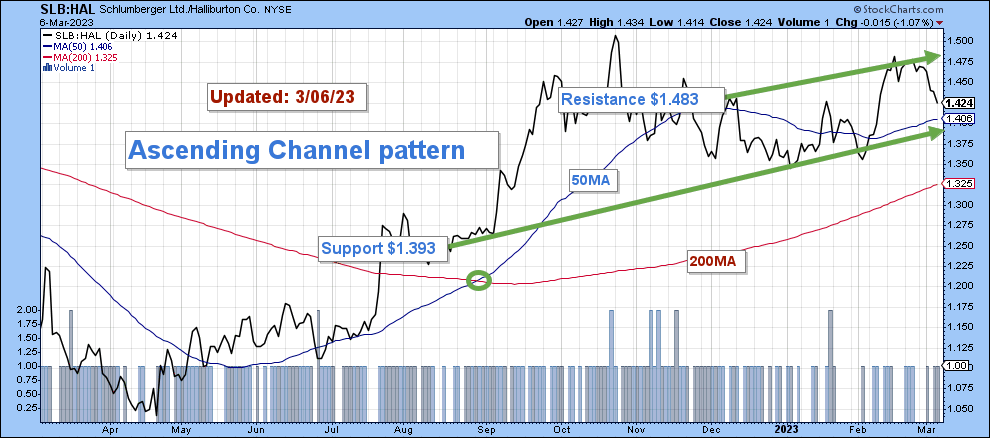
Note: SLB trades at $57.16 and HAL at $38.84, a ratio SLB/HAL of 1.47 close to the resistance. It suggests that SLB has been faring better than HAL since April 2022.
However, is it a good time to buy HAL or SLB?
1 - Commentary
Halliburton Company and Schlumberger Limited are trading well but show signs of buyer's fatigue, with an apparent top resistance below $40, as shown in my chart below. I see an increased risk of a breakdown in 2023 based on a not-so-rosy outlook for oil and natural gas prices going through a potential global recession in H2 2023.
The FED is turning more hawkish while inflationary pressures keep biting, and China is indicating smaller-than-expected growth for 2023. From a long-term investor's perspective, it is not a good time to invest in this segment, and I warn any prospective buyer about buying at the moment. Instead, I recommend selling a part of your HAL and/or SLB position, expecting some possible correction soon.
I strongly suggest trading short-term (using the LIFO method) 50% of your position and waiting for a significant retracement to buy back again, possibly in 2Q23.
2 - Technical Analysis for Halliburton
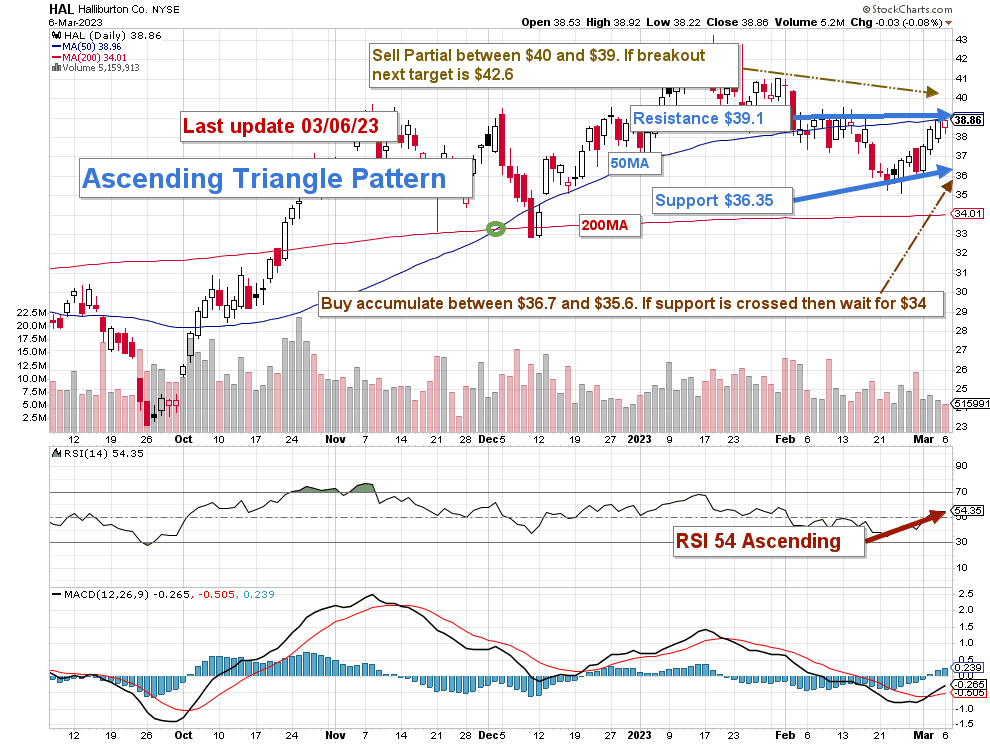
Note: The chart is adjusted for the dividend.
HAL forms an ascending triangle pattern with resistance at $39.1 and support at $36.35. The ascending triangle pattern is a bullish continuation pattern which means we should expect a breakout at the end of the pattern. However, the pattern could be bearish in some instances, and I believe it is possibly the case here.
A good entry point could be the 200MA at $34.
3 - Technical Analysis for Schlumberger
SLB TA Chart short-term (Fun Trading StockCharts)
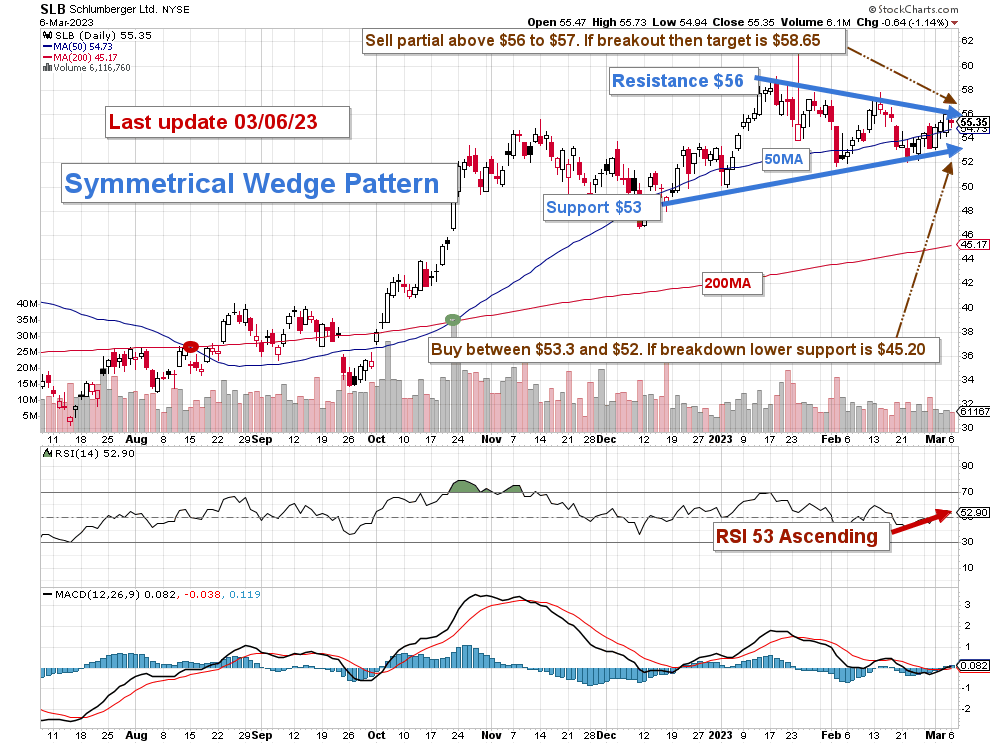
Note: The chart is adjusted for the dividend.
SLB forms a symmetrical wedge pattern with resistance at $56 and support at $53. The symmetrical wedge chart pattern indicates a possible breakout in either direction. The odds of a breakdown are higher for SLB, though.
A good entry point could be the 200MA at $45.20.
Warning: The TA chart must be updated frequently to be relevant. It is what I am doing in my stock tracker. The chart above has a possible validity of about a week. Remember, the TA chart is a tool only to help you adopt the right strategy. It is not a way to foresee the future. No one and nothing can.
For further details see:
Halliburton Or Schlumberger: A Matter Of Priority Only