BKR - Halliburton Q2 Earnings: Expecting Weaker Results In H2 2023
2023-07-21 15:10:42 ET
Summary
- Halliburton Company reported weakness in North American sales but an increase in international sales. Halliburton posted $5.798 billion in revenue for the second quarter of 2023.
- The company said in the conference call that Completion and Production division revenue grew 19% YoY and the Drilling and Evaluation division revenues grew 7%.
- I recommend accumulating Halliburton Company stock between $35.9 and $34.6, with lower support possible at $32.5.
Introduction
Three leading players dominate the oilfield equipment and services for the oil & gas industry. Baker Hughes Company ( BKR ), Halliburton Company ( HAL ), and Schlumberger Limited ( SLB ).
Halliburton Company announced its second quarter of 2023 results on July 19, 2023. This article updates my preceding article, published on June 12, 2023.
1 - Presentation
One important characteristic is that Halliburton focuses mainly on North America, whereas Schlumberger and Baker Hughes are more widespread. The other notable difference is that Schlumberger has a much larger revenue worldwide.
Note: I strongly recommend reading my article published yesterday on Baker Hughes 2Q23 results by clicking here.
Jeff Miller, Chairman, President and CEO, said in the press release:
Halliburton's strong performance in the second quarter demonstrates the earnings power of our business. Total company revenue increased 14% and operating income grew 41% compared to second quarter of 2022 adjusted operating income. Both of our divisions delivered strong margin performance across all regions.
Halliburton came out with adjusted quarterly earnings of $0.77 per share in 2Q23, beating analysts' expectations. This compares to earnings of $0.49 per share in 2Q22.
2 - Performance
Halliburton and Baker Hughes are similar and significantly underperformed SLB, as shown in the chart below. HAL is up 24% YoY.
CEO Jeff Miller said in the conference call:
In the second quarter, Halliburton once again delivered strong results driven by service quality, outstanding execution and strong global demand for high quality and high performance oilfield services.
Halliburton: Financials History - The Raw Numbers until Second Quarter 2023
| Halliburton |
| 2Q22 |
| 3Q22 |
| 4Q22 |
| 1Q23 |
| 2Q23 |
| Total Revenues in $ Billion |
| 5.07 |
| 5.36 |
| 5.58 |
| 5.68 |
| 5.80 |
| Net income in $ Million |
| 109 |
| 544 |
| 656 |
| 651 |
| 610 |
| EBITDA $ Million |
| 594 |
| 1,063 |
| 1,078 |
| 1,188 |
| 1,120* |
| EPS diluted in $/share |
| 0.12 |
| 0.60 |
| 0.72 |
| 0.72 |
| 0.68 |
| Operating Cash Flow in $ Million |
| 376 |
| 753 |
| 1,163 |
| 122 |
| 1,052 |
| CapEx in $ Million |
| 221 |
| 251 |
| 350 |
| 268 |
| 303 |
| Free Cash Flow in $ Million |
| 155 |
| 502 |
| 813 |
| -146 |
| 749* |
| Total cash $ Billion |
| 2.23 |
| 1.98 |
| 2.35 |
| 1.88 |
| 2.11 |
| Total LT Debt in $ billion |
| 8.53 |
| 7.93 |
| 7.93 |
| 7.93 |
| 7.93 |
| Dividend per share in $ |
| 0.12 |
| 0.12 |
| 0.16 |
| 0.16 |
| 0.16 |
| Shares Outstanding (Diluted) in Million |
| 909 |
| 910 |
| 911 |
| 907 |
| 903 |
Source: HAL filings.
* Estimated by Fun Trading.
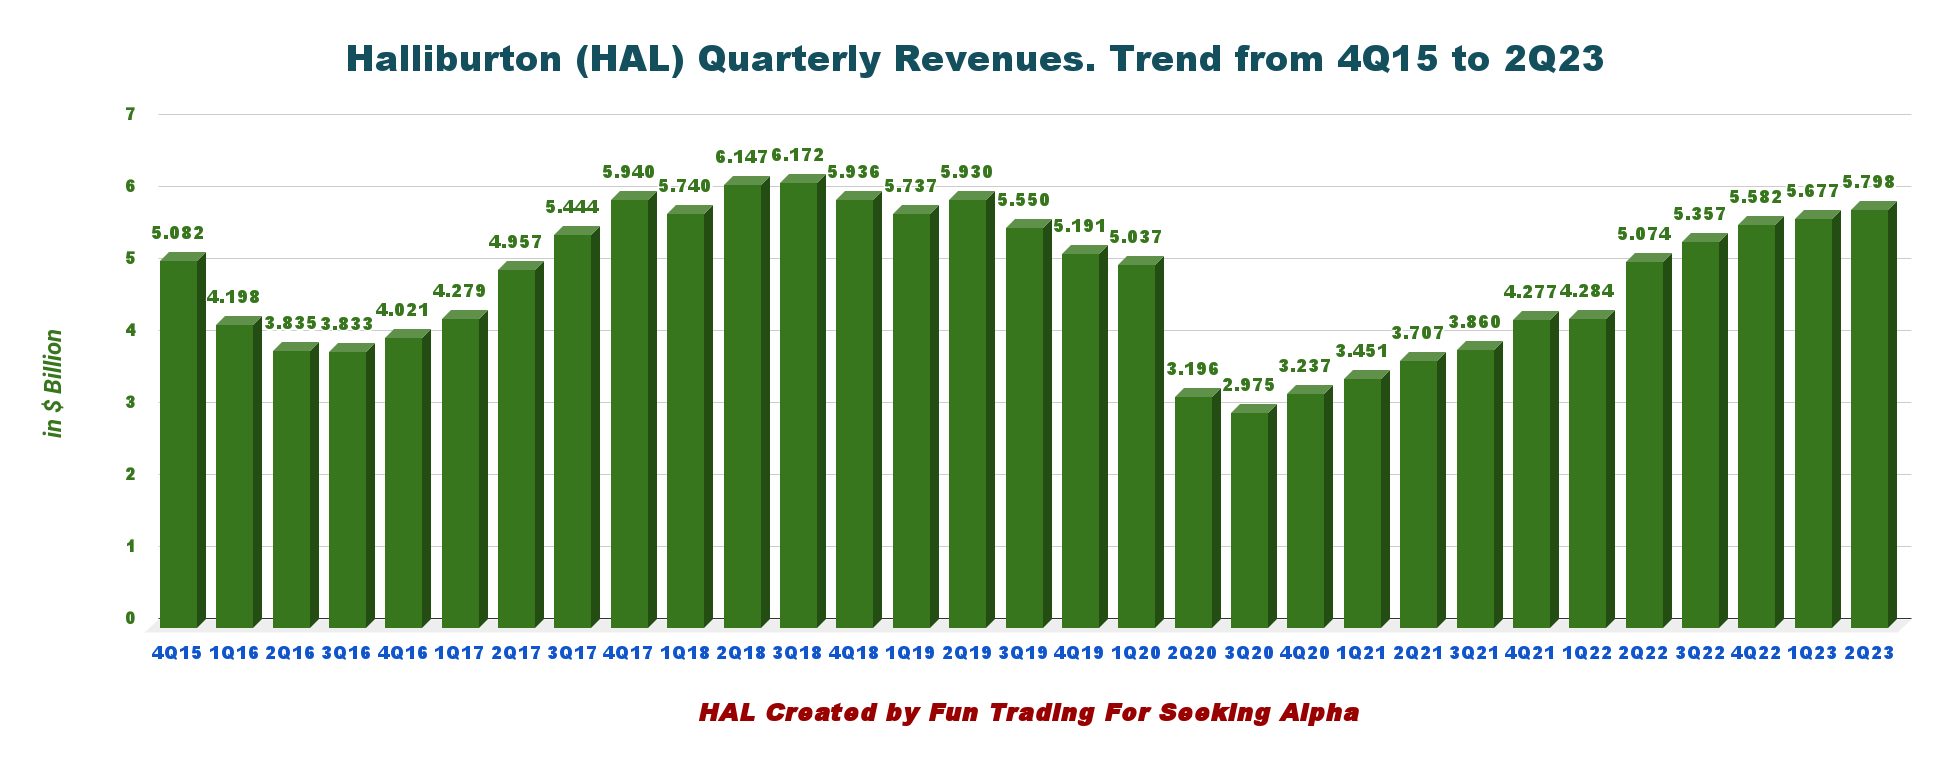
1 - Revenues of $5.798 billion in 2Q23
HAL Quarterly Revenue History (Fun Trading)
Halliburton reported weakness in North American sales, but an increase in international sales. Halliburton posted $5.798 billion in revenue for the second quarter of 2023,
The North American revenue was $2.696 billion ( 11.1% increase from 2Q22), and income from Halliburton's international was $3.102 billion .
The company posted a net income of $610 million , or $0.68 per diluted share.
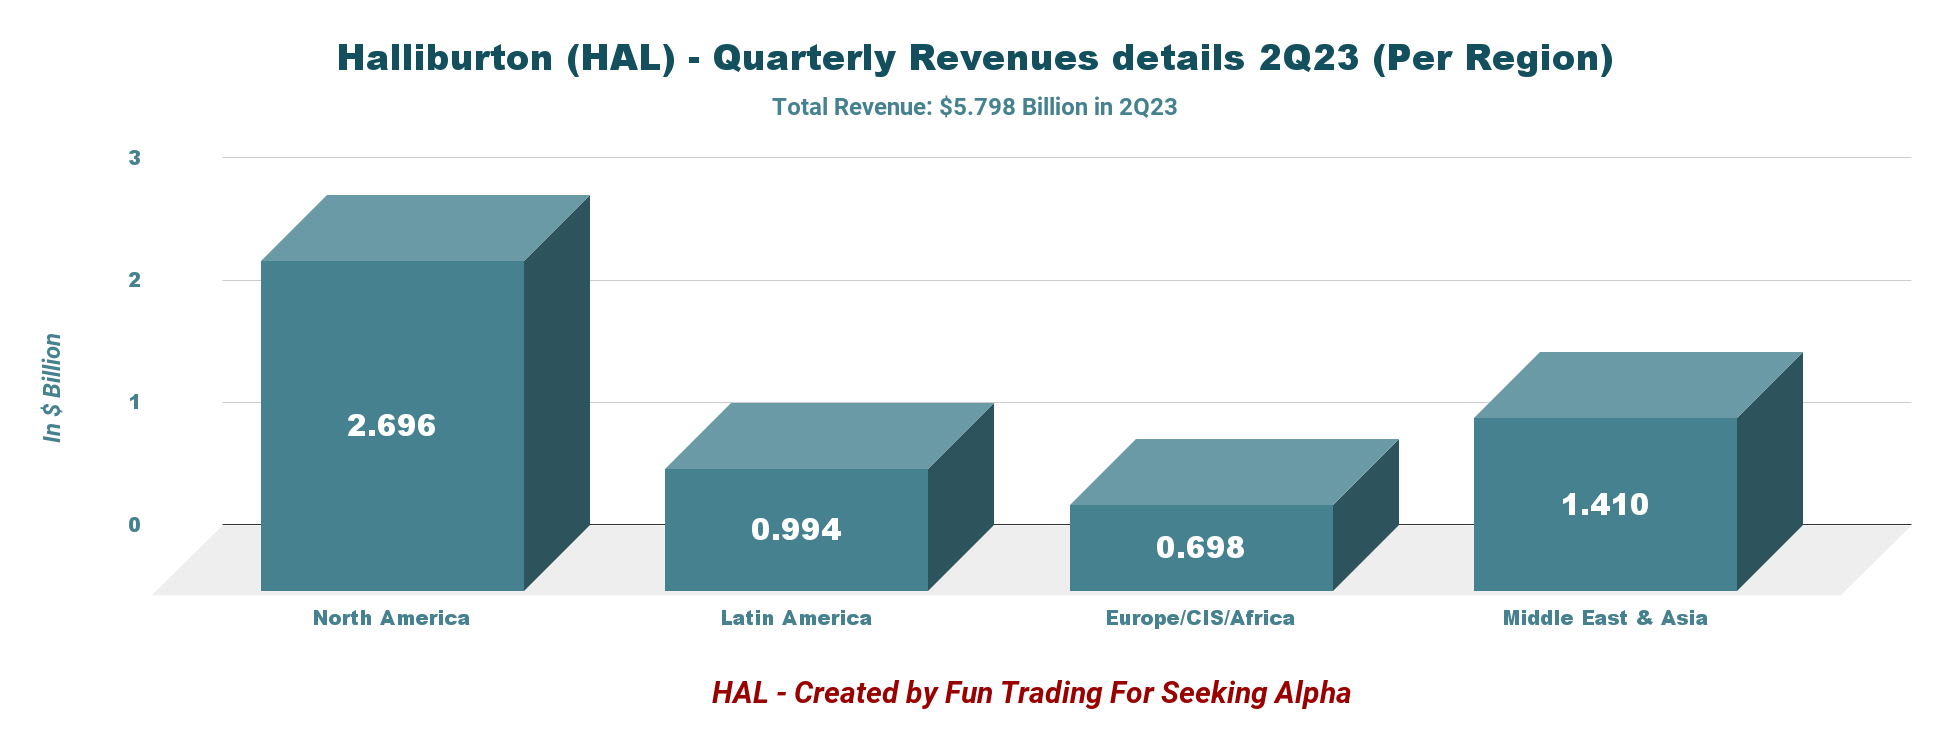
Below is the revenue repartition per region.
HAL 2Q23 Revenue per Region (Fun Trading)
-
Latin America : Revenue was $994 million, up 31.1% compared to the year-ago quarter.
-
Europe/Africa/CIS : Revenue was $698 million, down 2.8% year over year.
-
North America : Revenue was $2.70 billion, up 11.1% compared to the year-ago quarter.
-
Middle East/Asia : Revenue was $1.41 billion, up 20.3% YoY.
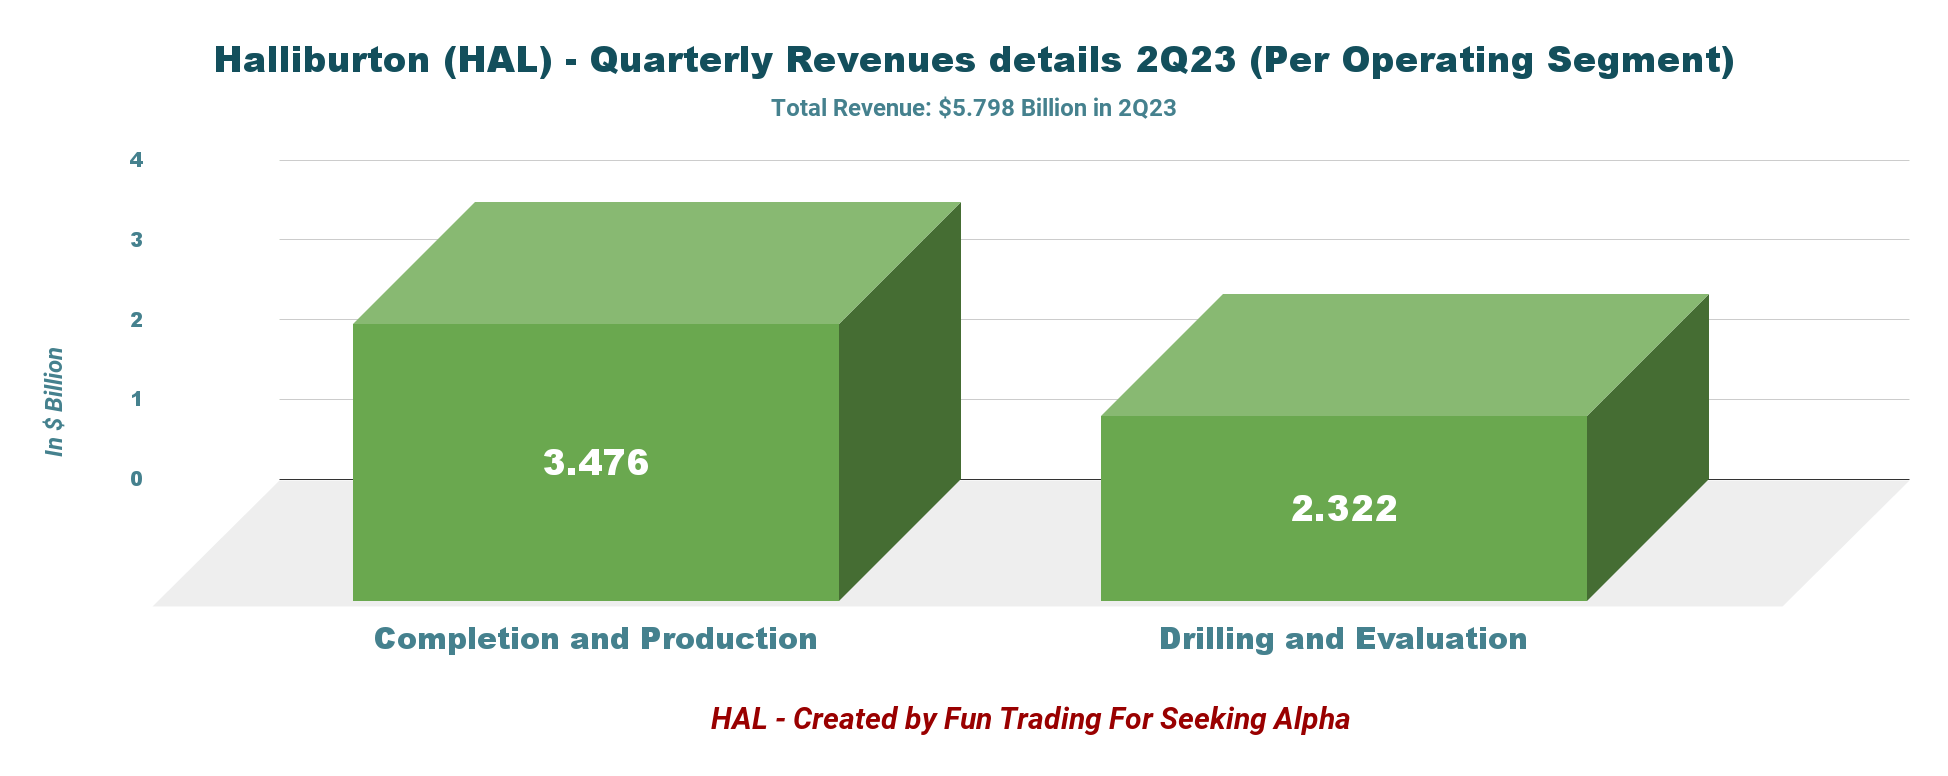
Halliburton's business model is based on two distinct segments:
- Completion and Production ( 60% in 2Q23).
- Drilling and Evaluation (40% in 2Q23).
HAL 2Q23 Revenue per Segment (Fun Trading)
The company said in the conference call the Completion and Production division revenue grew 19% YoY while margins expanded by 320 basis points. The Drilling and Evaluation division revenue grew 7% YoY while margins expanded nearly 300 basis points.
The company is still bullish for 2023 and beyond. CEO Jeff Miller said in the conference call:
Overall, I expect upstream spending to grow in 2023 and beyond. For this year, I expect International and North America customer spending growth in the high teens and around 10% respectively compared to last year, despite reduced rig count and completion activity in the U.S.
However, Halliburton and Baker Hughes, which reported the same day, warned of weakness in the U.S. shale activity for the remainder of 2023 due to lower oil and gas prices. In the conference call:
North America revenue grew 11% versus the same period last year, and margins were sequentially flat versus the last quarter. Looking ahead into the second half, I expect overall market activity in North America will be slightly lower than in the first half.
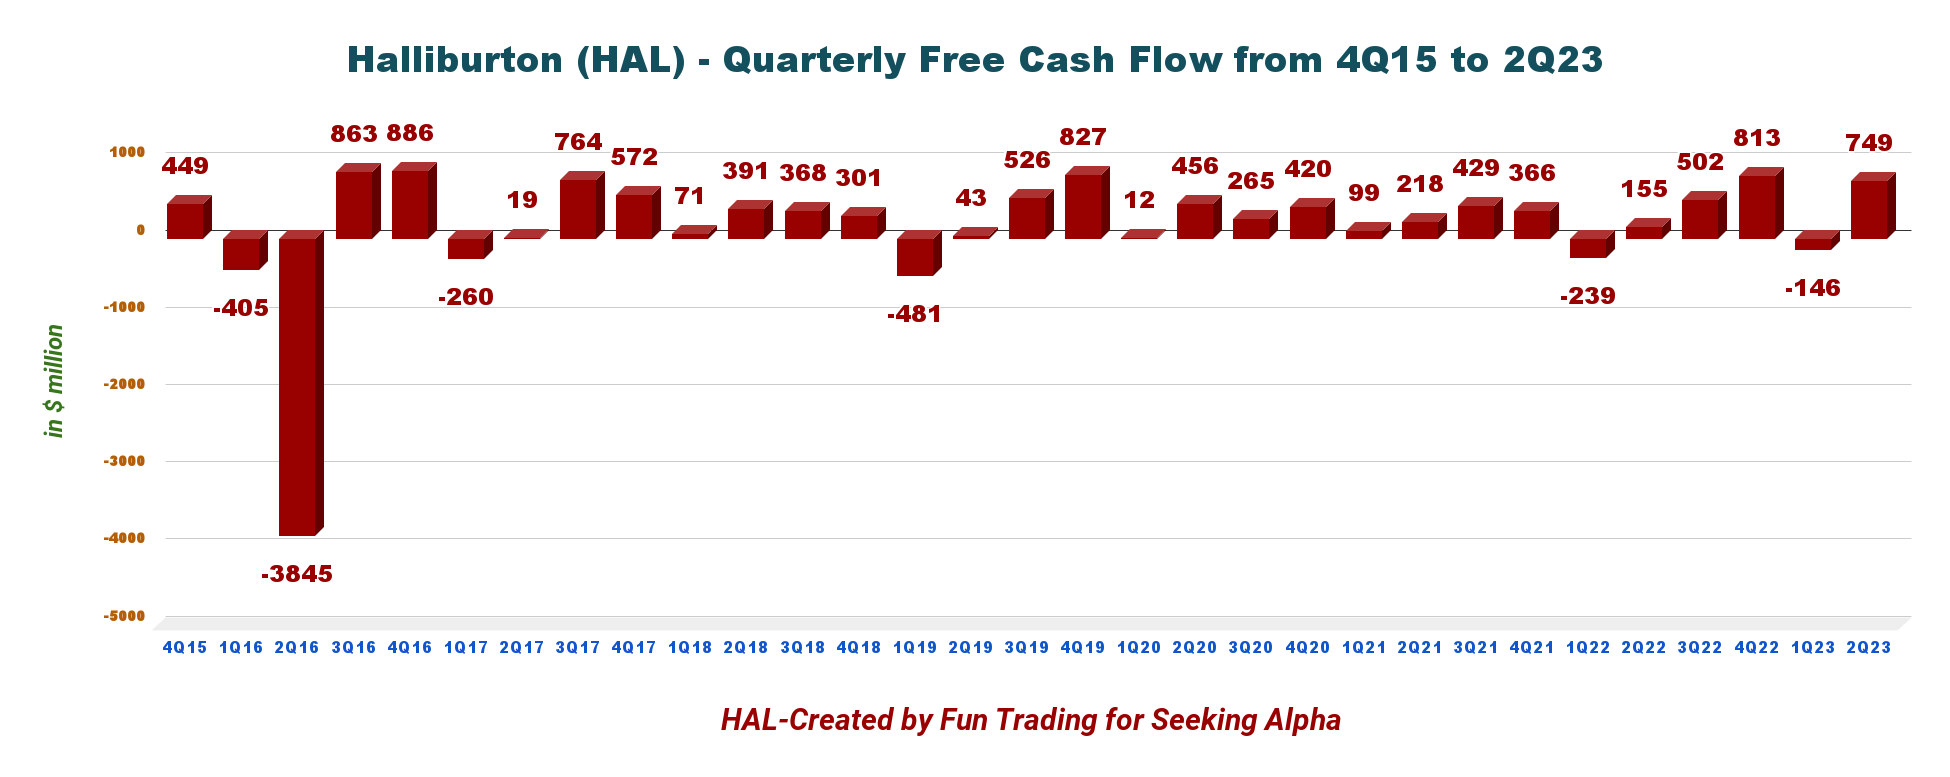
2 - Generic Free Cash Flow was $749 million in 2Q23
HAL Quarterly Free Cash Flow History (Fun Trading)
Note: The generic free cash flow is the cash from operations minus CapEx. HAL indicates an FCF of $798 million with a different calculation (see release page 18).
Trailing Twelve months free cash flow is estimated at $1,918 million ("ttm"), with a generic free cash flow of $749 million in 2Q23.
The company pays a quarterly dividend of $0.16 per share. The dividend yield is now down to 1.76%.
Also, HAL repurchased approximately $248 million worth of shares during the second quarter.
3 - Net debt is now $5.83 billion in 2Q23
HAL Quarterly Cash versus Debt History (Fun Trading)
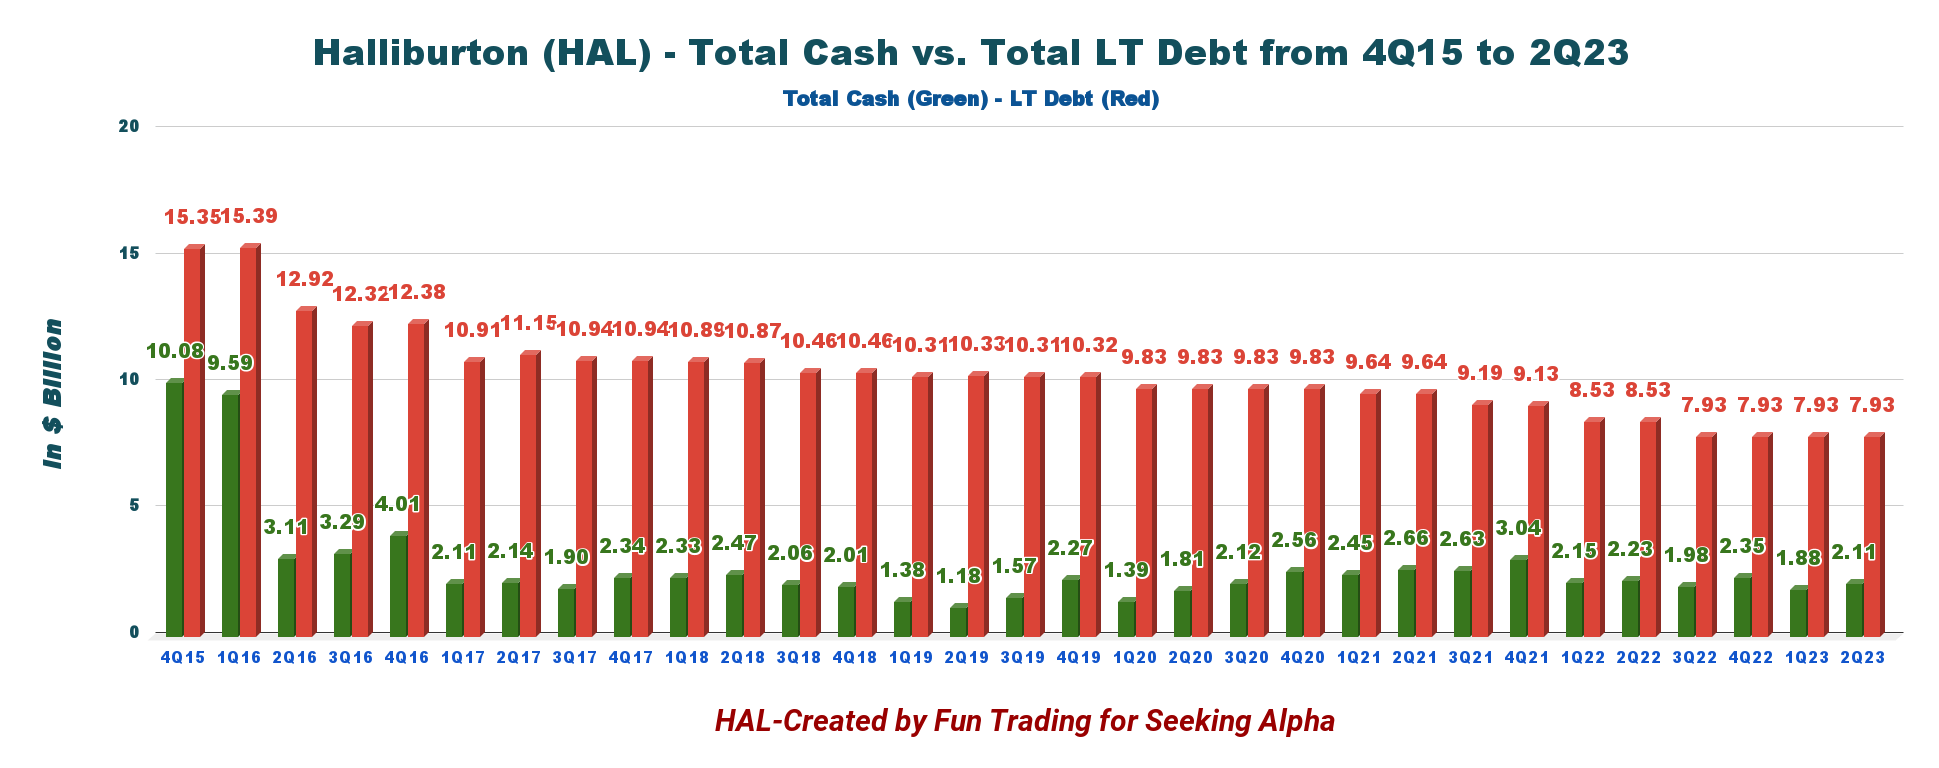
As we can see in the chart above, the company is doing an excellent job of reducing its massive debt load. However, debt is still a sensitive issue. Net debt is $5.83 billion, more than I would like to see.
As of June 30, 2023, the company had $2.105 billion in cash/cash equivalents and $7.931 billion in long-term debt.
Technical Analysis and Commentary
HAL TA Chart (Fun Trading StockCharts) Note: The chart has been adjusted for dividends.
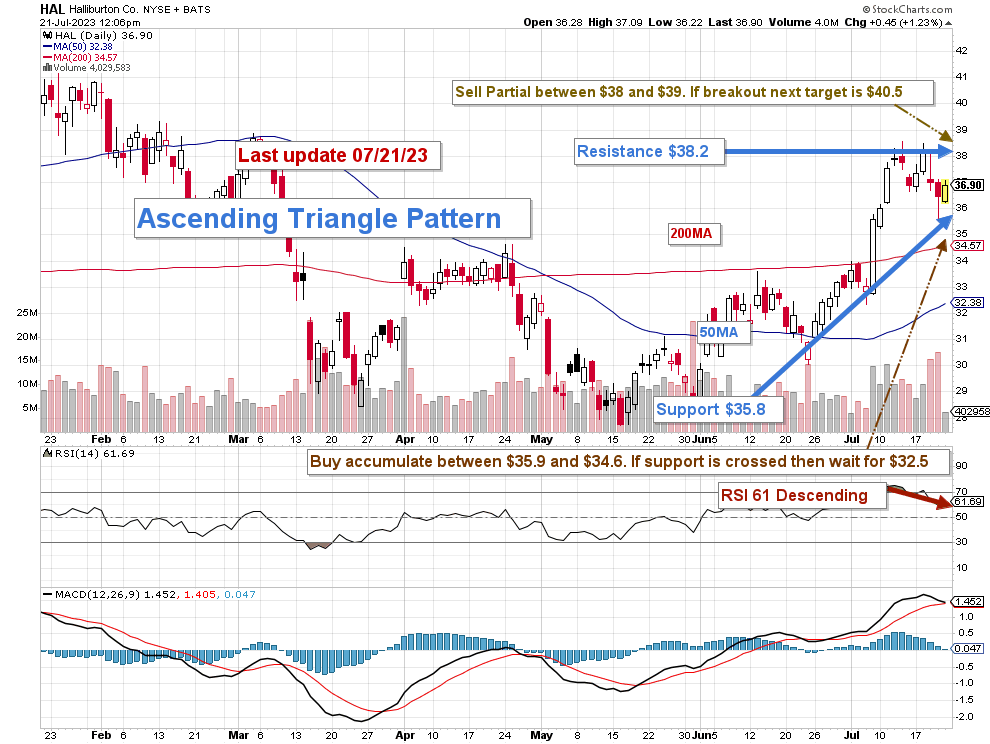
HAL forms an ascending triangle pattern, with resistance at $38.2 and support at $35.8 . RSI is 61 and suggests a retracement in process.
As I said in my investment thesis, I suggest trading short-term LIFO for about 50% of your position. I recommend selling partially between $38 and $39, possibly with higher resistance at $40.5. Conversely, it is reasonable to accumulate HAL between $35.9 and $34.6, with lower support possible at $32.5.
Trading LIFO is an excellent way of trading your long core position. It means that you are selling first your recent purchases and keeping your older position for a higher level.
Warning: The TA chart must be updated frequently to be relevant. It is what I am doing in my stock tracker. The chart above has a possible validity of about a week. Remember, the TA chart is a tool only to help you adopt the right strategy. It is not a way to foresee the future. No one and nothing can.
For further details see:
Halliburton Q2 Earnings: Expecting Weaker Results In H2 2023