CA - Horizon Kinetics Q3 2023 Commentary
2023-11-10 07:00:00 ET
Summary
- Horizon Kinetics LLC, founded in 1994, is an independently owned and operated investment adviser. With a long-term absolute return mindset, and based on first-hand research, our portfolios tend to be concentrated and avoid tracking or mimicking any benchmark or index.
- How do securities exchanges compare to traditional stock and bond indexes in terms of profitability and growth?
- What are the potential risks associated with monetary debasement and commodity supply shortages?
- How does contingency investing differ from traditional market projections, and why is it important in today's market environment?
It’s the Busy Season for Financial Market Projections
It’s the Fall back-to-business season for financial market projections. For economists and market strategists to ensure that timely shifting or tweaking of asset allocation models isn’t neglected. There are concerns about ordinary business-cycle issues, though nothing too dramatic.
The portfolio positioning uncertainties mostly revolve around a few macroeconomic scenarios. Although ambiguously defined, they generally seem to run something like this:
- Higher for Longer
- Hard Landing
- Soft Landing
Higher for Longer refers to the Federal Reserve maintaining short term interest rates at today’s 5 ¼% or so for longer than previously projected. The intent is to suppress economic activity – which has been more resilient than expected – sufficiently to alleviate inflationary pressures. Just enough to take the edge off. It envisions a mild economic slow-down or recession.
This current interest rate level equates to a much higher cost of capital for corporations, whose embedded cost of debt is far lower, having originated in the near-zero-interest rate years. Profit margins and credit ratings could be pressured as maturing debt is refinanced at twice the old rates. What are perceived to be interest rate sensitive sectors, like yield-oriented and debt-leveraged real estate and utilities, could suffer. So, too, could the P/E ratios of high-growth companies, since the present value of their far-in-the-future earnings is much lower when calculated at a 5% cost of money rather than, say, 2.5%. Nevertheless, corporate revenues might be resilient, depending on their particular end markets, which, naturally, will impact which growth or value sectors strategists will choose to emphasize.
Clearly, to be optimally positioned, some portfolio adjustments are in order.
A Hard Landing scenario entails yet tighter monetary policy and higher interest rates. This would create a severe recession and pose a systemic risk to many parts of the economy. Tax receipts would fall coincident with rising social support payments, causing Federal and State budget deficits to balloon. That damage would in turn force the central bank to not only reduce interest rates again but to resume quantitative easing programs to support market liquidity (by buying publicly traded debt). Corporate revenues and earnings will be challenged across industrial sectors.
Quantitative easing, though, requires that the government have the money to buy publicly traded debt. But the government has no money to do so. This is a known fact, because it has a run-rate annual budget deficit of $1.9 trillion. So that money will have to be created, which is something the government does have the power to do. The end result would surely be resurgent monetary-based inflation. The interim path, though, is far less certain, and will likely to lead to declines across nearly all risk assets. All the while, of course, economists and strategists will be updating their models and recommendations.
The Soft Landing possibility is considered the most ideal: economic activity subsides sufficiently to eliminate all structural inflation drivers without inducing a serious recession. This would permit the Fed to reduce interest rates, and the world to revert to a 2010-2019 environment of low interest rates, low volatility and minimal inflation. Corporate revenues will be supported by strong consumer demand for goods and services, greater government spending capacity and lower debt service pressure (that is, interest expense).
This would be supportive of corporate profit margins. And bonds, being rather cheap now (having fallen so much these past few years), would correlate well with stocks (i.e., go up) as this environment develops, an environment also ideal for profitless technology and high-valuation growth companies. [ Editor’s note: It has never been definitively proven that powerful nostalgic yearnings have any measurable impact upon economic outcomes.]
A few observations about seasonal financial market scenarios
Observation 1
Success depends on choosing the correct scenario and properly reorienting a portfolio. If the scenario is determined to be favorable for an extra allocation of so-called risk assets, like growth or emerging markets stocks, then not selecting the correct scenario results in a poor relative or benchmarked outcome. Unfortunately, the success rate of economic predictions, if ‘kept honest’ by measuring from the initial projection to the end date, say from Jan 2nd to December 31st—so as to exclude the interim revisions that eventually converge with actual results—is so poor as to be indistinguishable from random variation around an historical baseline.
Observation 2
Whatever the current asset allocation changes, and whatever their odds of being based on the correct economic projections, they are intrinsically understood to have an operational life of only about six months to a year. A subsequent reallocation will shortly be required to accommodate the new economic changes that will be wrought by the impact of this most recent Fed interest rate and inflation scenario.
For instance, there are two schools of thought about the end of the Higher for Longer Scenario: at the end of this period, are interest rates then lowered modestly, or do they “fall off a cliff?” In either case, it will be time to rearrange the new portfolio configuration to accommodate that eventuality. The one certainty is that there will be work to do.
And none of these Fed policy centered conjectures and prospective portfolio activity incorporate the impact of other risk factors, factors that will be far more life-changing than whatever the Fed will or won’t do in the coming year. Such as the inflationary impact of structural commodity supply shortages; structurally rising debt government leverage and debt service obligations; changing national and regional bargaining positions in global trade and technology competition.
Observation 3
These asset allocation stances are, for the most part, implemented via index funds. Of course, if the index fund does not provide the presumed exposure, the allocation stance is not even a stance. One couldn’t say what it is or how it relates to the economic scenario it is intended to profit from or hedge against. If this wording is confusing, just one major asset class building block example will illustrate.
The MSCI All Country World Index covers the globe. The iShares MSCI ACWI ETF ( ACWI ), with $17 billion of assets, is designed to replicate it. ACWI includes 2,351 large and mid-cap companies from 49 developed and emerging economies, ranging from the U.S. and China to Qatar, Peru and Malaysia. 1 In principle, it epitomizes the all-inclusive “own the market itself” passive participation approach to investing originally dreamt of by the father of indexation, Jack Bogle. A sufficiently diversified index can largely eliminate security-specific risk and permit long-term exposure to corporate value growth—in this instance, global corporate profits—in the most efficient after-tax risk/reward context.
As an aside, when Mr. Bogle constructed the first S&P 500 index fund in 1976, it was, unlike today’s version, a substantially fair representation of the breadth of the U.S. economy. A U.S. fund was the best he could feasibly do, though even that was first thought to be technically unfeasible with the computer technology of the time. The first emerging markets equity fund was another decade off 2 .
This discussion about how to address the Fed’s interest rate and monetary policy must be in the context of index and ETF-based investing, because that’s where all the fund flows have been directed for the past couple of decades. That’s where the money is. Yet, it is a contradiction in terms: A reactive, interventionist use of indexation implicitly rejects Mr. Bogle’s conception, particularly two of his ever repeated Ten Rules of index investing 3 :
- Rule 3: Buy Right and Hold Tight . Meaning, establish the proper asset allocation and change it not in response to market outlook or cycle, but only relative to one’s own investment profile, such as a change in income need or time horizon.
- Rule 10: Stay the Course! Among the admonishments against transacting was to not try to forecast the unforecastable, but to maintain the discipline to avoid repositioning in response to external factors and any presumed value in gaming them.
These two rules can really be consolidated into one: avoid the alluring, evergreen trap of reacting to or anticipating events that are felt can be traded profitably. As statistically demonstrated over time, that approach is not repeatably successful and ends up eroding returns. Can an individual successfully do so?
Sure. Can some handsful out of millions do so? Sure. Can market participants generally, or even a modest fraction, do so? Decidedly not.
Almost the entirety of investment trading, again statistically verifiable, is a zero-sum game. The only consistent class of beneficiaries over time are the fee-takers or croupiers of the trading markets. As an ‘asset class’ that doesn’t exist in the world of indexation (more of which later in this Commentary ), the croupiers benefit munificently from economic scenario-based portfolio positioning and repositioning.
Back to ACWI, which is the intended final point, and keeping in mind that this index is supposed to provide, per its formal description, “exhaustive coverage of the relevant investment opportunity set” of global equity exposure.” 4 It covers about 99% of the float adjusted market capitalization in each country. Let’s take that to mean that it is supposed to reflect some reasonable proportional representation among nations.
These following descriptive statistics are based on the iShares MSCI ACWI ETF (ticker ACWI). For context, its $17 billion of AUM puts ACWI in the top 2 or 3%, by assets, of the 3,287 U.S. traded ETFs 5 . It’s a major asset allocation building block.
-
- U.S. companies are 62.6% of market value of the ETF.
- All of the 10 largest holdings (of 2,351) are U.S. companies:
- Apple, Microsoft, Amazon.com, Nvidia, Alphabet, Tesla, Meta Platforms, United Health, Eli Lilly, and ExxonMobil.
- Eight of the next 10 largest holdings are U.S. companies. The two non-U.S. positions are Taiwan Semiconductor and Novo Nordisk.
- The U.S. population ‘weighting’, globally, is 4.2%. 6
- The U.S. GDP ‘weighting,’ globally, on a purchasing power parity basis, is 15.4% 7
- The Chinese weight in the ETF, by the way, is 3.1%, lower than both the U.K. and Japan.
How to explain that the U.S. exposure is 4x its economic contribution to world GDP? It is true that U.S. companies are far more profitable than Chinese or Indian or even Japanese companies when viewed on a net profit margin basis. Nonetheless, the profits are already captured in GDP. The bizarre U.S. exposure is because market capitalization is what determines the index weightings.
But market capitalization is not an objective measure. It’s not an economic or financial factor one might select for in an all-country index. It’s not even an objective measure of earnings. Market cap only reflects the price that investors have subjectively placed on those earnings—whether they prefer to pay 12 years’ worth of earnings, at a given moment, or 22 years’ worth.
ACWI, like all the major indexes, uses a market-cap based weighting methodology. Paradoxically, the more overvalued a company gets, the bigger its market cap, and the greater its weight in the index. By trying to buy global exposure in some economically proportional manner, one is actually getting excess exposure to the U.S. equity market. Moreover, exposure that is greatly overvalued relative to the other economies.
That is surely not what a buyer intends in an ACWI allocation. But, just as surely, buyers cannot be unaware of the weighting and exposure distortion. The explanation for this indifference is that today’s index investor implicitly accepts this reality as axiomatic. The index is always right, because the index is the return benchmark. If it does poorly, that is not perceived to be a flaw, as it would be with an active manager, it just represents (or, more accurately, is thought to represent) how a market or sector performed.
The only answer to the paradox is to benchmark the index against an external measure, like what one can earn from a Treasury Bill, or by how much it exceeds a cost-of-living index. There is not much public discussion about whether any major index is appropriately constructed or should itself be benchmarked, or should be radically amended or replaced, like an active manager.
ACWI is but one of innumerable examples of perverse distortions in index exposures. Without wading further into those waters, it should be sufficient to make the meta observation that the two-decade accumulation of capital into index funds has been so massive (meaning demand), that there is an exceedingly small population of companies of sufficient market capitalization (meaning supply) to absorb that flow of funds. That small contingent of large-cap and mega-cap companies accrue the bulk of that money, ultimately expressed in market value that crowds out the remainder.
Brief DiscursionFor the curious, the since-inception annualized return of the first emerging markets fund, the Templeton Emerging Markets Fund has been 9.7%1. Since 10% is the historically accepted and expected rate of return for U.S. equities, one would think that 36 years of emerging markets investing, with greater across-the-board risks (sovereign, governance, financial accounting, currency, liquidity) would have produced a more generous result. More curious still, if the first 10 years are eliminated, the 26-year return, from Feb 1997 to Aug 2023 is only 5.6% per year, while the rate of return for U.S. equities, at 8.6%, was 50% higher. Some of the interesting reasons for these departures from expectations have to do with the details of index construction: what goes in and how those securities are weighted, and what is left out or excluded. It’s a fascinating discussion, but a discussion for another day. 1 Since inception date: 2/26/1987. As of September 30, 2023 |
Ergo, across the index spectrum is found the top-heaviness problem, with dramatic concentration and exposure distortions relative to what they purport to provide. It is impossible to achieve intended allocations by relying on the label descriptions. One must understand what’s ‘under the hood’ to make an informed assessment. Paradoxically, that is, by definition, active management.
Observation 4, Which Gets its Own Section
Believe it or not…the whole prior discussion…ignore it. At least a little. It began with a false premise: The main market return scenarios that revolve largely around the Federal Reserve’s anticipated monetary policy tactics. Those scenarios revolve around many decades of business cycle behavior and market valuation ranges that are presumed to be reliable patterns with reliable reversions to known means.
But what if these scenarios completely misapprehend, don’t even have the tools to recognize, more important risks? Factors beyond the Federal Reserve’s control? What if there are factors in operation that can meaningfully alter the business cycle patterns and valuations of the past several decades? In that case, the models, the asset allocation adjustments, the tools to implement them, could be irrelevant at best, disastrous at worst.
Those familiar with us are familiar with two major sources of serious inflationary risk that are not yet in the public discussion or conventional economic projections. Perhaps it’s because the U.S. economy hasn’t faced them before in the manner now posed, so it’s not available as learned history.
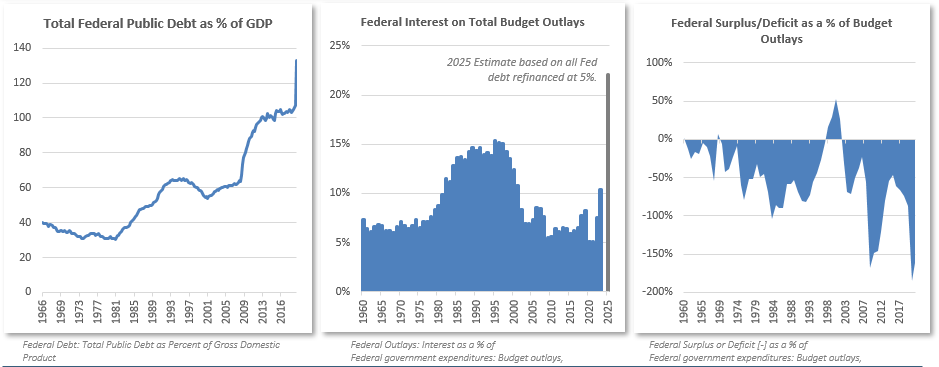
- One is serious monetary-based inflation. That’s because there has never been this much Federal debt relative to GDP. Nor has the prospective debt interest expense ever been this high relative to the budget: the market interest rate on Treasuries is twice the embedded rate on notes and bonds that will be refinanced. And since the average maturity of all that debt is probably shorter than it has ever been, that refinancing will be happening pretty soon.
- The other is hard-commodity based inflation, which might occur on a scale the U.S. has not faced before, because the country has never faced a shortage of commodities. There were short-term cyclical supply shortages, like the OPEC oil embargo in 1973, but the physical supply capacity existed. Now, the world is approaching a decade of disinvestment by oil companies, and base metals and precious metals miners during what was a period of excess capacity. That disinvestment took the form of reducing capital expenditures and not fully replacing each year’s production with new reserves. That shortage can’t be corrected in a year, not in five.
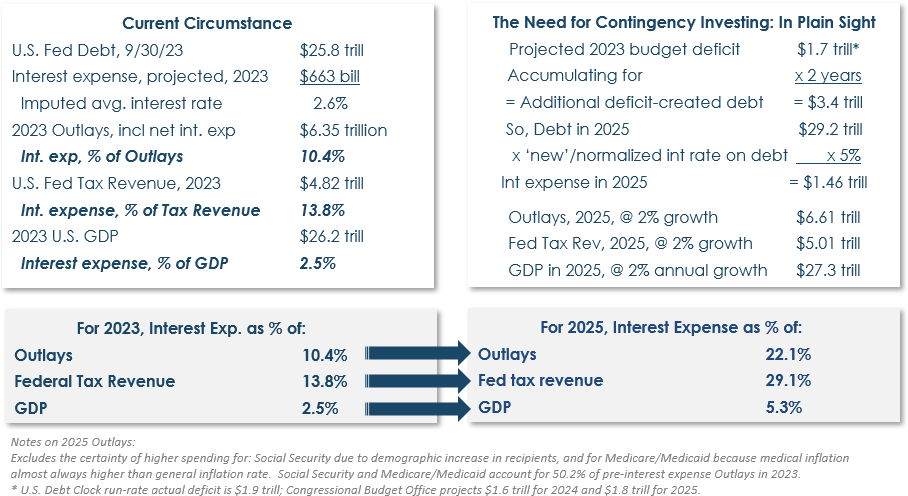
What is the magnitude of the encroaching monetary debasement/inflation risk? A very brief table will take the place of the lengthy exposition we’ve run through for the past few years. It paints the same picture. With fewer words.
Source: Treasury.gov. As of September 30, 2023.
A bit of information that is important in order to understand the table:
-
- The current average interest rate on the Federal debt is 2.6%.
- The yield on Treasuries almost across the maturity spectrum is now 5% or so, meaning that as existing debt matures, the cost of borrowing will double.
Roughly half of all the publicly held Treasuries outstanding today will mature by the end of 2025. By 2028, almost 70% will have been refinanced. That is happening.
These figures impart a few impressions:
-
- How simple they are to get. They are publicly accessible. Go to the Congressional Budget Office website ( www.cbo.gov ), click on the Budget icon, and just about all the basic figures you could want are right there ( www.cbo.gov/publication/59096).
- Yet, almost no one looking at this page now has heard them seriously discussed on financial radio, television or in financial newspapers.
- But, how can that be? Unless the facts and the basic reasoning are completely erroneous, the implications for investment portfolios are incomparably more dire than what the Fed will or won’t do this year, or whether S&P 500 earnings will ‘beat’ or miss.
One answer to why interest on government debt is not considered to be potentially problematic in the modern era might be that interest rates are thought of as a policy tool. An increase in interest rates orchestrated by the central bank is an action that is thought to moderate economic activity. But it can’t do so if the debt and interest expense burden reach a tipping point such that they increase more rapidly than the economy can grow.
The most important reason for indifference to these scenarios—one observer’s opinion—is simply because they haven’t happened yet; they might even be counter to trend. They’re an assertion of events not yet in evidence. “Come back when you have something to show.“
In one sense, while that response seems naïve, it’s actually a reality-based view, if you depend on personally lived experience for knowledge. In which case, there’s no need for historians and the stuff they write. One can as easily say, “Look, see that pile in the basement near the boiler, where everybody keeps putting their old newspapers and paint rags? Well, nothing’s ever happened, not in the last 40 years, so stop worrying.”
Except, historical reality is pretty clear about the eventual fire risk of oily rags, which here means an excessive piling of budget deficits and money supply. The Q1 2023 Commentary contained this graph, showing that almost 60% of the all the major hyperinflations in recorded history have taken place since 1990. 8 The attributed reason is that after the world abandoned the gold standard in the 1970s, a decade or two was sufficient time for central banks’ unconstrained paper money printing to result in excessive currency debasement.
Maybe not a lot of people read Professor Bernholz’s book. But a New York Times Bestseller in 2009, with a 13th printing in 2011, showed the same lessons.
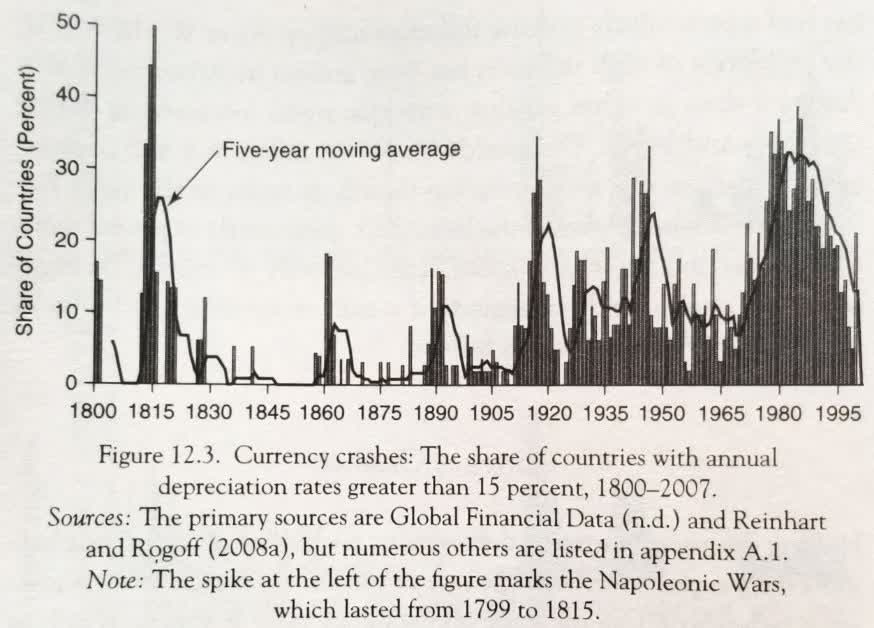
This Time is Different , by Carmen Reinhard and Kenneth Rogoff, details 800 years of financial crises. One of their graphs shows how common serious currency debasement is. 9 The global incidence of annual currency depreciation rates above 15% likewise rises dramatically starting in the 1970s.
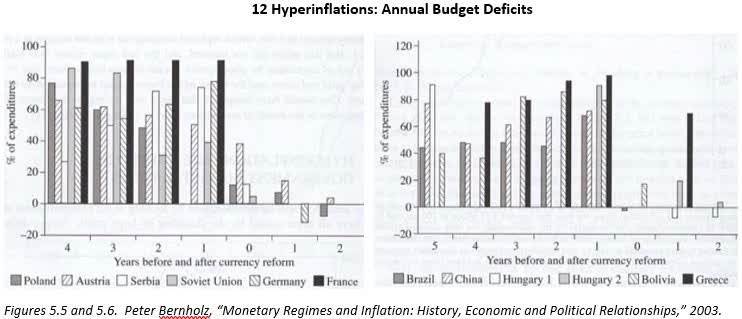
Many people don’t associate the word inflation with monetary debasement, but they should. If they understood that the latter begets the former, they would be more alarmed by the pending upward trajectory in Federal interest expense, the budget deficit and, in turn, the rate of new money creation. Professor Bernholz 10 puts the proximate* cause of the hyperinflations as sustained excessive budget deficits, largely financed by money creation.
| * “Proximate,” as in what’s not noted on death certificates: The gunshot wound that caused the blood loss that caused the heart failure that is recorded as the cause of death. |
The chart below identifies 12 nations that experienced hyperinflations, along with their budget deficit histories. They run the gamut from China and the Soviet Union to Germany and France, to Brazil and Greece.
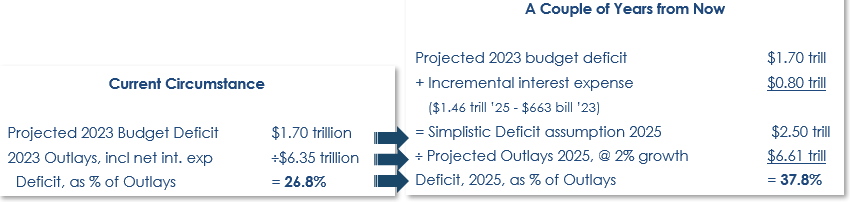
The U.S.? Today the U.S. budget deficit is 25% of Federal spending, as per the earlier table. That’s only about half-way to the levels associated with those 12 nations that experienced hyperinflations. But the figures developed in another exercise below, as oversimplified as it might be, puts the U.S. budget deficit in 2025 at 38% of spending, right up there with the dirty dozen. 11
Segue
| Of the many hundreds of different currencies in history, all of them eventually collapsed, including some three dozen just between Ancient Rome, Ancient Israel, and Greece. |
The entire discussion to this point was to prep for this summation and proposal.
It’s understandable that people don’t fear something they haven’t experienced in their lifetimes; it seems like something that doesn’t happen anymore. In the U.S., a hyperinflation hasn’t occurred since 1779, when America was an emerging market and, at least for the Confederacy, since the Civil War. 12 That makes domestic hyperinflation seem all the more implausible, particularly since you don’t hear about it from the ordinary informed sources. But not everything can be lived knowledge; some of it has to be reasoned.
Data and reason suggest that the U.S., like every nation in recorded history ultimately did, has reached a tipping point in its financial accounts, which are not in order. The numbers are there. They suggest that a level of money printing beyond lived experience is drawing nigh, with potentially severe inflationary consequences for the unprepared.
Preposterous! you say. Or maybe you just say that the foregoing analysis is flawed. Or that it’s possibly correct, but changes in the economy or fiscal and monetary policy responses will invalidate it. Okay. But does that mean your investments shouldn’t accommodate that possibility?
What if there were only a 10% chance that the analysis proves correct? Do you play that game of chance and accept the consequences as fate? Isn’t that what diversification is supposed to guard against? Investment professionals are expected to practice and recommend such diversification as a matter of reasoned prudence.
It is acknowledged imprudence to parsimoniously avoid paying the few-thousand-dollar annual premiums for life or homeowner’s insurance. Even though such insurance is predicated on the extreme unlikelihood of a major risk coming to pass. One pays because its arrival might be catastrophic in the absence of contingency planning.
So, we’re talking about contingency investing. How does one prepare for events that haven’t and might not happen, yet will cost dearly if and when they do? Something broadly systemic, like severe monetary inflation or something more narrowly systemic, like a wave of technology displacement that would wreak havoc on the mainstream indexes? The confidence level might be low, but the impact would be high. It requires a different approach than standard economic and market modelling, which typically attempt to forecast the development of events that are already known and much discussed and with presumed confidence.
Alternatively, how to prepare for events, even if broadly anticipated, that might require assets or instruments that are not represented in the indexes or allocation models?
Those are the kinds of investments we have been endeavoring to make, and have been making more of them as an extraordinary variety of long-quiescent systemic risks seem ever closer to manifesting themselves. In this Commentary, closer attention will be paid to a sector that has been lightly touched on before, and a new and important asset class will be reviewed. New asset classes aren’t born every day.
Before we go… somehow, there are more emerging risks that the preceding scenarios didn’t capture, but which are as important. And they can’t all be explored at once.
So, for now, this Risk Watch Box serves as a reminder of some (but not all) topics to pay attention to.
Risk Watch BoxBRICS Trading Bloc Expansion : Risk of de-dollarization of hard commodities and loss of U.S. reserve currency status: extreme inflation risk. Chinese Competition: Largest companies now expanding from domestic market and export, to global expansion and direct competition with U.S. corp. customers. Rising (Climate) Catastrophe Losses : Private sector inflation (insurance costs) & Fed budget deficit impact (Disaster Relief Appropriations). Banks I : Commercial Bank Deposit Drain: Continued disintermediation while Fed-mediated short-term interest rates exceed deposit rates. Banks II: Pending Commercial Real Estate Debt Refinancings One Interest-Rate-Based Inflation Chain (of many) : Higher mortgage rates, higher home prices and, via higher landlord costs, higher rents. Housing/rents = 1/3 of the CPI. |
Fun Details Appendix
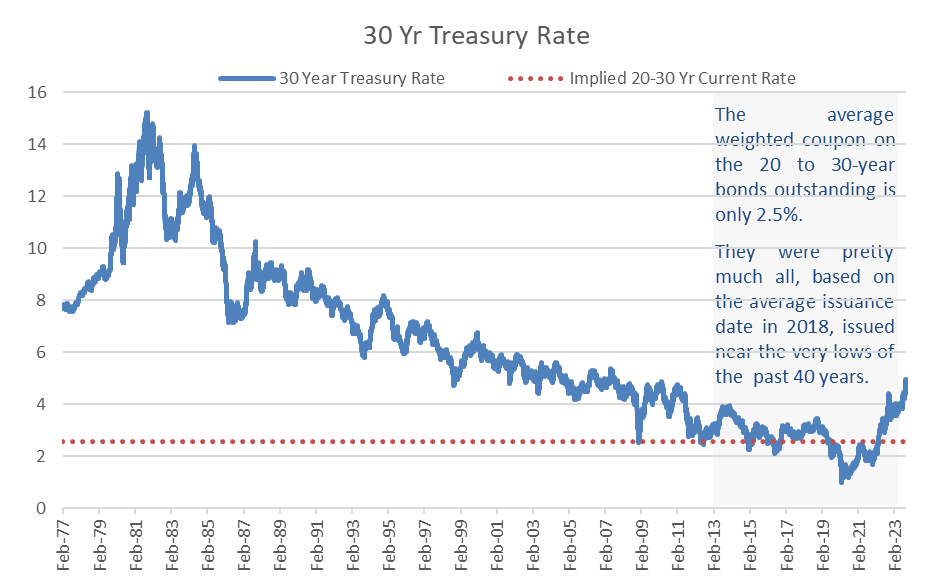
Fun detail about the through-and-through impact of the Federal Reserve engineered decade of near-zero interest rates. The weighted average interest rate on the Federal debt is 2.6%. But that’s not just for short and intermediate-term maturities.
The average weighted coupon on the 20to30-year bonds outstanding is also only 2.5%. They were pretty much all, based on their average issuance in 2018, issued near the very lows of the past 40 years.
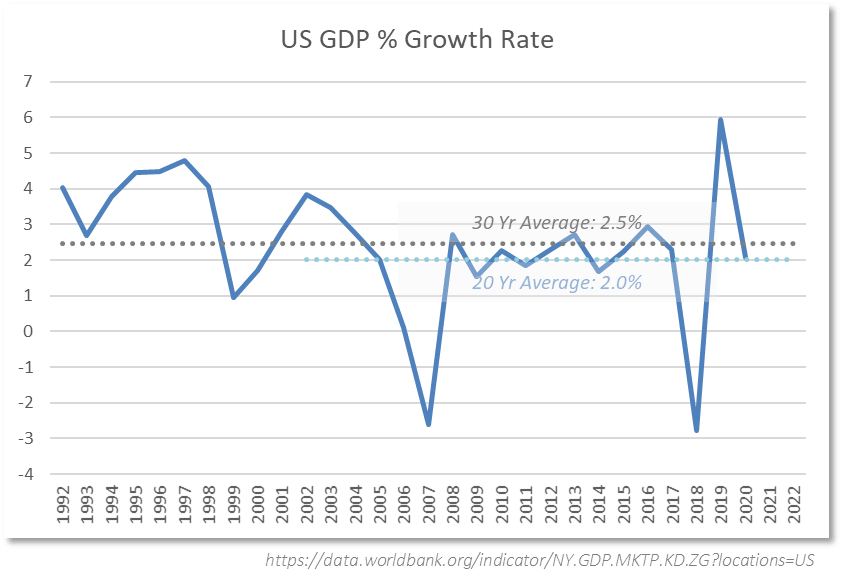
Regarding the government’s (the OMB’s) financial projections, they presume that GDP will be expanding at about a 4.4% annual rate. We took the liberty of presuming only 2% annual growth. If pressed to defend this, we will rely not on counsel, but on pictures like this:
Segue II
You’re familiar with our employment of royalty companies, of which Texas Pacific Land Corp. ( TPL ) is but one. Unfortunately, the focus on TPL, in some small circles, might obscure the message about the important investment attributes of the royalty business model. Other than on this page, though, this Commentary will not dwell on royalty companies. They are raised only as a segue into an allied, asset-light business model: securities exchanges. In some ways, securities exchanges might be superior.
While a royalty company has even higher profit margins than exchanges, it is much narrower in scope. A royalty exposure might be to silver, or iron ore or, in the case of TPL, oil and natural gas. The exchange’s countervailing positive attribute is its extraordinary breadth of exposure. Additionally, like a royalty company, exchanges have substantially no balance sheet vulnerability, since the business requires no borrowing, and their cash operating profit margins are so high.
They are surely deserving of closer study.
Securities Exchanges as an Important (and index-unavailable) Asset Class
For a single asset, like gold or oil, a royalty is the quintessence of asymmetrically positive economic exposure.
For a diverse array of physical assets and financial assets and activities, it is a securities exchange that gives the most asymmetrically positive exposure. Exchanges participate in almost every economic activity that becomes sufficiently large to operate on a national and global scale. They get to participate because business activity on that scale requires the ability to hedge and transact on a wholesale, transparent, and secure basis that only a centralized and regulated marketplace offers.
It is for this reason—as the croupiers for global financial transactions and risk control activity—that exchanges provide unparalleled participation in the overall expansion of trading activity, monetary inflation and even technological innovation. Technology? A new technology that wins the lottery-ticket odds necessary to reach critical economic mass will almost necessarily find its way into exchange activity. 13
Like a royalty company, a securities exchange is a form of croupier, always taking a share of the action without the heavy capital investment, operating risk or financial leverage that its customers take on. The exchange’s value is in providing the venue and the associated data services. Which is why their profitability is exceeded only by royalty companies. The difference between the two is simply that exchanges have a higher staffing requirement: for maintaining their computer trade matching and information platforms, and for financial oversight and reporting, which includes constant interaction with regulatory agencies.
Why devote most of a Commentary to securities exchanges? Even though we’ve provided charts in the past showing how much more profitable they are than even the great IT growth companies, that’s not as good a foundation as it could be for recommending a core asset allocation against the contingent risks identified earlier. It’s pretty good, but not good enough.
Simply being plied with charts of comparative profitability or growth rates or stock returns, even with 5or 10-year comparisons, is impressive only for the moment. That’s the way indexes are constructed: on the basis of descriptive attributes (like P/E, market cap, trading liquidity), but no predictive attributes that tell you why any of it is repeatable and will persist.
Implicit in plying someone with some figures of the moment that will have to be refreshed at the next meeting, is the message that these are temporary facts. Facts get forgotten. A different approach is to show how and why those figures of the moment—a profit margin, an annual growth figure—persist. What you learn , you don’t forget.
Now, through a walking tour of historical numbers and outcomes, why exchanges are a unique business model and economic hedging tool.
Long Term Growth Persistence
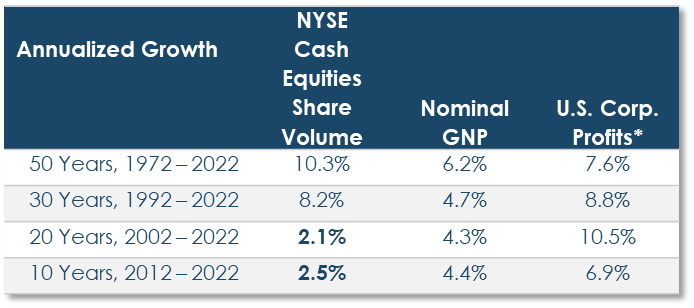
The New York Stock Exchange is what people typically think of as the ‘stock market’. For the last 50 and 30 years, stock trading volume expanded far more rapidly than GDP. Share-trading growth also far exceeded corporate profit growth over the 50 years, and slightly below corporate profit growth over the 30 years.
| Annualized Growth |
| NYSE Cash Equities Share Volume |
| Nominal GNP |
| U.S. Corp. Profits* |
| 50 Years, 1972 – 2022 |
| 10.3% |
| 6.2% |
| 7.6% |
| 30 Years, 1992 – 2022 |
| 8.2% |
| 4.7% |
| 8.8% |
| *After tax, non-financial corps. Source: NYSE, Federal Reserve Economic Data | FRED | St. Louis Fed |
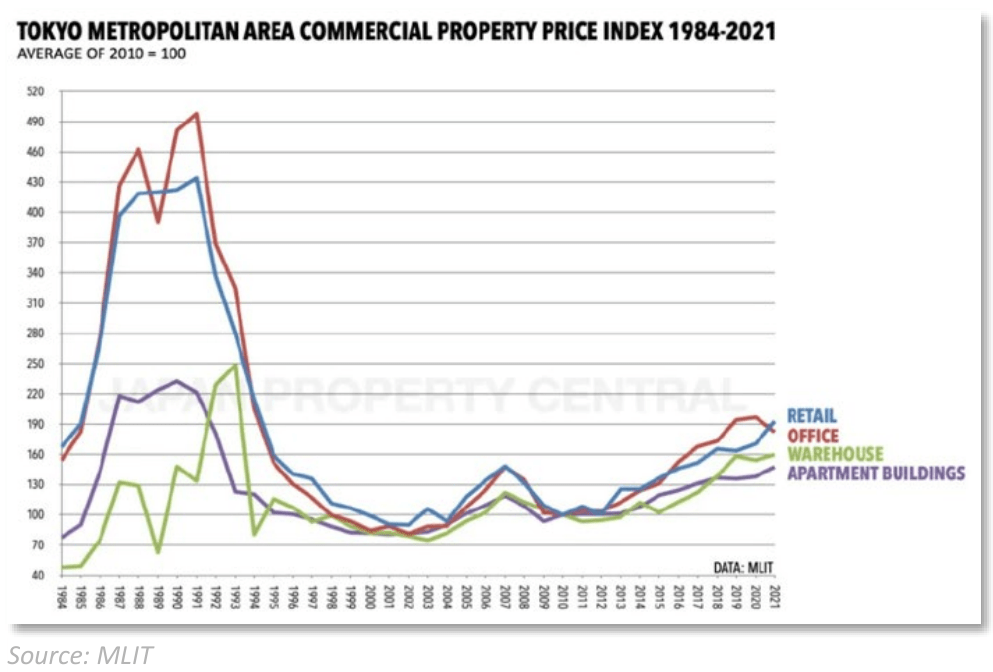
This result is not unique to the NYSE or to the U.S. Let’s compare against the national exchange of a developed economy with about as different a modern history from the U.S. as possible: Japan. A hint of the difference is depicted in the accompanying chart of the 30-year collapse and stagnation of the commercial property market in Japan, from which it has only recently returned to breakeven. Same for its stock market.
Nevertheless, stock trading volumes on the Tokyo Stock Exchange over the past 30 and 40 years have been almost incomparably greater than GDP growth, which was essentially nil during the last 30 years. Almost as if the one bore no relationship to the other.
Historical Profitability
As to tracing the historical profitability of the NYSE, that’s impeded by the relatively recent demutualization of stock exchanges from private ownership by their seat holders. The NYSE didn’t come public until 2006, and its subsequent financials are somewhat discontinuous due to its 2007 merger with Euronext, and the resulting NYSE Euronext being acquired in 2013 by the Intercontinental Exchange.
An untrammeled look at the NYSE’s profitability can be had in the 18-year period preceding its demutualization. A seat purchased in 1985 could have been sold in 2004 for $1,150,000. Moreover, seat holders who didn’t trade for themselves would lease them out to professional traders. The annual lease rates averaged about 13% of the seat prices. That’s an indication of the minimum profitability of a seat, since a trader would have to expect to earn sufficiently more than 13% to make leasing worthwhile. Leased out, a seat would have collected $3,120,000 in rental income. The combined seat price and lease income cumulated to 10.7x the purchase price, for a 19-year annualized return of 13.3%.
This is not the same calculation method as for equity index returns like the S&P 500, which assume tax-free and friction-free reinvestment of dividends. The indexed cumulative return of that $400,000 seat would have been $12.3 million, a 30.7x increase, or 19.7% per year. The S&P 500, over the same period, returned 12.2%. 14
Immediately thereafter, in April 2005, the NYSE announced a merger-acquisition transaction with Archipelago Holding 15 . NYSE seat owners were offered $5,050,000 per seat, primarily in Archipelago shares. 16 In November 2005, NYSE seats sold for $3,500,000. Given that seats were priced at $1,150,000 at year-end 2004, the merger premium value was 4.4x the private market value of only four months prior.
Correlation Independence and Earnings Persistence
The exchange business should, in principle, be able to maintain its profitability even amidst market volatility, so long as trading volumes are maintained. Or even benefit, if volatile market conditions come with greater trading volume. If so, this would be a very valuable asset allocation feature. In finance terminology, correlation-independence versus other asset classes is very difficult to find, and inverse correlation is particularly cherished.
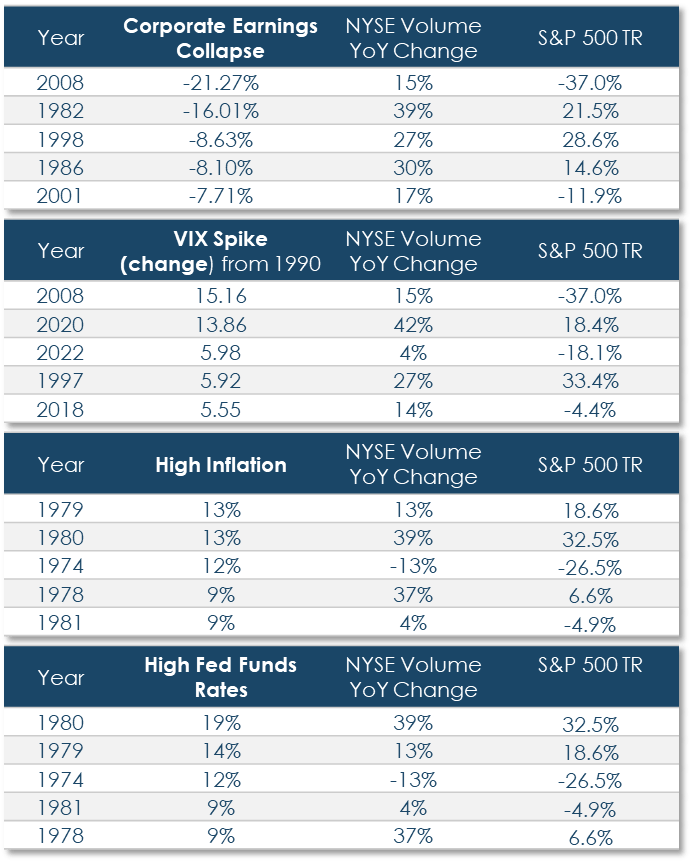
To test this proposition, a brief search was made for classes of untoward events that are associated with serious or calamitous economic and market outcomes. The accompanying table lists the five most serious instances of each of four types of such events since 1994. Each is measured on a January to December calendar year basis, which will produce far less extreme results than the peak to trough experiences were:
- A corporate earnings decline or collapse 17 ,
- An inflation spike 18 ,
- An interest rate (Fed Funds) spike 19 , or
- A spike in the VIX (stock market volatility). 20
Some of those events overlapped. For instance, in 1979, there was a spike in both year-over-year inflation and short-term interest rates. Of the 20 total periods, there were 14 without overlaps. The S&P 500 declined in six, or 43% , of those 14 years. Those calendar-year losses were much less severe than they would have been if measured on a peak-to-trough basis. Nevertheless, they were -37%, -27%, 18%, -12%, -5% and -5%.
Yet, trading volume on the NYSE dropped in only one year. For the other 13 years, the average increase in annual trading volume was 24.3%. That’s roughly twice what the normalized annual increase was during those few decades. Which is to say, NYSE trading was most robust specifically during the worst economy-wide and stock market years of the past four or five decades.
Long-Term Growth Persistence II – A Better Version
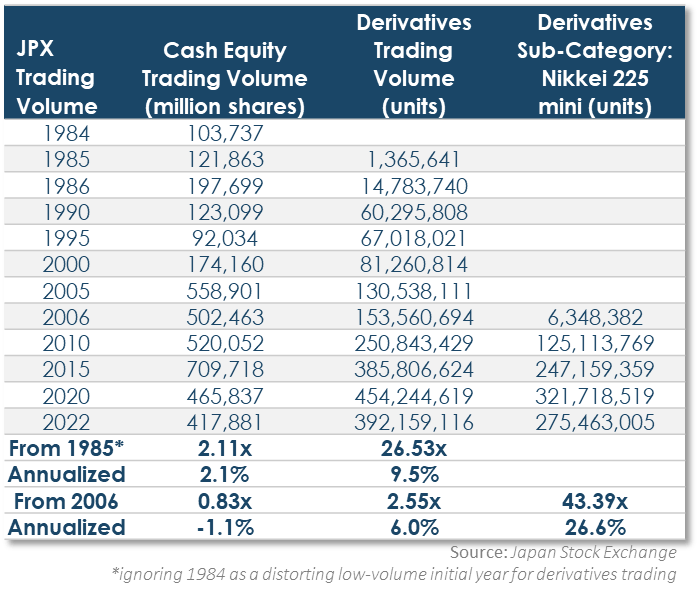
The prior statistics about the long-term growth of share trading volumes on the Tokyo Stock Exchange (JPX) was somewhat misleading. It showed the 40and 30-year results, but in the most recent 20 years and 10 years, the growth in trading subsided and eventually contracted.
But this doesn’t mean JPX wasn’t growing. Beginning in 1985, derivatives began to trade. While stock trading rose 2.1x between 1986 and 2022, derivatives volumes exploded, rising 26-fold. 21
That shift illustrates why ‘stock exchanges’ in the classic sense hardly exist anymore. They evolved into ‘securities’ exchanges.
The NYSE is no exception. It is now only one line of business within the Intercontinental Exchange, which acquired it in 2013. Within the Exchanges Segment of ICE, cash equities and listings account for only 22% of revenues. And even that figure includes equity options, which were not part of the traditional business. The rest of ICE’s revenues are from futures, options and other derivatives, and data services.
That kind of acquisition activity was endemic to the industry. The exchanges only began coming public in the 2002 to 2010 period 22 , but almost immediately began to consolidate, because the pure financial economics of combining two sets of trading volumes onto one computer platform is so highly accretive to profit margins. The short-term benefit is that one whole set of technology and personnel costs may be dispensed with. Plus, there is important strategic value in having a diversified set of asset classes trading under one roof.
In fact, even if it hadn’t been acquired, the NYSE wouldn’t be a standalone stock exchange. Years before ICE bought it, NYSE was already intent on acquiring futures and options trading capabilities and venues:
- In 2007, a year after coming public, NYSE acquired Euronext, a relatively recent combination of several European stock exchanges. The real attraction of Euronext a 2002 acquisition of its own: LIFFE, the London International Futures and Options Exchange. LIFFE eventually became NYSE Euronext’s derivatives trading system.
- The very next year, in 2008, NYSE Euronext acquired CBOT’s Metals futures and options business, the trading of which could shift to NYSE Euronext’s recently acquired LIFFE derivatives platform.
Source: theocc.com/Market-Data/Market-DataReports/Volume-and-Open-Interest/Historical-Volume-Statistics *after-tax, non-financial corps
Similar to the Tokyo Stock Exchange example, the NYSE equity trading figures provided earlier were somewhat misleading. While the 50-year growth of trading volume was impressively robust, the past 10 and 20 years not so much. Yet, also similarly, that was not a sign of business malaise. Rather, common stock trading became increasingly displaced by newer trading products.
Futures and other derivatives, as they are now mostly thought of, barely existed prior to the 1970s. At that time, futures trading was for agricultural and hard commodities that could be delivered upon contract expiration: wheat, gold, pork bellies. Without exaggeration, there was no such thing as a financial futures contract. The first one approved was currency futures. Aside from it not even being a concept before then, once proposed it was highly controversial. Currency futures were thought exotic, and editorial commentary at the time even called them dangerous.
| What They Said* 1972, About the first Currency Futures: “The New Currency Market: Strictly for Crapshooters…if you fancy yourself an international money speculator but lack the resources…your day has come!” Business Week 1976, About the first Interest Rate Futures: “…the Chicago Mercantile Exchange tries to make money by being more outrageous than its rivals. Now that its currency futures market is well established…this month [it] opened a trading pit in U.S. treasury bill futures. Bidding for the government paper takes place on the same floor as for pork bellies, live cattle, and three-month eggs.” The Economist 1982(?), About the first Stock Index Futures: “Like their lightning-paced video game counterparts, stock index futures offer instant gratification or instant annihilation depending on the accuracy of your impulses and the quickness of your reflexes.” Barrons * Leo Melamed, “Escape to the Futures”. John Wiley & Sons, Inc., 1996. |
Dangerous how? Dangerous like it would allow traders and speculators to manipulate, or at least impact, exchange rates outside the control of governments, and thereby undermine economies and national sovereignty. Yet, the real need that would be served by currency futures wasn’t speculation but, just as for traditional futures trading, hedging or laying off of risk. Which serves real economic need, which is to say financial futures have real economic value
The U.S. left the gold standard in 1971, and as other nations did as well, currency exchange rates began to be less certain and more volatile. A currency future would allow a business to assure the price it would receive for goods sold in another currency, or of a liability it had to pay for. Foreign exchange futures was a new tool to reduce transactional risk, which should act to encourage economic activity, not speculation.
Still, it was controversial and required much political and regulatory maneuvering. Even so, it was easier to get approval for a currency future than an interest rate future, because at least currency contracts could actually be delivered in a tangible way. Cash settled futures for intangibles that couldn’t be delivered didn’t come about until interest rate futures were introduced in 1975. S&P 500 Index futures weren’t approved until 1982.
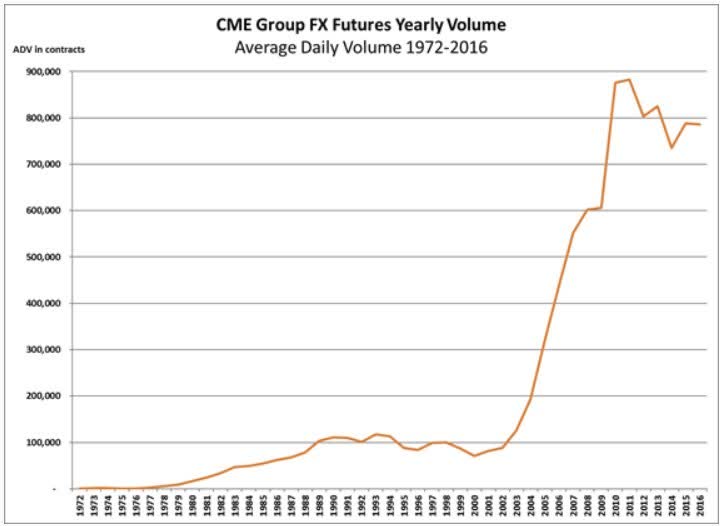
Since then, futures trading, across an increasingly dizzying array of assets and sub-classes, has come to dominate financial instrument trading. Because it suits the economic needs of participants, because these are superior tools for managing positions and risks than existed before. As with the Tokyo Stock Exchange, this can be seen in this series of charts from the CME marking the anniversary dates of various of its more successful futures contracts.
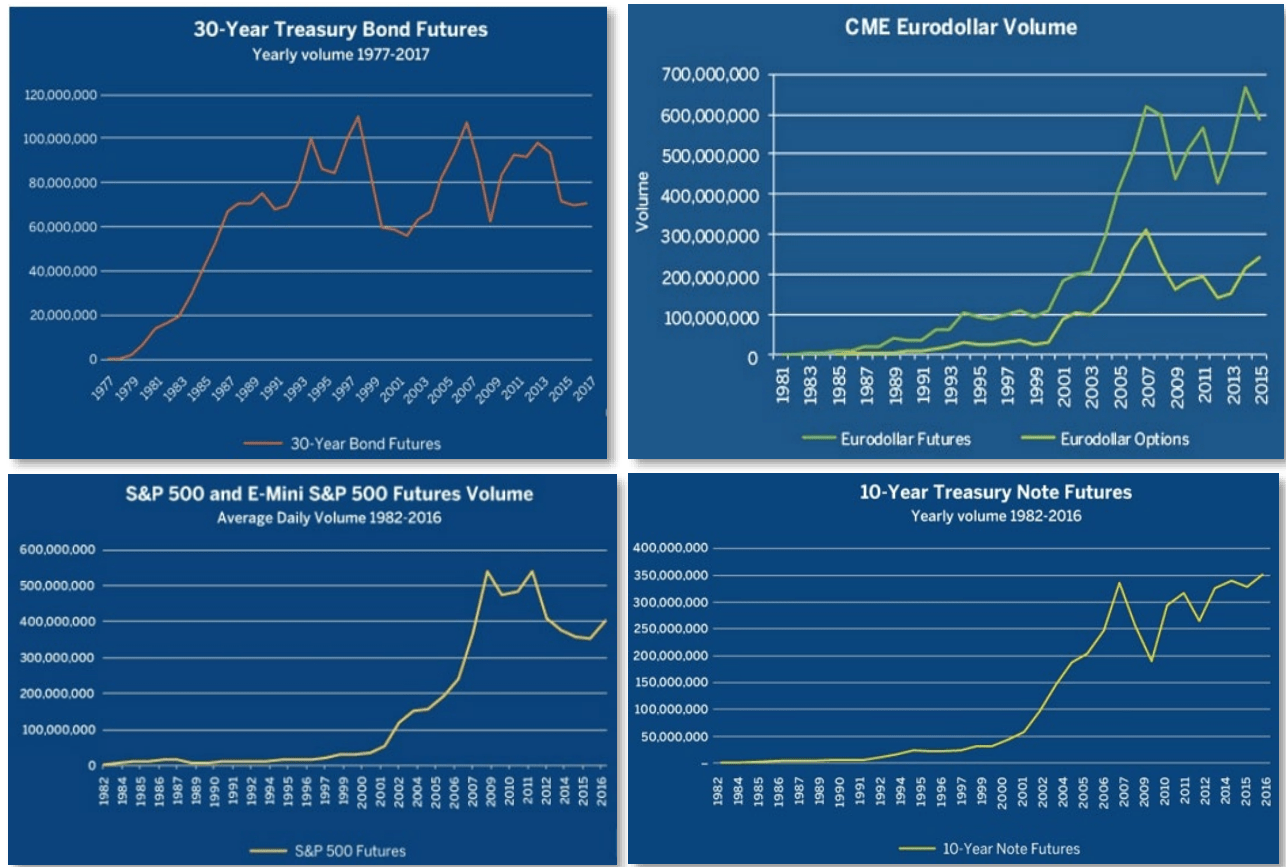
They all have the same look. Just to detail the first chart, of the very first financial futures in 1972: it took 15 years for FX Futures to begin approaching annual volume of 100,000 contracts. Ultimately, volume rose another 10x—a spectacularly successful financial instrument.
They’re all pretty much like this. And this selection excludes newer generations of innovative products, like volatility and, now, Bitcoin and Ether futures, not to mention single-stock futures and Contracts-for-Difference.
All of these were specific futures contracts listed on a specific exchange. The same picture can be seen on a national basis. This next chart from the Options Clearing Corp is of the sweep of historical volume growth in options trading across the U.S. exchanges. Options contracts must be cleared through the OCC. Over the 50 years from 1973 to 2023 (9-month run-rate) the annual cleared-contract volumes rose from 1 million to 14 million, an annualized expansion rate of almost 21%. Even the last decade’s growth rate was 12%.
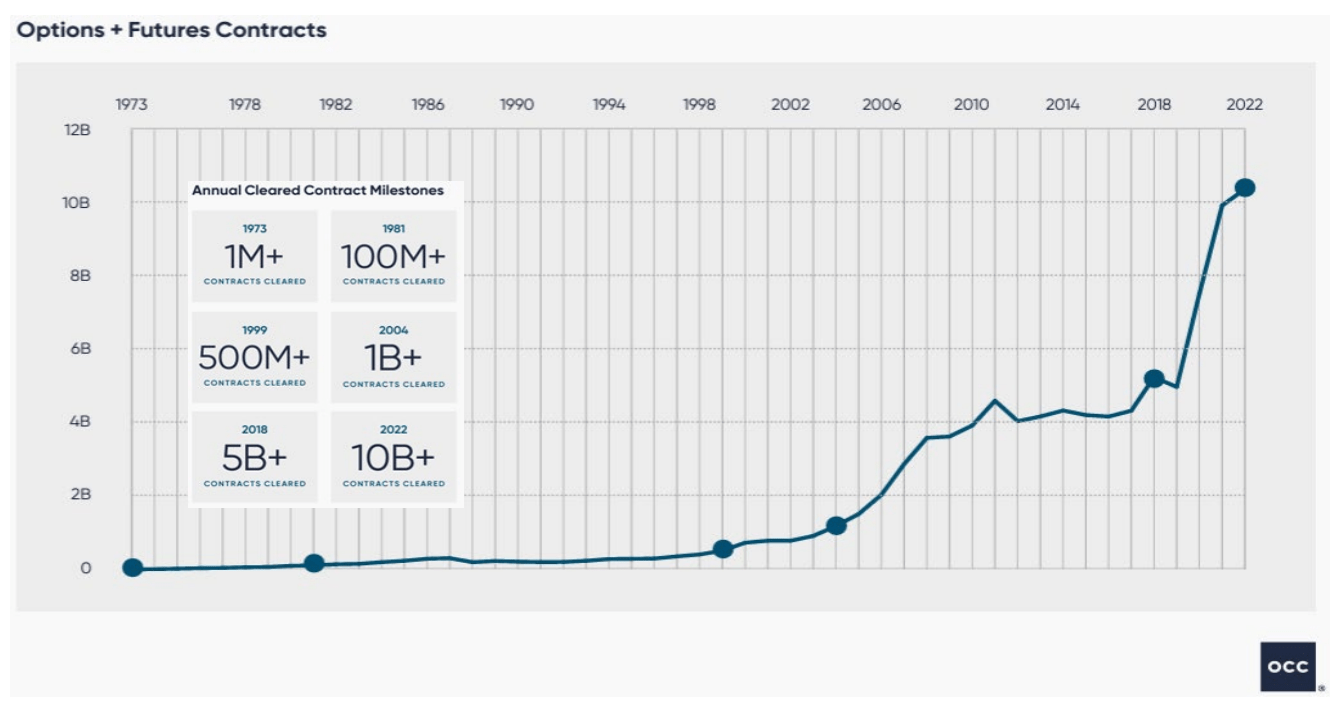
Economic Breadth and Diversification
The prior sampling of convenient charts from the CME, showed revenue exposure to currencies, short and long-dated Treasuries, and the S&P 500. That’s already three asset classes. Interest Rates is about the third largest category of exchange traded derivatives in the U.S.
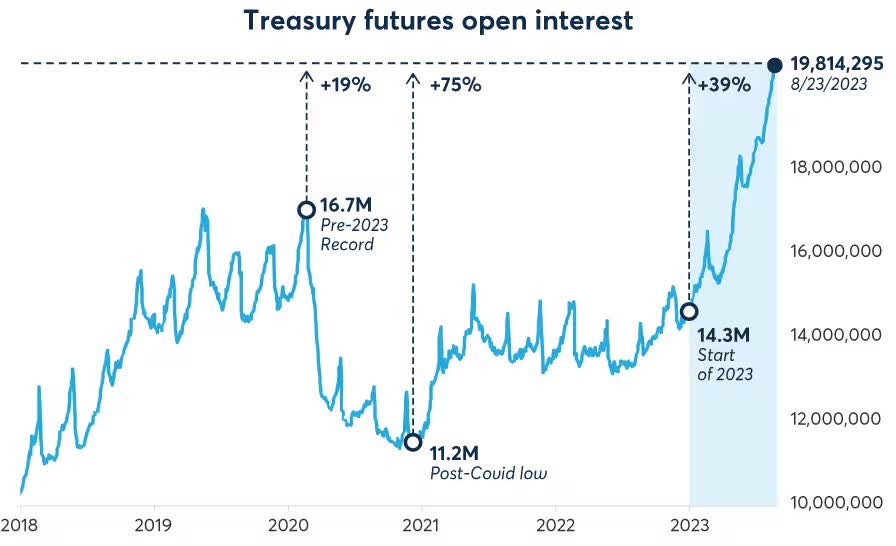
One of these charts displays the extraordinary growth of interest futures trading across North American Exchanges since the 1980s. And lately, Treasury futures open interest has been rising by the month, to new records.
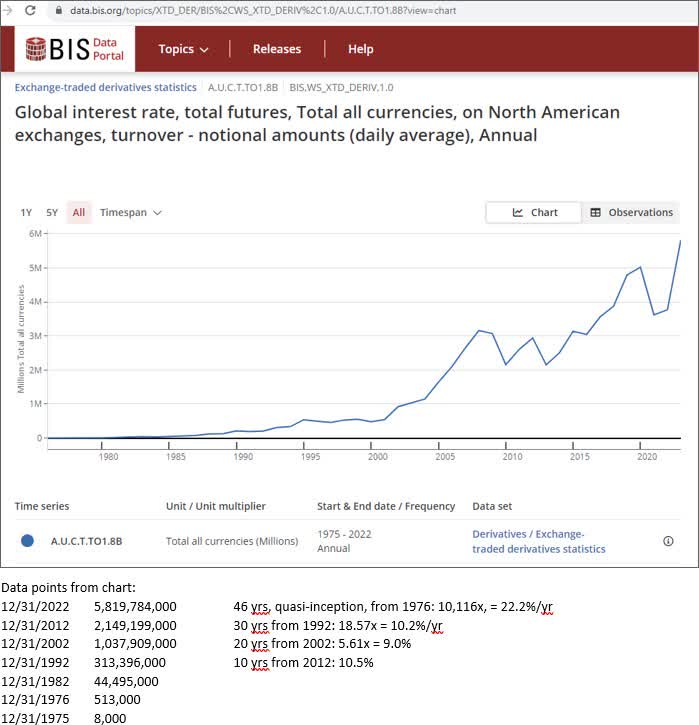
In paradoxical fashion, exchanges even have high-margin exposure to the growth of indexation itself, despite indexation being notoriously low-margin: Exchange Traded Products is one of the largest categories of exchange-traded derivatives volumes.
How about Electricity? Since 2002, Electricity Products contract volume expanded at 60%/year. It might be only 0.5% of total exchange-traded contract volume today, but in 2012, it was 0.04%. In absolute volume terms, it’s 11,900x larger. Electricity, as an asset class, is not something you can encounter in the S&P 500 or in the Russell 3000.
Neither is Bitcoin. But in 2022, Bitcoin, by volume, was already in the top third of derivatives categories. It’s bracketed, coincidentally, by Copper and Silver. Which means there is a securities exchange that is benefitting to a non-trivial degree from Bitcoin futures trading.
Nearly every significant asset is linked to the derivatives market in some way 23 , and the aggregate volumes and offerings continue to grow, as a direct reflection of constantly changing economics-based market demand.
In contrast, investors seeking diversification are typically satisfied with or limited to the most popular stock and bond indexes available. Their exposures are now extraordinarily top-heavy and narrow, because they are based on market capitalization, which is more a reflection of subjective valuation—stock-investor money flows—than anything else. And the make-up of the standard indexes is static and non-dynamic, because the constituents are chosen by a rule-set, not by the market.
Securities exchanges seem to be better representations of capital markets than the indexes designed for that purpose. And a more elegant solution, too. Instead of purchasing hundreds or thousands of companies in order to create a national or even global index, perhaps a better result can be had by purchasing a relatively small number of exchanges.
Asset Allocation: Exchanges as the Better Mousetrap
Speaking of global indexes, one might wonder if an exchange is not ultimately a superior form of indexation.
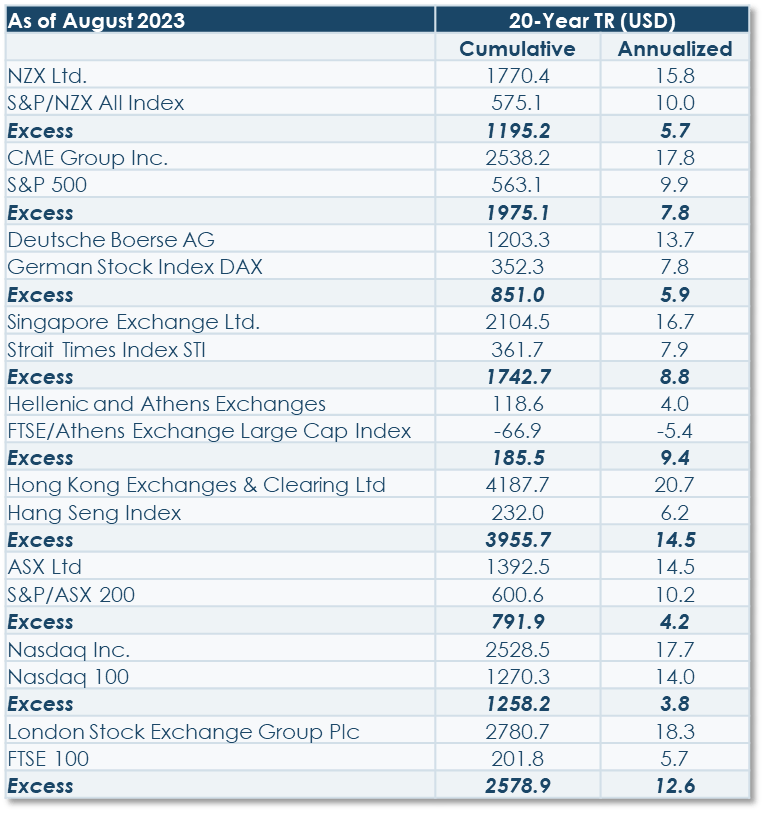
A proper answer is deserving of additional data and a longer discussion. Suffice it to say, for this Commentary, that over the past 20 years, securities exchanges have outperformed the economies and major stock indexes of just about every other nation to a remarkable degree.
Whether in Germany, Singapore or Greece, one will find that the volume growth of exchanges consistently translates into superior profitability and long-term growth in much the same way that royalty companies work.
This parallels the relationship between the royalty company and the operator who pays the royalty. For an exchange, it is not necessary that the companies comprising the stock indexes be profitable; nor that the stock and bond indexes provide a suitable total return; nor that the advisors who buy and sell those stocks or organize the ETFs based on those stocks manifest robust growth or profitability. The exchange will be robustly profitable anyway: as a croupier, it simply collects the fees for accessing and participating in the venue it operates. It is true that if trading volumes decline, there will be earnings leverage on the downside, just as there is on the upside. But unless there will be a permanent decline in activity, it will be merely interim cyclicality. Perhaps Japan is the suitable example.
The Competition Question
It’s important to bear in mind that exchanges don’t have to try to grow in the way people ordinarily think about corporate growth. When investors and traders transact, and as the economy and financial markets in their totality evolve and expand, they’re necessarily doing so through the exchanges—that’s the venue. The exchange doesn’t, in a sense, have to ‘do’ anything.
Nor do they have to compete in the traditional business manner, because securities trading is not a zero-sum game. When one IT company’s customer relationship management (CRM) technology—the enterprise software, the cloud platform—starts attracting more customers than its competitors, it takes market share from them, because the size of the market is relatively fixed. Its volume gain is the others’ loss.
Exchanges are entirely different.
- First, they each tend to be monopolistic in their particular product specialty or portfolio of specialties, because the particulars of a given contract—like size, expiration date or term structure—strike the right chord with traders and accrues more volume than an initially competing product. That initial success draws the greatest volume and depth, which then attracts even more traders. Eventually that becomes the dominant or exclusive contract. But there isn’t, thereafter, direct or self-limiting competition. For instance, no one trades crude oil. They trade West Texas Intermediate on the New York Mercantile Exchange, which is owned by CME Group. Or they trade Brent Crude through the Intercontinental Exchange. They have different features.
- Crude is separate from gasoline and diesel and natural gas and natural gas liquids.
- An exchange can always expand its product offering around its main product, like Campbell soups brand extensions (chicken noodle, chunky chicken noodle, hearty chicken with vegetables). The Brent Crude Complex includes:
- Monthly futures contracts Weekly Contract-for-Difference
- Monthly forward contracts Brent oilfield crude blend
- And others
- Importantly, the very existence of a related or even identical product on a different exchange creates additional trading and arbitrage opportunities between the two, since slight momentary price differences arise, so that both exchanges experience increased volume.
- Even the establishment of a new exchange is not a zero-sum event. Multiple venues create more trading opportunities. Miami Int’l Exchange 24 , created in 2008, did not have its own options clearing capability until December 2012. Traders would transact stock at MIAX and related options at other exchanges.
Essentially, trading begets more trading. Anything that lowers the barriers to transacting, like greater volume and liquidity, lower fees, faster execution, better data access and analysis, also begets more trading. The size of the pie is not fixed.
During the 30-plus year construction of New York’s Long Island Expressway and Triborough Bridge, a paradox was discovered. The idea was to alleviate traffic congestion with modern multi-lane highways. It was very expensive and the benefit was expected to last for a very long time. The problem was that every time a new segment was completed, a surge in traffic would almost immediately reinstate the congestion. Making it easier to drive resulted in more driving. Not entirely unlike securities trading.
Final Note: Indexation’s Historically Extreme Vulnerability to Systemic Risks
Starting with the iShares MSCI All Country World Index ETF ( ACWI ), for commodity-based inflation risk:
- Energy is a grand total of 4.99%. From a risk hedging perspective, that is far below the exposure of the economy to oil and natural gas as a necessary economic input. Moreover, a rise in oil and natural gas prices would be more inflationary than any other commodity, since they are either chemical or direct energy constituents in virtually every food, service and manufactured material.
- Further, there is only one oil royalty company, Texas Pacific Land Corp. It is only a 0.02% weight.
- Materials is only a 4.3% weight. These are traditionally thought to be inflation beneficiaries. However, most of these are cement or chemical manufacturers or miners, all of which are very energy intensive. Their profit margins are very sensitive to that price risk.
- Information Technology accounts for 25.7% of ACWI 26 , but it should be understood that many of these companies are vulnerable to wage pressure inflation. In this respect, higher energy prices can have an adverse impact on Technology, too, as well as other sectors of the index. IT companies are also vulnerable to higher interest rates, because they tend to be the highest-valuation sector of the index.
The S&P 500 Index ( SP500 , SPX ) is pretty similar to ACWI in this regard, but riskier still:
- Energy is an even lower 3.4% of the index.
- Within Energy, there are no royalty companies.
- Materials are even lower, at 2.4% of the index.
- Within Materials, there are only two metals mining companies, which total 0.23%, but no metals royalty companies.
- Information Technology is an even higher 39.6%, including Alphabet and Meta Platforms, and 42.9% if including Amazon, too.
These handful of figures show a few dramatic philosophical and methodological differences between the major indexes’ and our portfolios’ contingency planning for observable, historically significant systemic risks. The inflation beneficiary and adverse-event-beneficiary character of the royalty and securities exchange investments that are core weightings in many of our equity strategies don’t exist in the main asset allocation indexes.
That is separate from cryptocurrency exposure—similarly an invisible or index-unavailable asset class—which should also include the broader technology aspect of cryptocurrency. That is, not just the currency, like Bitcoin, but the massively expanding applied use of blockchain technology.
Which introduces this last section on blockchain technology.
An Odd and Change-Making Pairing: Blockchain Technology and Securities Exchanges
Blockchain technology, the kind of technology development that happens every generation or so and changes commerce and society, is happening. As a potential investment, this is entirely separate from the characteristics and prospects of the few scarcity-value cryptocurrencies like Bitcoin. Blockchain technology is in the ground-floor period of its commercial development. Few educated observers would argue that it cannot be as paradigm changing as the Internet was. And with no lesser a magnitude of ‘market cap’ and wealth creation possibilities.
Nevertheless, compared with their intuitive understanding of the early internet, investors at large barely know what blockchain is. That includes misperceptions about risk. Perhaps because it is often twinned with cryptocurrency: cryptocurrency requires a blockchain in order to exist, on the one hand, and many blockchains require cryptocurrency to operate. It’s hard to delve into one without hearing about the other.
Perhaps the lack of familiarity is because people have yet to experience blockchain services in wide-spread adoption. The facts are available, but not yet in plain sight. Which is not to say that major corporations aren’t investing seriously and with alacrity. To understand how rapid blockchain’s development is among informed participants, here is a very narrow, highly abridged recent timeline of the change in engagement with this consequential technology, shown through the actions of the largest bank in the U.S.:
- In 2021, JPMorgan Chase, then a renowned energetic critic of cryptocurrency, did finally allow clients to own, upon request, specific passive cryptocurrency funds (including a few Grayscale trusts). The bank’s private client advisors, though, were not permitted to recommend any such investments. 27
- Even at that time, though, JPMorgan was already an early developer of in-house blockchain technology. 28 A blockchain-based data system could dramatically reduce the bank’s massive backoffice operating costs while even more dramatically improving transaction and recordkeeping speeds, and error rates. In November 2022, the J.P. Morgan Wallet received U.S. Patent & Trademark Office approval for an application it had submitted more than two years earlier. This Wallet enables cryptocurrency electronic transfers, cryptocurrency-based payment processing, virtual checking accounts and payment settlement.
- In June of this year, the bank’s blockchain-based payments platform enabled corporate clients to use Euros, and its asset tokenization platform—which converts real-world assets into digital tokens— had already traded $785 billion of notional value. 29
- And right now, in October 2023, it conducted a blockchain-based collateral settlement transaction. It employed both JPMorgan’s private Ethereum based blockchain and its Tokenized Collateral Network to transfer money market funds from BlackRock to Barclays plc in exchange for collateral for an over-the-counter derivatives trade. 30
This is what the term ‘it’s just the beginning’ is meant for.
The Near-Impossible Challenge of Serial Success in Emerging Technologies
The signal question with new technology, whether bio-tech or info-tech, has always been “How?” How to invest, not wager? It’s a question that U.S. investors have struggled with for a very, very long time, and not very well. The ocean floor of the investment world is layered with the detritus of successive eras of failed world-changing tech companies. Here are some historical examples of classic challenges that make the conventional approaches to tech investing a low-success endeavor.
The Odds of Selecting a Winning Technology Company
Automobiles changed the world. Ungodly sums of money were made. But by whom? There was no shortage of choices for an early, or even late, investor pondering a venture capital or public market investment in this technology:
-
- In the first two decades of the 20th century, there were about 2,000 U.S. car manufacturers.
- By 1929, they had consolidated or collapsed to about 98.
- By the 1930s to 44.
- By the 1940s there were still a good dozen car companies, but 90% of the market was controlled by Ford, GM and Chrysler 31 .
Cars changed the world, but it was almost lottery ticket odds to select the survivors. Even the survivors, depending on the date purchased and valuation paid, might not have paid off. The accompanying list of defunct U.S. manufacturers is just the first of three columns of “A”s. 32 There are about as many B’s and C’s, not to mention the non-U.S. manufacturers.
Picking the Winning Technology…That Loses, I.
For all of the expertise and diligence of an analyst who correctly identifies the company with the best technology, sometimes the poorer technology wins. The company with the lesser technology might secure the first-mover advantage. Or it might be later to market but better funded, have a superior marketing effort or distribution. It might have an operating cost advantage or features that better suit the target market. As in this case:
- The video cassette recorder, VCR, was introduced in 1975 by Sony. For the first time, people could record video from their televisions. There were competing high-tech systems from other major firms, like RCA’s Capacitance Electronic Disc and Matsushita’s Video High Density disc, but they couldn’t do home recording. By 1987, annual VCR sales just in the U.S. were over $5.25 billion 33 .
- By 1996, the VCR was replaced by the DVD, but by then VCRs had 20 years of global success, plus many more ahead. DVDs for home movie releases didn’t outsell tape cassettes until 2001.
- The dominant VCR manufacturer is reported to have earned billions of dollars in royalties over the almost 30 years until DVDs began to outsell VCR cassettes. 34
- Except that it wasn’t Sony. It was JVC (Victor Co. of Japan) that was the dominant VCR manufacturer. Despite Sony’s Betamax format being first to market, and with superior picture quality, lower video noise, and a more compact cassette.
- Consumers preferred JVC’s cheaper VHS cassettes’ 2-hour play time, long enough to record a movie. Sony’s Betamax format was only 1 hour. Sony eventually extended the recording time of its cassettes, but by then an array of other manufacturers had already licensed the rights to manufacture JVC’s VHS, driving the price ever lower.
.
Picking the Winning Technology…That Loses, II.
Mark Twain’s (Samuel Clemens) roughly $6.5 million venture capital loss and resultant personal bankruptcy, is well known. That’s in today’s dollars, based on the frequently cited $190,000 cumulative investment. His story likewise involved a form of information technology, and parallels the competing-format saga of home video recorders.
The Paige Compositor. Image source: Scientific American Magazine, March 9, 1901
- With a growing population’s increasing demand for newspapers and books in the 19th century, there was an inherent need for a mechanized way to compose the typeface for printing presses, composition then being done by hand. Patented attempts at a mechanical typesetter date to 1822. In 1869, the New York World proposed that newspapers establish a fund to subsidize the creation of a machine, with a $250,000 prize to the successful inventor, roughly $5 million in today’s dollars.
- In 1880, at age 45, Clemens, whose first four years of employment had been as an itinerant typesetter, saw a prototype typesetting machine developed by James Paige. It was then about 4x faster than a human typesetter, and Clemens was so amazed at how it engaged in the complex task, he wrote that it seemed the machine had been “made to think.” 35 That’s when he bought his first $2,000 of stock in the company.
- Clemens thought Paige brilliant. The Encyclopedia Britannica later called his machine “one of the most remarkable pieces of mechanism ever put together.” In 2014, an authoritative technical analysis of the Paige Typesetter confirmed that its design was indeed innovative and brilliant in a host of ways. 36 The speed of the eventual working prototype equaled that of a dozen human compositors and was at least twice as fast as the primary competitor then in development, the Linotype machine.
- In 1886, when the Paige Typesetter was to have begun to produce a commercial working model, Clemens bought a half interest from Paige in exchange for promoting and further capitalizing the company. Clemens was intimately familiar and up to date with competing designs, including the Linotype and its various trial runs and defects. He calculated the precise size of the U.S. and international markets, newspaper by newspaper, and concluded he would be a millionaire at the very least. He was also aware of the first-mover advantage, and didn’t want to “risk losing the field.”
- Unfortunately, he did. Paige was a perfectionist to a self-defeating degree. He felt that another mechanical function was required (a justifier, to align type with the right margin, as on this page), but rather than integrate an available commercial model into his existing design, he proceeded to redesign and rebuild the entirety of this extraordinarily complex, 18,000-part machine. The patent application was the longest and most complex the U.S. Patent Office had ever received. This complexity made it much more expensive than the Linotype. Clemens thought the re-design an egregious breach of contract, but continued to support the company.
- The redesign took another four years, but by then, in 1890, a sufficiently improved version of the Linotype was in commercial operation at dozens of newspapers. By 1894, when the new Paige machine was tested, Linotypes were already the industry standard, and remained so for nearly the next 100 years. No Paige machine was ever sold.
- Like the Betamax-VHS format contest, this competition was also won by the less capable, cheaper technology that was good enough to get the job done. Though that’s not a formula that can be indexed, because sometimes it is the premium product that wins. Judgment counts.
The Extraordinary (and Extraordinarily Underappreciated) Obsolescence and Displacement Risk of Technology Companies.
In the 1960s, among the eight largest mainframe and supercomputer manufacturers were IBM, Burroughs, NCR, RCA, Honeywell and Univac. Despite being household names, there wasn’t an iota of stability, as would be suggested by consumer brand household names like Hershey’s or Hellman’s.
-
- UNIVAC computers were developed by Sperry Rand, which in 1961 was the 34th largest company in the U.S. Sperry Rand was formed when Remington-Rand acquired Eckert-Mauchly and Engineering Research Associates to enter the computer business.
- RCA’s computer business was acquired by UNIVAC, as a division of Sperry, in 1972.
- Burroughs acquired Sperry Corp in a hostile takeover in 1986 and became Unisys.
- Unisys came close to bankruptcy in 1991, and in 1997 wrote off its purchase of Sperry Corp.
- Bendix was acquired by Control Data, which itself began to exit computer manufacturing in the late 1980s after years of losses.
- General Electric’s mainframe computer business was acquired by Honeywell Information Systems in 1970. Honeywell bought Xerox Data Systems in 1975, and later merged with a joint venture of NEC Corp of Japan and France’s Compagnie des Machines Bull. By 1991, Honeywell had left the computer business.
- NCR, still one of the 4 remaining mainframe computer companies in 1986, was acquired by its largest customer, AT&T in 1991. NCR produced significant losses from 1993 onward.
- In 1995 AT&T shut down its computer design/manufacturing business, AT&T Computer Systems.
- In 1997, AT&T spun off NCR. In 1998 NCR effectively exited the computer business.
- Xerox Data Systems (see above)
This tiniest sample of corporate musical chairs and failures doesn’t include the many minicomputer manufacturers like Prime Computer and Data General. Then, in the 1970s and 1980s came the word processing and personal computer era with then household names like Commodore, Sinclair Research, Compaq, Wang Laboratories, Computer Vision, Prime Computer, Apollo Computer, and others too numerous to mention.
These and many of the mainframe companies that were still operating in the 1980s and 1990s, met their demise at the hands of a single piece of new technology—software, specifically—that cut a swathe of creative destruction throughout the industry. That was Microsoft’s MS-DOS, which was released in 1981 as the operating system for the IBM PC.
The scope of the value destruction is illumined by one modest example among many: Wang Labs, maker of the dominant brand of word processors, found in every office. In 1983, it employed over 33,000 people and had $3 billion of revenues. It declared bankruptcy in 1992. The “creative” in creative value destruction meant that the lost economic value of those companies redounded to the disruptor, Microsoft.
The objective study of history would suggest that technology is an industry characterized by vicious cycles and intense competition that frequently result in the extinction of many of its participants.
Losing While Getting EVERYTHING Right…Except the Price
Sometimes an investor gets it all right, a triumph of perspicacity and analysis, but fails to appreciate the efficient market. Because when a lot of people pay close attention, as they will when a company loudly exhibits multiple factors of success—like proprietary tech, scalability, rapid sales growth—the market suddenly gets very efficient. Every bit of future success gets written into the stock price. By the time those factors eventually manifest themselves sufficiently to lower the business risk from development stage to early going-concern phase, the risk migrates from the business to the shares: they get priced for an earnings level that is so far into the future that even riotous operating success can make for very disappointing investment results.
The Microsoft Test (1999 Edition)
To illustrate, Microsoft will be invoked once more. In February 1999, it was the subject of the valuation exercise that is reprised below. The technology industry was then thought to be in the initial stages of a prolonged growth phase. The idea of this exercise was to objectively assess how much of the anticipated growth was already embedded in the Microsoft share price. NOT to assess whether the growth estimations were valid, mind you, just whether they could reasonably lead to investment success.
U.S. Treasuries Comparison, Tax-Free Liquidation Version
- Microsoft’s market value was $412 billion in February 1999. For simplifying purposes, all of the shares were presumed to be owned by pensions funds, so that gains taxes could be ignored. All the shares were to be liquidated and invested in intermediate-term Federal government securities, then yielding 5%.
- The sale proceeds would generate $20.6 billion of annual cash income. Microsoft itself was projected to earn $6.8 billion that year.
- If the company would continue to grow at its expected 25% rate, the two cash flow streams would match in 7 ½ years. That time frame, though, doesn’t include the cumulative income.
- Microsoft’s cumulative earnings wouldn’t match the cumulative Treasury interest income until the 11th to 12th year.
Diversified Equity Comparison, Taxable Liquidation Scenario
- In this iteration, the simplifying assumption was that Bill Gates owned all of the shares and liquidated the company. Using shareholders’ equity as a proxy for a tax basis, and applying a 20% capital gains tax, the after-tax proceeds would have been $334 billion.
- If reinvested in various business ventures that earned an average 12% rate of return, the first year’s cash flow would have been $40 billion, about six times the Microsoft earnings. Microsoft’s cumulative cash flows would not have caught up to that of the purchased investment portfolio until Year 23.
In light of the preceding review, it is surely no exaggeration to say that a decade or more is an extremely long time in the world of technology. To claim confidence in an earnings projection a decade forward, not to mention confidence in a sustained high valuation multiple, is confident indeed. A confidence that takes little account of the impact of possible technological displacement, regulatory interdiction or other exogenous risks. Not much more than a decade before this valuation exercise was published, Microsoft itself barely existed, and in that time foisted upon the technology world many of those very same exogenous risks.
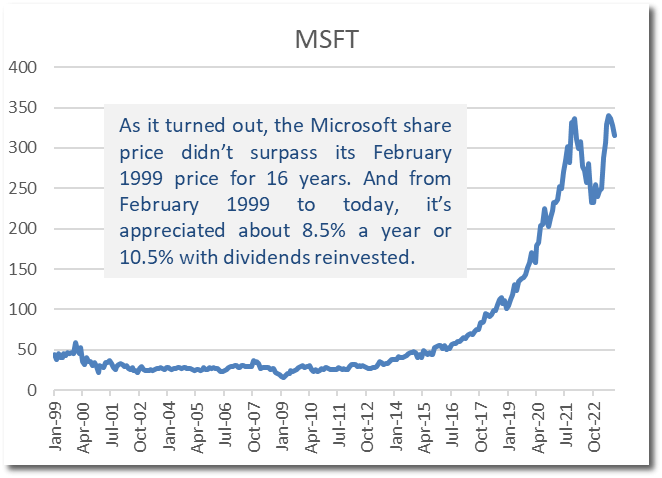
As it turned out, the Microsoft share price didn’t surpass its February 1999 price for 16 years. And from February 1999 to today, it’s appreciated about 8.5% a year, or 10.5% with dividends reinvested. 37
Which is a very long way to prepare to answer the question: How to invest in blockchain technology?
The first step is to acknowledge the woeful odds of investing successfully in new and developing technology directly. In which case, are there other means and methods? Yes.
Let’s contrast the direct and indirect approaches. The direct approach is some variation of, call it, the Mark Twain binary strategy: risk $190,000 in the winning horse and either become a multi-millionaire or fail hard. Even if the security-specific risk is dialed down by buying a diversified group of blockchain companies, that simply creates a systemically risky investment portfolio instead of an idiosyncratically risky single stock. The risk/reward mix of a selection of conventional ‘blockchain companies’ is still asymmetrically unfavorable.
The indirect approach might buy a business that is not even thought to be a blockchain company and which an index might never categorize as such. The key is that it be a natural beneficiary of any cryptocurrency and blockchain success, irrespective of the current exposure recognized on financial statements. Qualitatively, in terms of growth vectors, though, it might be an excellent blockchain investment.
If one can identify a business like that, it would be even better version would be if it would suffer no harm from the failure of the cryptocurrency/blockchain experiment. That would make it an asymmetrically favorable investment—the odds would actually be in your favor, the opposite of direct tech investing.
And a lavishly superior version to that would be if the business normally generates a double-digit annualized return anyway, say in the 15% range. In that case, any blockchain success comes as free optionality, not as an embedded cost. Which is the reason for devoting so much time earlier to securities exchanges: 15% is the rate of return they’ve earned, over decades, in different nations, in both robust and stagnant economies.
Yet we all know that, at least in the rapidly beating hearts of engaged investors, a 15% base rate of return can feel decidedly unambitious— borrring —especially if one’s sights are set on the glories of blockchain success. A maddeningly elusive glory, though, via the direct ‘Twain Binary’ strategy. Had Samuel Clemens been able to avail himself of the ‘15% Solution’ — no, in the interest of conservatism, let’s make it 10% — that $190,000 would be worth $7.4 billion today. Compounding…that’s the ticket!
This risk discussion is not about whether blockchain technologies will, as the internet did, proliferate and become part of the infrastructural fabric of the global economy. It is presumed—because it solves so many operational and transaction problems, because it’s economically valuable to a JPMorgan Chase—that it could be wildly successful. This risk discussion is about how to profitably participate. In August 2022, because we believe blockchain is a sufficiently important growth vector and asset allocation element—but not available in suitable index form—we established the Blockchain Development ETF ( BCDF ) as a tool to participate. Just as we established the Inflation Beneficiaries ETF (INFL) in 2021, as a tool to prepare for that contingency.
Regulated securities exchanges figure heavily in BCDF. The direct connection to blockchain and cryptocurrency is through two important dimensions.
- The first is the pure market demand dimension: exchanges ARE where businesses go to lay off risk, where the world’s wholesale financial transactions are done, whether in currencies, credit risk, interest rates, volatility or, lately, cryptocurrency futures. Anything financial that is large enough to be transacted on a global scale is likely to require those faculties. Most regulated exchanges have already announced some manner of participation, sometimes in entirely different capacities. Some of those products are already achieving non-trivial scale.
- The second force linking blockchain and cryptocurrencies to the exchanges is the government itself. Contrary to popular belief, increasing regulation, such as bills advancing in Congress, is good for cryptocurrency, not bad. The misperception is probably because the news tends to report regulatory restrictions or sanctions, such as against crypto brokerage firms masquerading as exchanges, but typically fails to announce the succession of regulatory approvals of new cryptocurrency products and services by the regulated securities exchanges.
- If you put yourself in the regulators’ shoes, you can appreciate that their concerns are about protecting investors from fraud and manipulation. They want transparency, reliability and accountability, robust internal controls. They want to know that the computer platforms are sufficiently redundant and scalable. But that is what the regulated securities exchanges already are . They already fulfil that complex and robust role, including constant communications and reporting with the regulators. Why would regulators, as burdened as they are, wish to create something new or deal with a new, untested entrant? Why would they wish to allow firms to operate trading platforms with unregistered brokers, exchanges, clearing agencies, and custodians all under a single umbrella?
Regulatory forces are likely to cause crypto trading to gravitate or be shepherded toward the regulated exchanges.
Market forces will find exchanges to be the natural on-ramp or enabling pathway for acceptance and implementation of what might be a proliferation of asset classes and applications to a degree that can hardly yet be fully imagined.
There are other types of companies that can capture the optionality of the crypto/blockchain opportunity set within an already profitable base business, particularly asset-light business models. For instance, certain asset managers have begun to tokenize their fund offerings, recording share ownership of their offerings on a blockchain. Eventually, this may allow for 24/7/365 trading, with instantaneous, simultaneous settlement between parties, and real-time transparency and confirmation. Instead of selling Apple shares for USD and then using USD to purchase MSFT, this can happen in one action. This has all sorts of ancillary benefits, such as reducing the need for unnecessary collateral being continuously locked in up in the system, waiting for clearance and settlement. One can see, on one side of the equation, the immediacy, convenience and capital efficiency for an investor and, on the other side, the operational and expense efficiency for the institution. When counterparties to any sort of project both have a vested interest in its development, momentum tends to happen.
In the case of one holding in the Fund, a commodity-focused asset manager, it has tokenized gold, allowing access to an investable store of value, but with additional features that weren’t possible before. The blockchain recordkeeping attribute of a token attached to a gold purchase allows an account holder to have complete divisibility (you can sell or transfer $100 worth, if you like, which is only 5 hundredths of an ounce) and a built-in payment mechanism (using tokenized gold to pay for a cup of coffee, sidestepping the oligopolistic banking/credit card complex, along with the same institutional custody and authenticity as a traditional gold investment.
Unusually, for a manager that seeks to achieve outperformance, this company has been consistently receiving robust new asset inflows. As a low-marginal-cost business, its operating margin on new assets is well north of 50%. In this instance, its early adoption of blockchain features that actually improve upon the benefits of a traditional asset class appears to be attracting assets in a counter-trend manner.
Companies involved in packaging, managing, and transacting with digital assets (i.e., securities exchanges and asset managers) are a focus of the Fund, but those operations are not entirely necessary to qualify a company as being a blockchain beneficiary. CACI International ( CACI ), a defense electronics contractor, interestingly enough, is becoming involved in blockchain technology from an entirely different entry point: data analysis, and the kind that can come with barriers to entry (95% of its revenues come from the U.S. government).
There is a treasure trove of data available through public, distributed ledgers. And there is a lot of value in knowing who supplied the funds, where else have they been spent, and what fiat currency onramps or offramps are connected to the transaction. These are questions that can typically be answered with enough detective work. Even if specific parties cannot be identified, trends and narratives can be analyzed just by the flow of activity, since all the transaction data of every single token, from the time it was created, resides on the blockchain.
As to illicit activity tied to digital assets, there is misinformation on the amount of it, though it does happen. Even if it were far less frequent than illicit activity in U.S. dollars or other currencies, though, the sheer magnitude of growth that can take place (is already taking place) in digital assets should, in principle, create demand to process the burgeoning volume of data related to the use of these funds. Defense electronics companies, with their extensive and scaled capabilities in artificial intelligence and data analytics, intelligence analysis, and cyber services to the national security sector would seem to have the requisite skillsets and security faculties. Their operating assets are not physical capital (property, plant and equipment), but human capital (the PhDs and engineers who are the majority of their employees).
On a business model basis, these companies’ advantages derive, in part, from their employees’ security clearance, with minimal physical asset and investment requirements to support higher throughput. CACI is a highlight of this approach. In 2021 they acquired a company called Bluestone Analytics, and subsequently developed their DarkBlue Intelligence Suite. Essentially, this is a tool to monitor dark web activity and identify, target, and track bad actors who use cryptocurrencies to conduct their activities. The mission critical data collected through dark web activity is just one example of the ways blockchain data can be used to expand business operations in an asymmetrically favorable risk/return fashion.
Most of the Fund investments, at present, are in securities exchanges, some of which are highlighted below to provide a sense of the breadth of various digital asset initiatives taking place.
- London Stock Exchange Group: Its LCH division now provides clearing services for cash-settled Bitcoin index futures and options traded on GFO-X, a digital asset trading venue. The company recently announced their intentions to develop their own blockchain, one that allows for capital transfers across different traditional asset classes.
- CBOE Global Markets: Approved by the CFTC for margined crypto futures contracts on Bitcoin and Ether, CBOE also offers orchestrated surveillance-sharing agreements for spot Bitcoin ETF applications through its BZX Exchange.
- Deutsche Boerse AG: Its Eurex subsidiary became the first European exchange to launch Bitcoin index futures.
- TMX Group: The organization’s flagship Toronto Stock Exchange (TSX) just published a consultation paper detailing plans to have TSX Alpha become the “first fully regulated stock exchange to permit trading in digital assets in Canada.” This offering would facilitate spot trading for Bitcoin and Ether cryptocurrencies at the start, and would require pre-funding at a TMX approved custodian to avoid settlement risk.
- CME Group: The mercantile exchange giant continues to build its crypto derivatives business, with a Bitcoin/Ether ratio spread contract set to go live at the end of July 2023.
- ASX Group: The Australian exchange received its first Bitcoin spot ETF application under crypto regulations revised in 2021 to be offered to retail investors
- OTC Markets Group: FINRA recently granted approval for broker-dealers to trade digital asset securities on OTC’s Alternative Trading System.
Even in the securities exchange sector, there is scope for alternatives. One of the BCDF holdings has interests in emerging private exchanges. These can have the benefit of embedded private market discounts to their value if they were to come public. More strategically, smaller exchanges are often willing to entertain innovative types of futures or options contracts that, not being proven, do not find ready acceptance among the large incumbent exchanges. Yet, some contract that finds resonance in the market and expands enormously, can have a multiplier impact on a small exchange.
Global fixed income markets, in terms of issues outstanding, were about $130 trillion in 2022. Global equity market capitalization was around $101 trillion. 38 Global real estate is likely far larger, though typically in a less liquid form. Yet we believe that digital asset class will eventually become the second largest in the world. There is an incredible opportunity related to the creation of new intangible assets like cryptocurrencies, and a wide variety of implementations unrelated to the “digital gold” scarcity value thesis. Tangible and financial assets can also benefit from the transition to blockchain in the ever-growing need for faster speeds, greater accuracy, and lower costs.
So why would digital assets will only be the second largest asset class? Because the notional value of the derivatives market far exceeds that of traditional spot markets. In 2022, the Bank for International Settlements estimated that there were $618 trillion of notional value of outstanding OTC derivatives. Add another $80 trillion for exchange-traded interest rate and FX derivatives. It is entirely possible, actually quite likely, that this same trend would continue in the digital asset space.
Exchanges, large and small, will likely be prime beneficiaries of what seems to be the beginning of a massive global IT transition and expansion, but without incurring the idiosyncratic and truly classic new-technology risks of specific digital assets or ‘blockchain companies.’
Finally, for investors with a risk-attentive mindset, perhaps more important than the pure excess-return focus that seems synonymous with equity investing, this approach is largely independent of the systemic risks that are now crowding index-centric investing. And it rhymes with contingency investing, which no longer exists in the indexation building blocks.
|
BCDF does not invest directly in cryptocurrencies or initial coin offerings and as a result, its performance does not seek to, and should not be expected to, correspond to the performance of any particular cryptocurrency. The views expressed are those of the portfolio managers as of November 7, 2023, are subject to change and may differ from the views of other portfolio managers or the firm as a whole. These opinions are not intended to be a forecast of future events, a guarantee of results, or investment advice. Footnotes1 As of October 17, 2023. Source: https:/ www.ishares.com/us/products/239600/ishares-msci-acwi-etf 2 The Templeton Emerging Markets (ticker EMF), in Feb. 1987.3 https://johncbogle.com/wordpress/wp-content/uploads/2013/05/c09.pdf 4 MSCI World All Cap Index 5 ETF.com 6 Source: Population Clock 7 www.statista.com , sourced from International Monetary Fund - IMF 8 Peter Bernholz, “Monetary Regimes and Inflation: History, Economic and Political Relationships. XI, 210 pp. Cheltenham, UK: Edward Elgar Publishing, 2003.9 Carmen Reinhart and Kenneth Rogoff, “This Time is Different: Eight Centuries of Financial Folly “. Princeton: Princeton University Press, 2011.10 Peter Bernholz, “Monetary Regimes and Inflation: History, Economic and Political Relationships. XI, 210 pp. Cheltenham, UK: Edward Elgar Publishing, 2003.11 For Illustrative Purposes Only. www.cbo.gov/publication/59096 12 Also from Reinhard and Rogoff.13 The most obvious exception is scarcity-based cryptocurrency like Bitcoin, the market value gains of which exist outside the indexation universe.14 Source: NYSE, Horizon Kinetics Contrarian Research Report (June 2005). Exchanges Versus Indices.,Factset15 Transaction closed in 2006.16 Sale of NYSE Seat Sets Record at $3.5 Million https:/ www.sec.gov/news/speech/spch050605css-attach.pdf 17 National income: Corporate profits before tax (without IVA and CCAdj), Billions of Dollars, Annual, Seasonally Adjusted Annual Rate18 Consumer Price Index for All Urban Consumers: All Items in U.S. City Average, Percent Change from Year Ago, Annual, Not Seasonally Adjusted19 Federal Funds Effective Rate, Percent, Annual, Not Seasonally Adjusted20 CBOE Volatility Index: VIX, Index, Annual, Not Seasonally Adjusted. Analysis began at the inception of VIX Index in 1990.21 Ignoring 1985 as a distorting low-volume initial year for derivatives trading.22 CME in 2002, then ICE and CBOT in 2005, NYMEX in 2006 and CBOE in 2010.23 Diamonds being a notable exception, but as mentioned in last quarter’s Commentary, Diamond Standard, in which Horizon Kinetics has some private fund investments, is developing products intended to correct that absence.24 Miami International Holdings, in which certain Horizon Kinetics funds have an interest, was discussed in last quarter’s Commentary.25 TPL, FNV and WPM are holding in several funds and strategies managed by Horizon Kinetics Asset Management LLC.26 Including Alphabet and Meta Platforms, which were re-classified from IT in 2018. Or 26.1% inclusive of Amazon.com 27 JPMorgan Becomes The First Big Bank To Give Retail Clients Access To Bitcoin 28 https://www.coindesk.com/markets/2019/02/14/jpmorgan-has-its-own-crypto-and-its-starting-real-worldtrials/?_gl=1*yf0lcf*_up*MQ..*_ga*NzUwODQ1NTAzLjE2OTgyNjkyMTI.*_ga_VM3STRYVN8*MTY5ODI2OTIxMi4xLjAuMTY5O DI2OTIxMi42MC4wLjA29 https: / Blockchain Tech Gains Important Supporters 30 JPMorgan Debuts Tokenized BlackRock Shares as Collateral with Barclays 31 www.cjonline.com Cars We Remember: History of American car companies and today’s multinational vehicles.32 List of defunct automobile manufacturers of the United States - Wikipedia 33 The Tale of the Tapes: How VHS Ultimately Beat Out Betamax 34 Videotape format war - Wikipedia 35 Goble, C (Aug 1985. Mark Twain’s Nemesis: The Paige Compositor [Paper presentation]. Annual Meeting of the Association for Education in Journalism and Mass Communication (68th, Memphis, TN, August 3-6, 1985)36 The Tragic Saga of James W. Paige’s Marvelous Typesetting Machine. By Richard L. Hopkins. Hill & Dale Private Press and Type Foundry, 2014. From Tragic Saga of James W. Paige 37 For Illustrative Purposes Only. Source: Horizon Kinetics Research, February 1999. “Technology Stocks: A Humble Attempt at Valuation.” The idea of this exercise was to objectively assess how much of the anticipated growth was already embedded in the Microsoft share price. NOT to assess whether the growth estimations were valid, mind you, just whether they could reasonably lead to investment success.38 https://www.sifma.org/wp-content/uploads/2022/07/2023-SIFMA-Capital-Markets-Factbook.pdf IMPORTANT RISK DISCLOSURES Please consider carefully a fund’s investment objectives, risks, charges and expenses. For this and other important information, obtain a statutory prospectus and summary prospectus by contacting 646-495-7333. Read it carefully before investing. The Horizon Kinetics Blockchain Development ETF (Symbol: BCDF) is an exchange traded fund managed by Horizon Kinetics Asset Management LLC (“HKAM”). Associated Risk of Investing in Blockchain Development Companies. The Fund will invest in Blockchain Development Companies. At times, Blockchain Development Companies may be out of favor and underperform other industries or groups of industries or the market as a whole. In such event, the value of the Shares may rise and fall more than the value of shares of a fund that invests in securities of companies in a broader range of industries. Investing involves risk, including the possible loss of principal. Shares of any ETF are bought and sold at market price (not NAV), may trade at a discount or premium to NAV and are not individually redeemed from the Fund. Brokerage commissions will reduce returns. The Fund’s investments in securities linked to real assets involve significant risks, including financial, operating, and competitive risks. Investments in securities linked to real assets expose the Fund to potentially adverse macroeconomic conditions, such as a rise in interest rates or a downturn in the economy in which the asset is located. The Fund is non-diversified, meaning it may concentrate its assets in fewer individual holdings than a diversified fund. Therefore, the Fund is more exposed to individual stock volatility than a diversified fund. Fund holdings and sector allocations are subject to change at any time and should not be considered recommendations to buy or sell any security. The Fund does not invest directly in cryptocurrencies or initial coin offerings and as a result, its performance does not seek to, and should not be expected to, correspond to the performance of any particular cryptocurrency. The Fund invests in foreign securities which involve greater volatility and political, economic and currency risks and differences in accounting methods. These risks are greater for investments in emerging markets. The Fund may invest in the securities of smaller and mid-capitalization companies, which may be more volatile than funds that invest in larger, more established companies. The fund is actively managed and may be affected by the investment adviser’s security selections. Diversification does not assure a profit or protect against a loss in a declining market. KAM does not provide tax or legal advice, all investors are encouraged to consult their tax and legal advisors regarding an investment in the Fund. You may obtain additional information about HKAM at our website at www.horizonkinetics.com. No part of this material may be copied, photocopied, or duplicated in any form, by any means, or redistributed without the express written consent of HKAM. The Horizon Kinetics Blockchain Development ETF ( BCDF ) is distributed by Foreside Fund Services, LLC (“Foreside”). Foreside is not affiliated with BCDF or Horizon Kinetics LLC or its subsidiaries. The charts in this material are for illustrative purposes only and are not indicative of what will occur in the future. In general, they are intended to show how investors view performance over differing time periods. Past performance is not indicative of future results. The information contained herein is subject to explanation during a presentation. Certain of the material herein is intended to portray the general nature of investor communications provided by Horizon Kinetics from time to time to existing clients. None of the investments or strategies referenced should be construed as investment advice and just because one investment is appropriate for one account does not necessarily mean it is appropriate for another. No investments should be made without the analysis of, among other things, an investor’s specific investment objectives, which considers their overall portfolio and any income requirements. The accounts referenced herein pursue an unconstrained strategy – meaning they are not limited by capitalization, geographic region, or investment techniques. They generally primarily seek capital appreciation with a secondary objective of income. Note that indices are unmanaged, and the figures shown herein do not reflect any investment management fee or transaction costs. Investors cannot directly invest in an index. References to market or composite indices or other measures of relative market performance (a “Benchmark”) over a specific period are provided for your information only. Reference to a Benchmark may not reflect the manner in which a portfolio is constructed in relation to expected or achieved returns, portfolio guidelines, correlation, concentrations, volatility or tracking error targets, all of which are subject to change over time. This material references cryptocurrencies, including bitcoin. Horizon Kinetics’ subsidiaries manage products that seek to provide exposure to bitcoin and other cryptocurrencies. The value of bitcoins is determined by the supply of and demand for bitcoins in the global market for the trading of bitcoins, which consists of transactions on electronic bitcoin exchanges (“Bitcoin Exchanges”). Pricing on Bitcoin Exchanges and other venues can be volatile and can adversely affect the value of the bitcoin. Currently, there is relatively small use of bitcoins in the retail and commercial marketplace in comparison to the relatively large use of bitcoins by speculators, thus contributing to price volatility that could adversely affect a portfolio’s direct or indirect investments in bitcoin. Bitcoin transactions are irrevocable, and stolen or incorrectly transferred bitcoins may be irretrievable. As a result, any incorrectly executed bitcoin transactions could adversely affect the value of a portfolio’s direct or indirect investment in bitcoin. Only investors who can appreciate the risks associated with an investment should invest in cryptocurrencies or products that offer cryptocurrency exposure. As with all investments, investors should consult with their investment, legal and tax professionals before investing, as you may lose money. Murray Stahl is member of the Board of Directors of Texas Pacific Land Corporation (“TPL”), a large holding in certain client accounts and funds managed by Horizon Kinetics Asset Management LLC (“HKAM”). Officers, directors and employees may also hold substantial amounts of TPL, both directly and indirectly, in their personal accounts. HKAM seeks to address potential conflicts of interest through the adoption of various policies and procedures, which include both electronic and physical safeguards. All personal and proprietary trading is also subject to HKAM’s Code of Ethics and is monitored by the firm’s Legal and Compliance Department. The S&P 500 Index (“SPX”) is a broadbased index widely considered as a proxy for overall market performance. It is the property of Standard & Poor’s ®. This is not an offer to sell or a solicitation to invest. Opinions and estimates offered constitute the judgment of Horizon Kinetics LLC (“Horizon Kinetics”) and are subject to change without notice, as are statements of financial market trends, which are based on current market conditions. Under no circumstances does the information contained within represent a recommendation to buy, hold or sell any security, and it should not be assumed that the securities transactions or holdings discussed were or will prove to be profitable. Subsidiaries of Horizon Kinetics LLC manage separate accounts and pooled products that may hold certain of the individual securities mentioned herein. For more information on Horizon Kinetics, you may visit our website at www.horizonkinetics.com. The Core Value and Small Cap separate account strategies are managed by Horizon Asset Management LLC. Not all investors will experience the same holdings, returns or weightings as the corresponding composite. No part of the research analysts’ compensation was, is, or will be, directly or indirectly, related to the specific recommendations or views expressed by the research analysts in this report. No part of this material may be copied, photocopied, or duplicated in any form, by any means, or redistributed without Horizon Kinetics’ prior written consent. ©2023 Horizon Kinetics LLC ® All rights reserved |
Editor's Note: The summary bullets for this article were chosen by Seeking Alpha editors.
For further details see:
Horizon Kinetics Q3 2023 Commentary