VZ - How This Income Method Could Lead To Financial Freedom
Summary
- We will go over our thesis as to how a diversified income method with low volatility could make you financially independent.
- We regularly write about multi-basket income strategies with an in-built hedging mechanism to keep the drawdowns to a minimum. They provide not only consistent income but also long-term growth with 30% less volatility.
- We will provide an actionable strategy with a long-term backtesting view covering the last 15 years.
The financial markets are at a crossroads. On one side, the economy appears to be chugging along just fine in spite of the high inflation and high-interest rates. The job market is still very strong, and unemployment is at historic lows. On the other hand, there is a fear of a looming recession, as the full impact of all the rate increases has not manifested in the economy yet. The corporate earnings are on a decline, and we can't rule out a hard landing and a recession later this year. These two views of the market are at loggerheads with each other. No one knows exactly where the markets will be in six months or a year from now; that's why it is important to have a strategy that can deal with good times and bad with relative ease. There is no point in stressing about the market on a day-to-day or even a year-to-year basis. The only way to avoid the stress of a roller-coaster ride is to have a well-planned, low-volatility strategy and stick to it in good times and bad.
We describe one such strategy that we think can help you achieve financial freedom with low stress and relative ease. Whether you are a retiree or you just want to be financially independent, you need a strategy that should meet the following goals:
- Produce sufficiently high income, roughly 5% or higher.
- Preserve capital during tough times.
- Provide reasonably high growth for long-term wealth preservation and meeting retirement goals.
Goal#1: Income
There is no one definition of "sufficiently high income." It is highly subjective based on many individual factors, for example, spending needs and size of the assets of the investor, access to other fixed income sources like pensions, social security, or rental income. There is a limit that an investment portfolio can generate in income that is relatively safe and sustainable. The higher the income withdrawn from a portfolio, the greater will be the chances of depleting the portfolio over time. So, what is a good balance? In our view, no more than 5% to 6% of income should be withdrawn from a portfolio, even if it were to generate higher income. Any excess income (over 5% or 6%) should be reinvested back into the portfolio for it to sustain long-term growth.
Goal#2: Capital Preservation
We can have all the talk about capital preservation, but the real test comes when the market takes a huge dive in real-time, something akin to what we saw in 2020 due to the coronavirus pandemic and then more recently during the year 2022. An event or correction of that magnitude can act as a real eye-opener to review and judge if your portfolio is meeting its defined goals, especially risk tolerance. If not, you should modify your strategy appropriately. Preservation of capital is probably one of the most important factors for retirees and conservative investors, or anyone who wants to be or stay financially independent. In order to preserve capital, it's important that our overall portfolio is able to achieve low volatility and smaller drawdowns while not compromising on growth during the good times.
Goal#3: Reasonably High Growth
So, how much is reasonable growth? Assuming an average long-term rate of inflation < 3%, in our view, a 10% overall annual growth of the capital (including the income withdrawals) would be reasonable. It can vary based on your personal expectations and factors like the rate of inflation. Sure, it is possible to achieve a higher rate of growth some of the time, but we are talking in terms of the long-term average annual growth without taking high risks.
The Ultimate Goal of Financial Independence
There's no universal definition of financial independence. It would vary from person to person. But as a broad definition, if your investment portfolio can safely generate enough income to sustain your basic needs (not including luxuries or vacations, etc.), you are financially independent. For example, if your annual earnings are $100K, but your basic needs may be only 40,000 annually, then your investment portfolio should generate at least 40,000 annually (minus any other fixed income) for you to be financially independent. Also, being financially independent does not necessarily mean early retirement. You could be financially independent in your 30s or 40s and still be pursuing your career, whatever that may be. However, it does accord you the freedom to choose to do what interests you rather than doing something that you hate to do. In essence, it's a great stress reducer.
In this article, we present one such strategy that aims to meet all of the three basic goals that we defined above to help you achieve your ultimate goal of financial independence. We regularly write about the importance of not only diversifying in stocks but also diversifying in terms of strategies and types of assets. As such, besides growth, we focus on income-producing strategies, especially strategies that also preserve capital during times of crisis.
We will review a three-basket strategy that's not overly complicated and easy to get started. We also will provide a real-life view of this strategy and how this would have behaved over the years, including the recent crisis or during the 2008-09 financial crisis while using the S&P 500 as our performance benchmark.
Brief Description of Three-Basket (or Multi-Basket) Strategy
Note: Inside our Marketplace Service, we also call it the NPP (Near Perfect Portfolio) strategy.
For the sake of demonstration and backtesting, we will assume that we invest $100,000 of assets into this strategy, but the amount is not of much significance as it would work the same whether it was $30,000 or $3 million. If you are just starting out, it does not matter how much capital you start with, but hopefully, your retirement is many years away. You could use this time to gradually build a strategy and compound the income over the years. The three-basket strategy that we are going to discuss below can comfortably support 5% income withdrawals. So, if your basic needs are $40,000 a year, by reverse calculation, you will need to grow your investment portfolio to roughly $800,000. Sure, if you are saving for retirement, you should certainly target a bit higher to have a margin of safety. Also, $40,000 may not be enough for a comfortable retirement, but hopefully, you would have other sources of income like Social Security and/or pension.
Table 1:
| Basket Name |
| Type of Portfolio |
| Percentage Allocation |
| $$ Amount Allocation |
| Basket 1 |
| DGI portfolio |
| 40% |
| $40,000 |
| Basket 2 |
| Rotational RA portfolios |
| 45% |
| $45,000 |
| Basket 3 |
| 8% High-Income portfolio |
| 15% |
| $15,000 |
We could also add one optional bucket, and it could be different for an individual based on their age group, individual objectives, temperament, etc. The younger folks could have this bucket invested in high-growth-oriented stocks that may or may not pay dividends. On the other hand, most conservative investors could keep this bucket in cash or cash-like securities.
Table 1B:
| Basket Name |
| Type of Portfolio |
| Percentage Allocation |
| $$ Amount Allocation |
| Basket 1 |
| DGI portfolio |
| 35% |
| $35,000 |
| Basket 2 |
| Rotational RA portfolios |
| 35% |
| $35,000 |
| Basket 3 |
| 8% High-Income portfolio |
| 15% |
| $15,000 |
| Bucket 4 |
| Optional Bucket (High Growth Stocks for younger investors) |
| 15% |
| $15,000 |
Basket 1: (DGI portfolio)
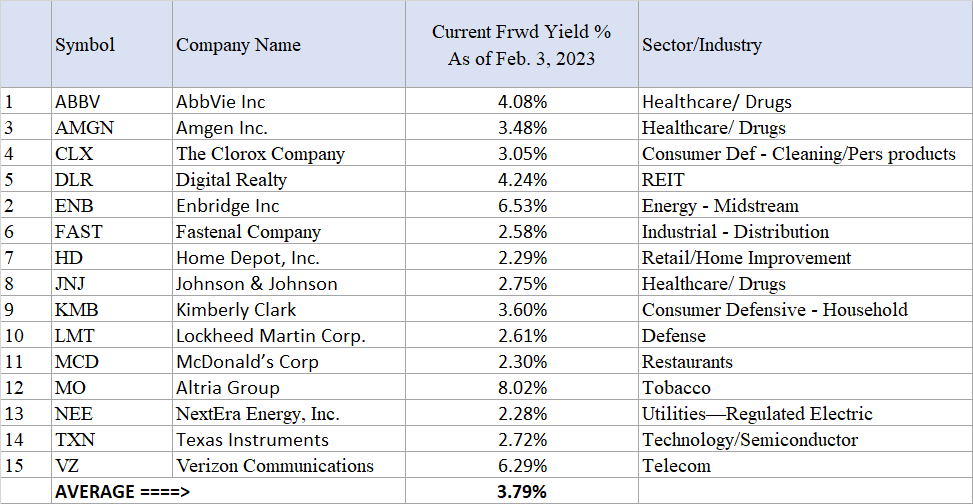
Now there are many ways to construct a DGI portfolio, and this is the easiest part of the overall strategy. It's not hard to pick up some good blue-chip dividend-growing stocks. Here is a sample list of 15 DGI stocks:
Stocks selected:
AbbVie Inc. ( ABBV ), Amgen ( AMGN ), Clorox ( CLX ), Digital Realty ( DLR ), Enbridge ( ENB ), Fastenal ( FAST ), Home Depot ( HD ), Johnson & Johnson ( JNJ ), Kimberly-Clark ( KMB ), Lockheed Martin ( LMT ), McDonald's ( MCD ), Altria ( MO ), NextEra Energy ( NEE ), Texas Instruments ( TXN ), and Verizon ( VZ ).
Table-2:
The average current yield from this group of 15 stocks is quite attractive at 3.8% compared to 1.55% from S&P 500. If you still have some years before retirement, reinvesting the dividends for a few years would take the yield on cost up to 5% easily.
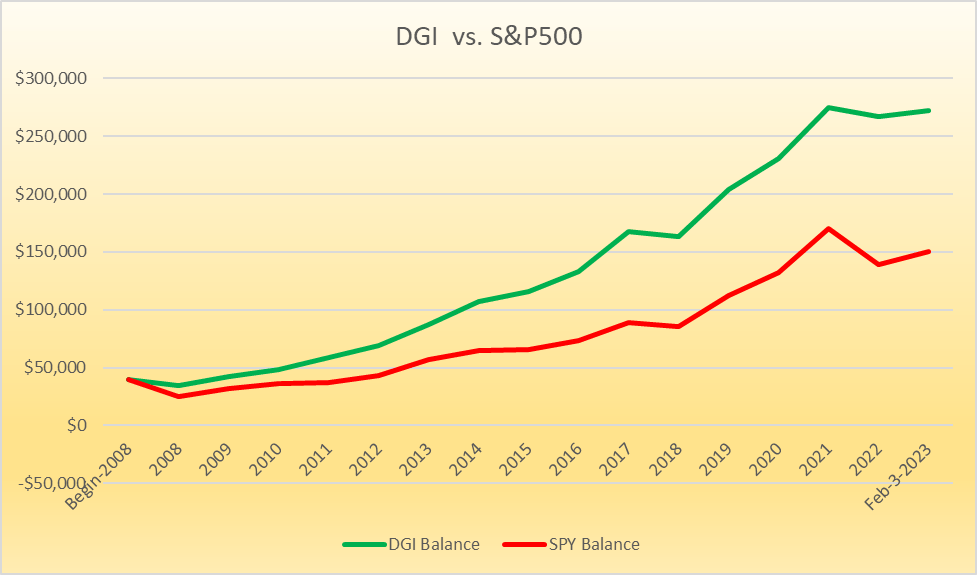
Chart 1: Performance DGI vs. S&P500
ETF-based DGI Portfolio:
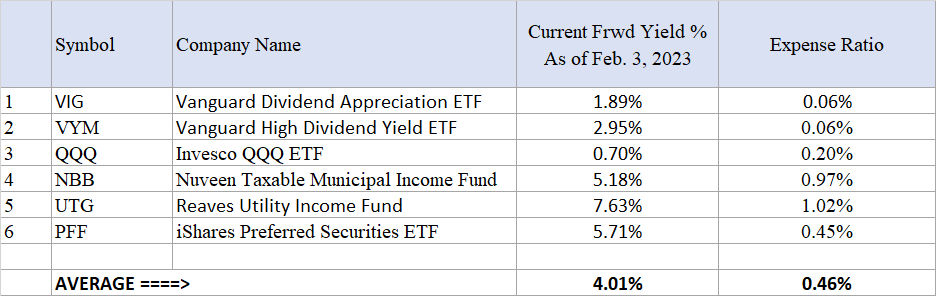
Alternatively, passive investors could just pick a few low-cost ETFs, though we prefer individual stocks over the ETFs or funds. Some of the lowest-cost ETFs come from the Vanguard group. If we want to increase the dividend or income potential, we could add some CEFs using conservative asset classes like Municipals, Utilities, and Preferreds. Here is the list of these ETFs/funds:
The resulting portfolio of six funds will provide good growth, an attractive yield of 4.0%, and provide more than enough diversification. Please note that QQQ is not a dividend ETF and does not provide much in terms of dividends. The reason we include it here is to boost the growth of this portfolio while the rest of the funds will provide income. As the investor progresses in age, he/she can adjust the ratios of the funds and invest more in VYM and less in QQQ to generate higher levels of income but less growth.
Table 2B:
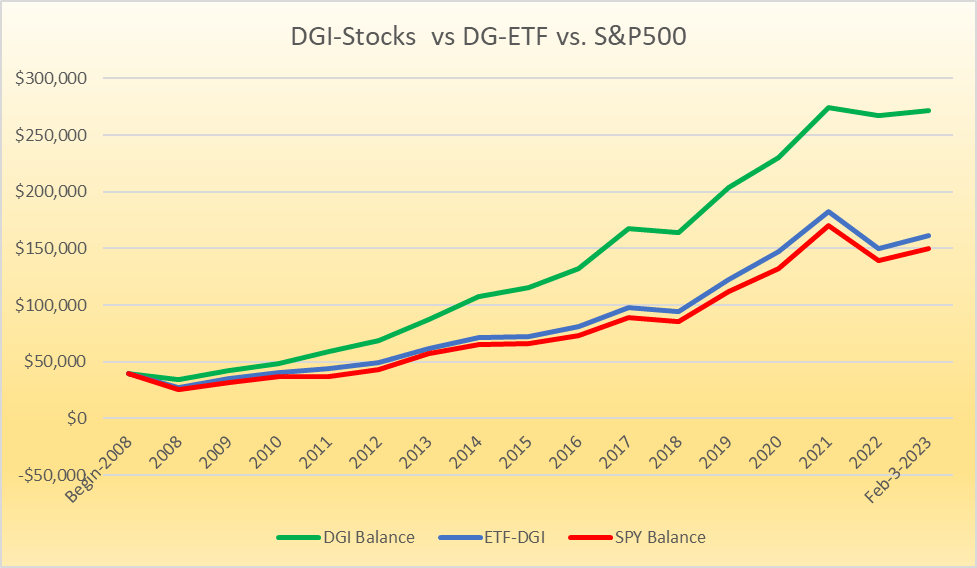
Chart 2: Performance of DGI-Stock portfolio vs. ETF-DGI vs. S&P500
Note: For backtesting purposes, NBB was replaced with NMZ, which has a longer history.
As you can see from the chart below, the stock-based DGI portfolio outperformed both the S&P500 and ETF-DGI by a wide margin. The total returns of the ETF-based DGI portfolio almost mirrored the returns of the S&P 500 during the last 15 years. However, both the DGI-stock and DGI-ETF portfolios provide an attractive nearly 4.0% yield compared to 1.55% of the S&P 500 without compromising on growth at all.
Basket 2: (Rotational RA Portfolios)
This is our hedging or insurance bucket, but by no means it's short on growth. In fact, the opposite may be true. In the Rotational bucket, we normally rotate between a fixed set of securities on a periodic basis (usually every month) based on the relative performance of each security during the previous period of defined length.
Note: A word of caution for new investors - just because we're allocating 45% of the portfolio to this strategy, we are not recommending that you change to this strategy overnight with large sums of money. Rather, it should be done gradually over time in smaller steps. Further, for large capital portfolios, we recommend using more than one such strategy.
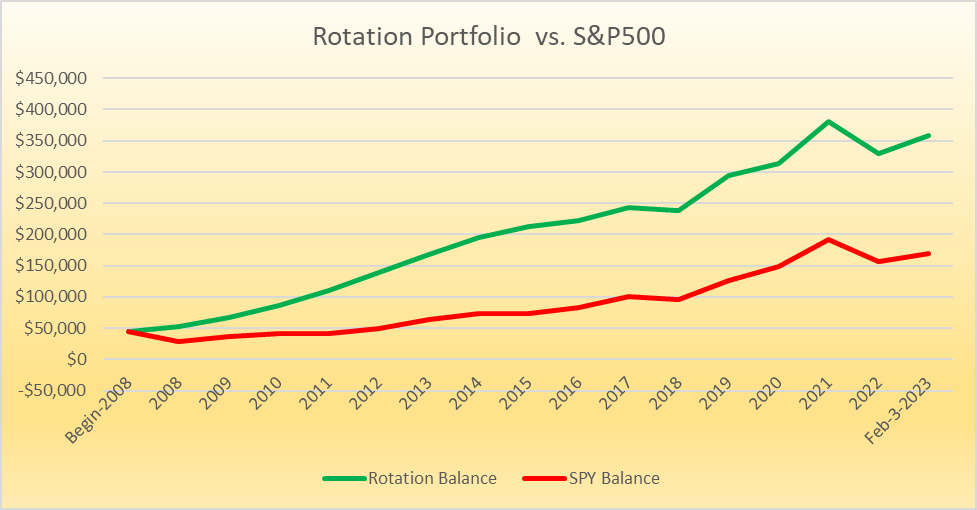
A Rotation Strategy for the Bull as well as Bear markets:
This portfolio is designed in such a way that it aims to preserve capital with minimal drawdowns during corrections and panic situations while providing excellent returns during bull periods. Due to much lower volatility, this portfolio tends to outperform the S&P 500 over long periods of time, as can be seen during the last 15 years (backtesting example). However, at times, it may underperform to some extent.
Also, even though this strategy does not generate income specifically, one can safely withdraw 5% to 6% of income. Since these strategies have limited drawdowns and low volatility, withdrawing income does not risk depleting the portfolio at the wrong time.
This specific strategy is based on eight diverse securities, but we will hold only two of them at any given time based on relative positive momentum/performance over the previous three months. Basically, we will select the two top-performing funds. The performance is measured in terms of total returns, including any dividends or distributions. The rotation is on a monthly basis. The eight securities are:
- Vanguard High Dividend Yield ETF ( VYM )
- Vanguard Dividend Appreciation ETF ( VIG )
- iShares MSCI EAFE Value ETF ( EFV )
- iShares MSCI EAFE Growth ETF ( EFG )
- Cohen & Steers Quality Income Realty Fund ( RQI )
- iShares 20+ Year Treasury Bond ETF ( TLT )
- iShares 1-3 Year Treasury Bond ETF ( SHY )
- ProShares Short 20+ Year Treasury Bond ETF ( TBF ).
Chart 3: Performance of Bull-&-Bear portfolio vs. S&P500
Basket 3: (8% High-Income Model)
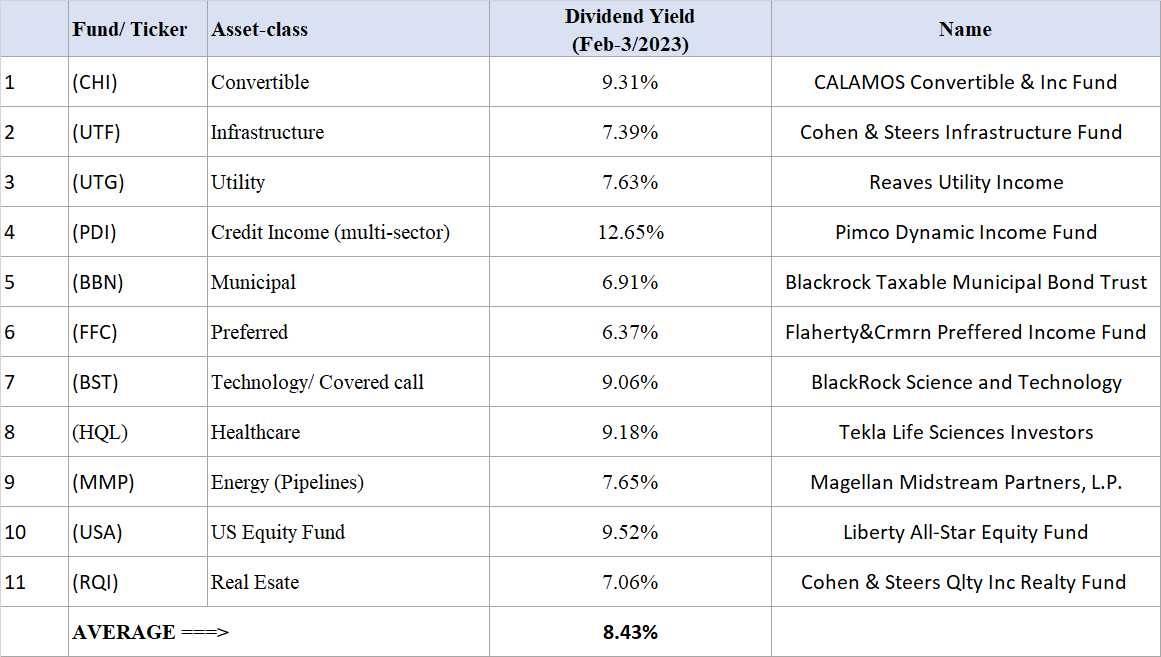
In this bucket, we usually recommend selecting one closed-end fund from each of the 10-12 asset classes that are available. From our articles on CEF funds and also, based on our "8%-CEF-Income" portfolio, these are the eleven funds that we would select. All of these funds are excellent choices per their past history. So, here they are:
Table 3: Table of 11 CEFs:
Note: MMP is a Mid-stream Partnership and issues the K-1 tax form instead of 1099-Div (for corporations).
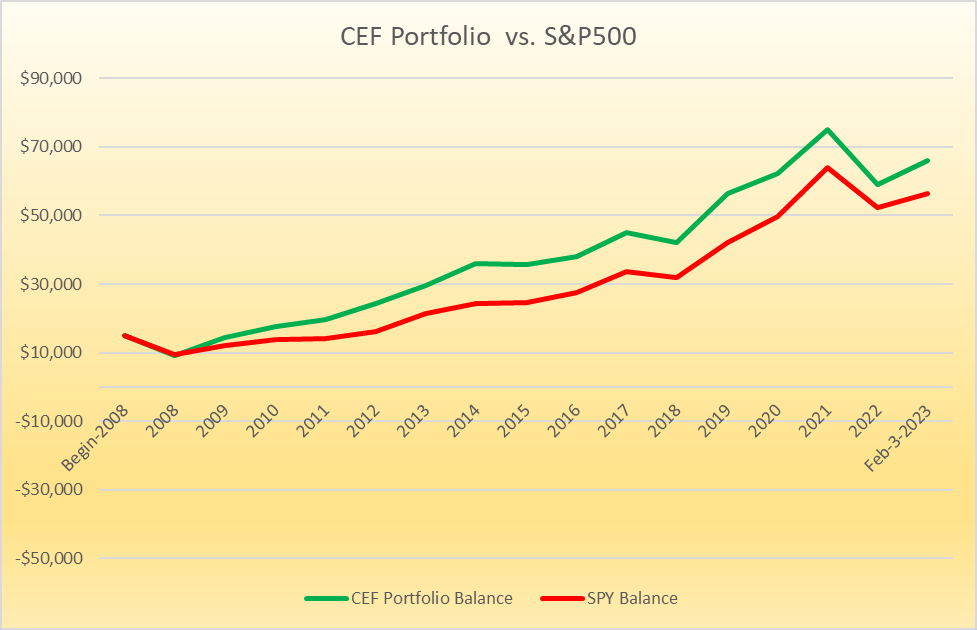
We will assume that we invested equally in these eleven funds for this basket as of the 1st of January 2018. Now we will compare the performance of this portfolio with the S&P 500 from Jan. 1, 2018, until Feb. 3, 2023. Please keep in mind that many of these funds use leverage, and this portfolio does not provide any downside protection. That's why we recommend an allocation of no more than 25% but preferably less (our portfolio allocated only 15%). The only purpose is to boost the overall income of the portfolio.
Note: A couple of securities in our portfolio (for example, PDI, BST) did not have histories going back to the year 2008. For the purpose of backtesting, we have replaced them with suitable replacements, for example, PDI with PIMCO Corporate & Income Fund ( PTY ) and BST with QQQ (Invesco QQQ ETF) for the years that these securities did not exist.
Chart 4: Performance of CEF portfolio vs. S&P500
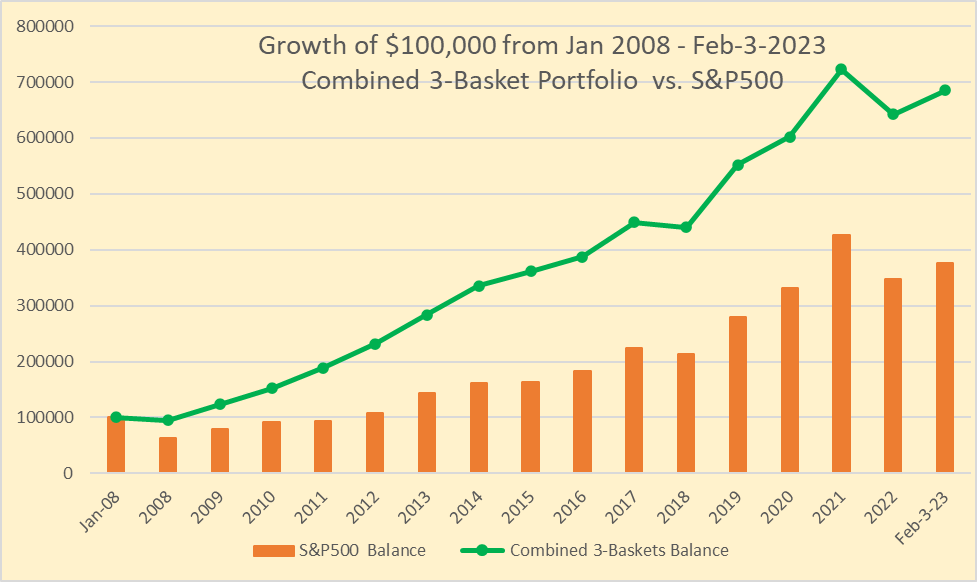
Combined 3-Basket Portfolio Performance (from January 2008 until now)
Here, we will provide the backtesting results for the combined 3-basket portfolio starting from Jan. 1, 2008, until Feb. 3, 2023. This period includes the financial crisis of 2008-2009, the pandemic-induced correction in 2020, and the recent period of unprecedented high inflation and rising interest rates. For the combined portfolio, we include the DGI-stock portfolio (and not the DGI-ETF portfolio).
Please note how the green and orange linear lines are diverging over time, indicating that over a long period of time, the three-basket portfolio outperforms the S&P 500 while avoiding a roller-coaster ride at the same time. Over a nearly 15-year period, the three-basket portfolio achieved an 80% outperformance compared to the S&P 500 with 30% less volatility. An initial amount of $100,000 invested in 2008 would have grown to $685,000 in the 3-basket portfolio, compared to only $375,000 in the S&P500.
Chart 5:
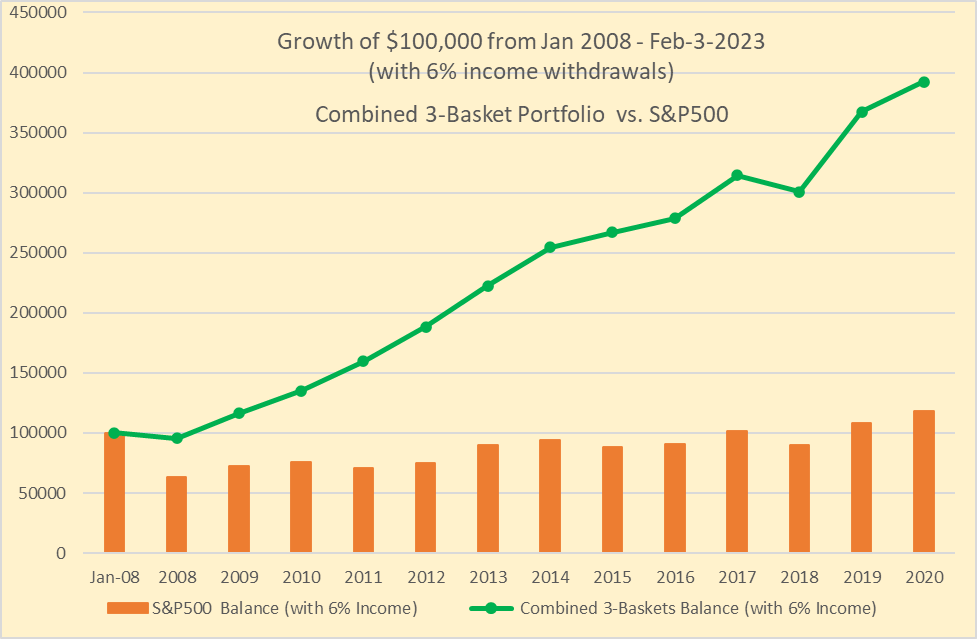
Performance comparison when 6% of income is withdrawn:
Now let's see how our combined three-basket portfolio would have fared since 2008 in comparison to the S&P 500 if we were to withdraw 6% inflation-adjusted income each year. As you can see from the below chart, the S&P 500 did not fare very well when the income was withdrawn. However, the combined three-basket portfolio continued to perform very well. One of the main reasons for the S&P 500's underwhelming performance is high volatility and big drawdowns. In fact, this is the most important chart of this analysis because it highlights so clearly the dangers of sequential risk from the S&P 500 while the three-basket portfolio prospered in the same environment.
Chart 5B:
Concluding Thoughts
Obviously, the future always is uncertain, and more so right now when the market is giving conflicting signals. But we are fairly certain and optimistic that whatever the market may do, whether it goes up, declines from here, or stays flat, our diversified multi-basket portfolio should perform reasonably well in good times and bad. Our hedged part of the portfolio (rotational) acts as a counterbalance to the buy-and-hold part ((DGI and CEF)) and should cushion any downside impact. Moreover, one can be assured of a consistent and good income stream that would not be impacted much by any recessionary times. We have presented and demonstrated, with the help of backtesting over a period of 15 years, how this strategy model can set you on a path to financial freedom and stress-free investing.
For further details see:
How This Income Method Could Lead To Financial Freedom