MSFT - How To Allocate $10000 Among My Top 10 Stocks For May 2023
2023-04-27 16:00:38 ET
Summary
- In this article, I will demonstrate how you could allocate $10,000 among my top 10 dividend growth companies for May 2023.
- The investment portfolio, which consists of 10 selected companies and the Schwab U.S. Dividend Equity ETF, provides you with a Weighted Average Dividend Growth Rate [CAGR] of 14.09%.
- At the same time, you achieve broad diversification with this portfolio: no individual position and no industry (besides the ETF) represent more than 7% of the overall portfolio.
Investment Thesis
The allocation of your investment portfolio has a significant impact on the Total Return that you achieve over the long-term.
In a previous article , I discussed in detail my top 10 dividend growth stocks to invest for May 2023. Today, I would like to show you how you could allocate $10,000 among these dividend growth stocks.
In doing so, I will show you an investment portfolio with a broad diversification over industries and sectors. In order to achieve a broad diversification and to reduce the risk level of this portfolio consisting of 10 dividend growth companies, I have included an ETF. By including the Schwab U.S. Dividend Equity ETF (NYSEARCA: SCHD ), it not only achieves a broader diversification and a reduced risk level for the portfolio, but it also raises the Weighed Average Dividend Yield and Weighted Average Dividend Growth Rate.
The portfolio that I will present in this article, has a Weighted Average Dividend Yield [TTM] of 2.60% while the selected picks have shown a Weighted Average Dividend Growth Rate [CAGR] of 14.09% over the past 5 years.
I have selected the following as my top 10 dividend growth companies to invest in for May 2023:
- American Express (NYSE: AXP )
- Apple (NASDAQ: AAPL )
- Itaú Unibanco Holding S.A. (NYSE: ITUB )
- JPMorgan (NYSE: JPM )
- Mastercard (NYSE: MA )
- Microsoft (NASDAQ: MSFT )
- Nike (NYSE: NKE )
- Linde (NYSE: LIN )
- The Charles Schwab Corporation (NYSE: SCHW )
- The Travelers Companies (NYSE: TRV )
Overview of the 10 Dividend Growth Companies and ETF to invest in for May 2023 and the Portfolio Allocation
| Company Name |
| Sector |
| Industry |
| Country |
| Dividend Yield [TTM] |
| Dividend Growth 5Y |
| P/E [FWD] Ratio |
| Proportion |
| Amount in $ |
| American Express |
| Financials |
| Consumer Finance |
| United States |
| 1.32% |
| 9.53% |
| 14.7 |
| 5% |
| 500 |
| Apple |
| Information Technology |
| Technology Hardware, Storage and Peripherals |
| United States |
| 0.55% |
| 7.87% |
| 27.9 |
| 7% |
| 700 |
| Itaú Unibanco Holding S.A. |
| Financials |
| Diversified Banks |
| Brazil |
| 3.88% |
| 30.04% |
| 7.1 |
| 2% |
| 200 |
| JPMorgan Chase & Co. |
| Financials |
| Diversified Banks |
| United States |
| 2.84% |
| 12.91% |
| 10.0 |
| 5% |
| 500 |
| Linde |
| Materials |
| Industrial Gases |
| United Kingdom |
| 1.30% |
| 8.46% |
| 27.4 |
| 3% |
| 300 |
| Mastercard |
| Financials |
| Transaction & Payment Processing Services |
| United States |
| 0.57% |
| 17.66% |
| 30.7 |
| 6% |
| 600 |
| Microsoft |
| Information Technology |
| Systems Software |
| United States |
| 0.91% |
| 9.92% |
| 30.6 |
| 6% |
| 600 |
| Nike |
| Consumer Discretionary |
| Footwear |
| United States |
| 1.04% |
| 11.16% |
| 38.5 |
| 5% |
| 500 |
| Charles Schwab |
| Financials |
| Investment Banking and Brokerage |
| United States |
| 1.65% |
| 21.22% |
| 16.3 |
| 3% |
| 300 |
| The Travelers Companies |
| Financials |
| Property and Casualty Insurance |
| United States |
| 2.08% |
| 5.25% |
| 12.4 |
| 3% |
| 300 |
| Schwab U.S. Dividend Equity ETF |
| ETFs |
| ETFs |
| United States |
| 3.61% |
| 15.56% |
| 55% |
| 5500 |
| Average |
| 2.60% |
| 14.09% |
| 20.2 |
| 100.00% |
| 10000 |
Source: The Author
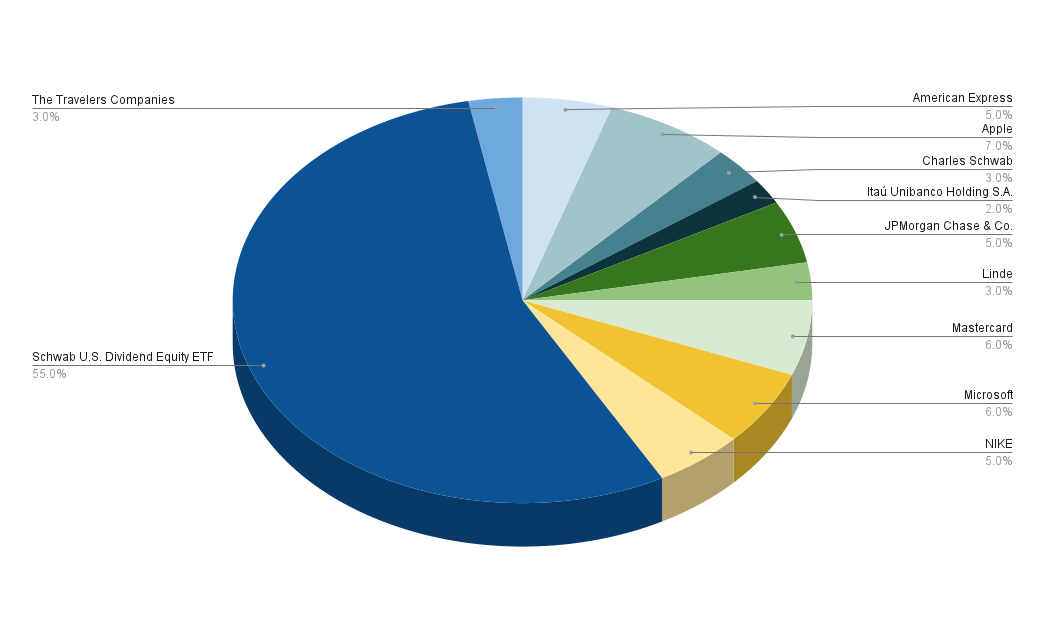
Portfolio Allocation per Company
The following ETF/companies have the highest proportion of this investment portfolio that focuses on dividend growth:
- Schwab U.S. Dividend Equity ETF (55%)
- Apple (7%)
- Mastercard (6%)
- Microsoft (6%)
- American Express (5%)
- JPMorgan (5%)
- Nike (5%)
First, I would like to highlight that I suggest giving the Schwab U.S. Dividend Equity ETF the highest proportion of the overall portfolio.
If the amount of $10,000 was equally distributed among the 10 dividend growth companies, the risk of the portfolio would be too high. This is because each individual position would then have a proportion of 10%. This would mean that a possible decline of the share price of one of the selected companies (for example: as a result of a dividend cut) would have a strong negative impact on the Total Return of your investment portfolio. Therefore, I have selected the Schwab U.S. Dividend Equity ETF to have the highest proportion of this portfolio.
I have chosen the Schwab U.S. Dividend Equity ETF for this as it not only provides investors with an attractive Dividend Yield [TTM] of 3.61%, but also with an appealing Dividend Growth Rate [CAGR] of 11.72% over the past 10 years.
I would like to remind you of the following that I mentioned in a previous article :
The companies that have the highest proportion on the portfolio have a significant impact on the Total Return that the portfolio provides . By overweighting companies that give us relatively low risk factors and at the same time offer an attractive expected compound annual rate of return, we significantly increase the probability of making successful long-term investments.
I consider all of the companies that are overweighted in this portfolio to be excellent choices in terms of risk and reward: Apple, Mastercard, Microsoft, American Express, JPMorgan and Nike.
This means that I believe the risk of investing in these companies is relatively low, while I consider the reward (which can be expressed by the expected compound annual rate of return) to be relatively high.
The following companies have a lower proportion of the overall portfolio:
- Charles Schwab (3%)
- Linde (3%)
- The Travelers Companies (3%)
- Itaú Unibanco (2%)
I consider the risks that come attached to these companies as being higher when compared to the others that I've already mentioned (which are overweighted in the investment portfolio).
By underweighting these companies that come with a higher risk level, we ensure that a possible stock price decline in one of these selected picks would have a significantly lower negative impact on the overall performance of our investment portfolio (since each of these picks only make up a small proportion when compared to the overall investment portfolio). Thus, we reduce the risk level of the investment portfolio by underweighting those companies that come along with higher risk factors.
Apple is the position with the highest proportion (7%) of the overall investment portfolio. Therefore, my requirement of not having an individual position with a proportion of more than 10% of the overall portfolio has been fulfiled.
This requirement helps us to reduce the risk level of our portfolio, and at the same time, it increases the probability of achieving excellent investment results over the long term.
Illustration of the Portfolio Allocation per Company
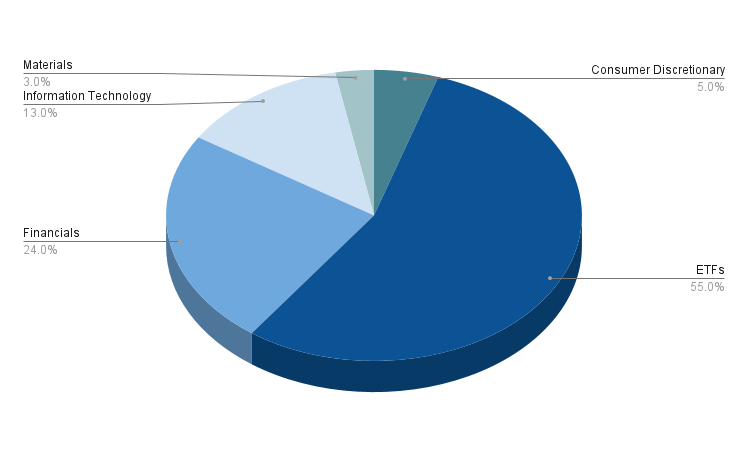
Portfolio Allocation per Sector
Besides the ETF (with a proportion of 55% of the overall portfolio), the Financials Sector (representing 24%) is the one with the highest proportion of the overall portfolio, followed by the Information Technology Sector (13%).
The Consumer Discretionary Sector (5%) and the Materials Sector (3%) make up a lower proportion of the overall portfolio.
Since no sector (besides the ETF) makes up more than 24% of the overall portfolio, it can be stated that the diversification requirements (in not having one sector representing more than 30%) have been fulfiled.
Below you can find an illustration that shows the proportion that each sector has in regard to the overall portfolio.
Illustration of the Portfolio Allocation per Sector
Below you can see which companies belong to each sector of this investment portfolio:
ETFs (55%):
- Schwab U.S. Dividend Equity ETF (55%)
Financials (24%):
- Mastercard (6%)
- American Express (5%)
- JPMorgan Chase & Co. (5%)
- Charles Schwab (3%)
- The Travelers Companies (3%)
- Itaú Unibanco Holding S.A. (2%)
Information Technology (13%):
- Apple (7%)
- Microsoft (6%)
Consumer Discretionary (5%):
- Nike (5%)
Materials (3%):
- Linde (3%)
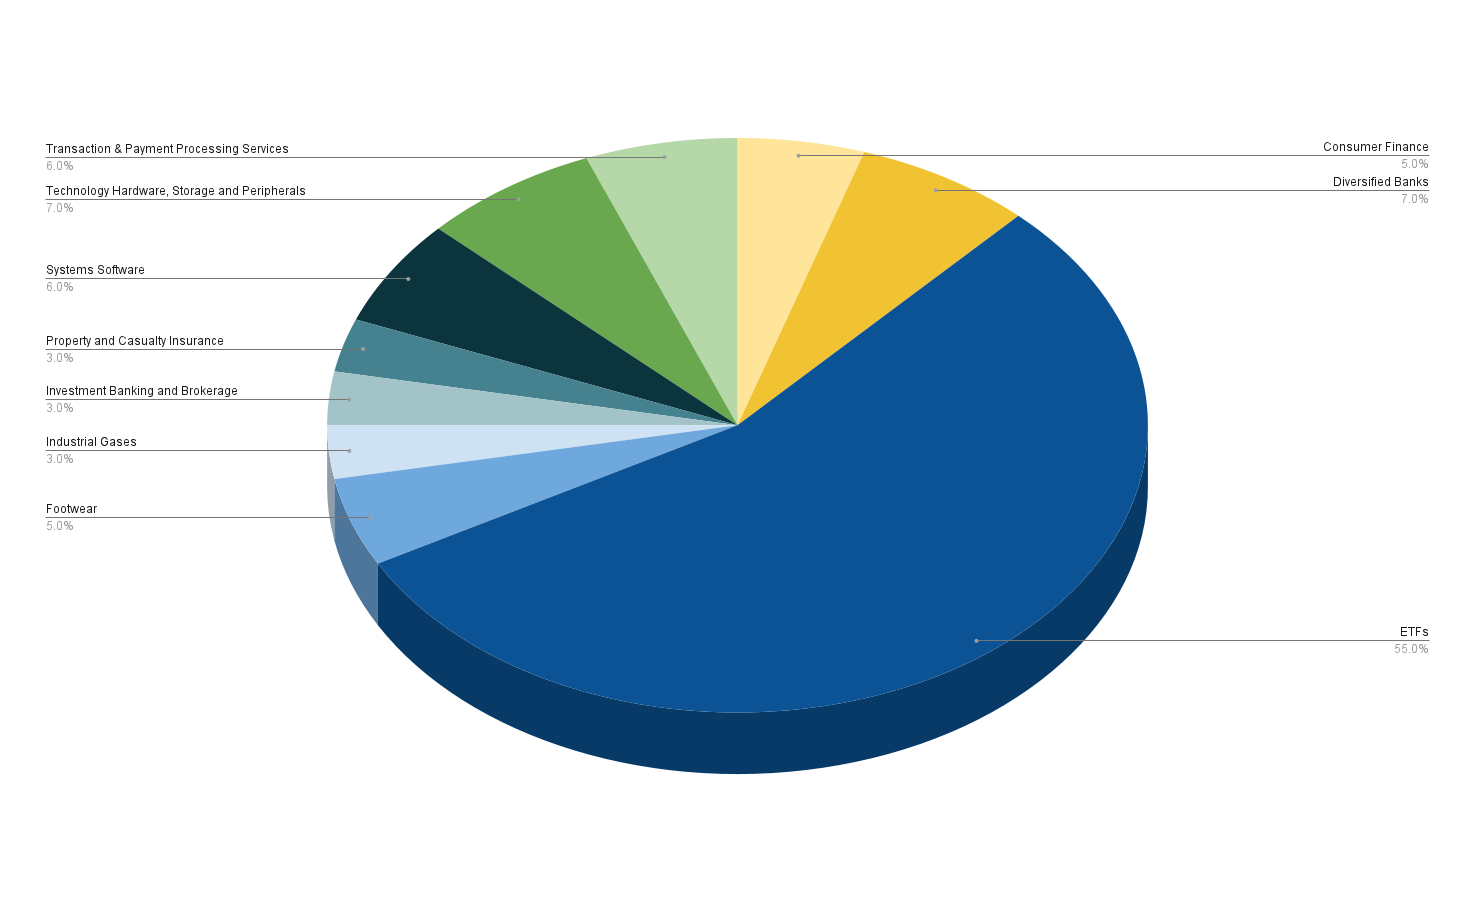
Portfolio Allocation per Industry
The industries that make up the highest percentage of the overall portfolio (beside the ETF) are the Diversified Banks Industry with JPMorgan (representing 5%) and Itaú Unibanco Holding S.A. (2%) making up 7% of the overall portfolio, and the Technology Hardware, Storage and Peripherals Industry (Apple makes up 7% of the portfolio). This is followed by the Systems Software Industry (Microsoft represents 6%), and the Transaction & Payment Processing Services Industry (Mastercard also represents 6%).
The Consumer Finance Industry (with American Express representing 5%) and the Footwear Industry (with Nike representing 5%) still represent a relatively significant proportion of the overall portfolio.
The Industrial Gases Industry (with Linde representing 3%), the Investment Banking and Brokerage Industry (Charles Schwab representing 3%) and the Property and Casualty Insurance Industry (The Travelers Companies representing 3%) have a relatively small proportion of the overall portfolio.
No Industry (beside the ETF) holds a proportion of more than 7% of the overall portfolio, demonstrating that it's relatively diversified despite only consisting of 10 companies and one ETF.
Illustration of the Portfolio Allocation per Industry
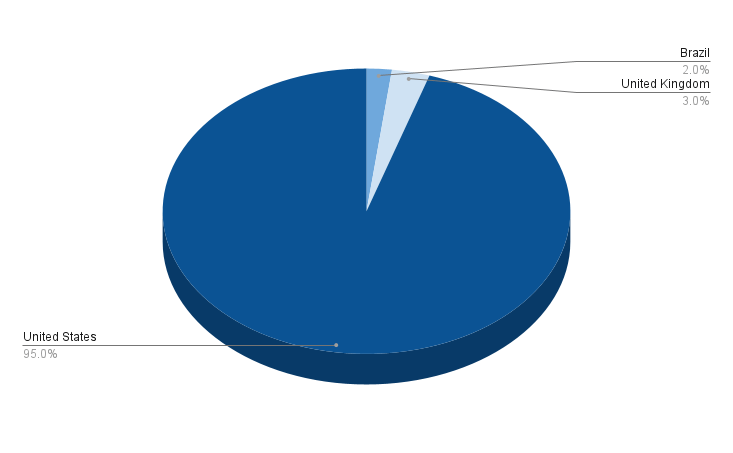
Portfolio Allocation per Country
The majority of companies/ETFs that are part of this dividend growth investment portfolio, are from the United States (95%). One of the main reasons for this is that the Schwab U.S. Dividend Equity ETF is mainly invested in companies from the United States.
Only two picks are from companies outside the U.S.: Itaú Unibanco Holding S.A. (Brazil) and Linde (United Kingdom). Since both companies are underweighted in this portfolio (with Itaú Unibanco Holding S.A. representing 2% of the portfolio and Linde representing 3%), the companies based outside the U.S. represent a small proportion of this portfolio.
Thus, my geographical diversification requirement of having the majority of companies from the United States and at least 5% from outside have been met.
Illustration of the Portfolio Allocation per Country
How to achieve an even Broader Diversification
If you would like to achieve an even broader diversification than this investment portfolio offers, you might consider investing in an additional ETF: you could take a closer look at the iShares Core Dividend Growth ETF (NYSEARCA: DGRO ), since it provides you with a relatively attractive Dividend Yield [TTM] of 3.37% and a Dividend Growth Rate [CAGR] of 10.32% over the past 5 years.
In case you ask yourself if it makes sense to only invest in SCHD, I would like to highlight some advantages of picking stocks individually over only investing in ETFs:
- It provides your portfolio with more individuality and flexibility
- You can protect your investment portfolio against the next stock market crash by adding companies with a low Beta Factor (an example of a company with a low Beta Factor would be Johnson & Johnson (NYSE: JNJ ))
- You can overweight industries with which you are more familiar and you can avoid others you do n't want to invest in
- You can select stocks which you think are able to beat the market or you can select ones to raise the Weighted Average Dividend Yield or Weighted Dividend Growth Rate of your investment portfolio
- You can also achieve an even broader geographical diversification of your portfolio
In my article 10 Dividend Stocks To Show The Advantages Of Investing In Individual Stocks Over ETFs I discuss the advantages of the selection of stocks over ETFs in greater detail.
Conclusion
The objective of today's article was to demonstrate how you could allocate $10,000 among my top 10 dividend growth companies for May 2023.
In order to reduce the risk level of this type of dividend growth portfolio, I have suggested that you include the Schwab U.S. Dividend Equity ETF.
By having this ETF representing 55% of the overall portfolio, you are able to achieve a broad diversification. In addition, it contributes to the fact that the proportion of any individual company on the overall portfolio is lower. This helps you to reduce the portfolio's downside risk: in the event that the stock price of a selected pick was to decline, this would have a lower impact on the Total Return of your investment portfolio.
Due to the fact that I have overweighted companies such as Apple, Microsoft and Mastercard, that provide investors with relatively low risk factors while at the same time offer an attractive expected compound annual rate of return, the probability of achieving excellent investment results when investing over the long term are increased.
Author's Note: Thank you very much for reading and I would love to hear your opinion on this investment portfolio and its allocation!
For further details see:
How To Allocate $10,000 Among My Top 10 Stocks For May 2023