CA - How To Allocate $15000 Among My Top 10 High Dividend Yield Companies For June 2023
2023-05-27 13:00:00 ET
Summary
- Implementing a dividend income-oriented investment strategy is an excellent way to help you generate extra income.
- In today’s article, I will show you how you could allocate $15,000 among one ETF and 10 high dividend yield companies, that I believe are attractive right now.
- The Weighted Average Dividend Yield [TTM] of this investment portfolio is 4.38% while its Weighted Average Dividend Growth Rate is 12.68% over the past 5 years.
Investment Thesis
A dividend income-oriented investment portfolio that provides you with an attractive Dividend Yield as well as Dividend Growth is of particular interest to investors looking to generate extra income which increases year over year.
In today’s article, my goal is to demonstrate how you could allocate $15,000 among one ETF and 10 high dividend yield companies that I consider to be particularly attractive to invest in at this moment in time. Besides having a Weighted Average Dividend Yield [TTM] of 4.38%, the selected companies/ETF, have shown a Weighted Average Dividend Growth Rate of 12.68% over the past 5 years.
These numbers indicate that you should be able to increase significantly your extra income in the form of dividends year over year.
Moreover, I believe that this investment portfolio, which I will show you in more detail in the following, offers a broad diversification over sectors and industries in addition to a broad geographical diversification.
The following are my top 10 high dividend yield stocks for June 2023, which are part of this investment portfolio:
- Allianz ( ALIZF )( ALIZY )
- Altria ( MO )
- AT&T ( T )
- BB Seguridade Participações ( BBSEY )
- Johnson & Johnson ( JNJ )
- Kinder Morgan ( KMI )
- The Bank of Nova Scotia ( BNS )
- United Parcel Service ( UPS )
- U.S. Bancorp ( USB )
- Verizon Communications Inc. ( VZ )
Overview of the 10 selected Picks for June 2023, the selected ETF and the Portfolio Allocation
| Company Name |
| Sector |
| Industry |
| Country |
| Dividend Yield [TTM] |
| Div Growth 5Y |
| Allocation |
| Amount in $ |
| Allianz |
| Financials |
| Multi-line Insurance |
| Germany |
| 5.45% |
| 5.72% |
| 5.0% |
| 750 |
| Altria Group |
| Consumer Staples |
| Tobacco |
| United States |
| 8.21% |
| 7.18% |
| 3.0% |
| 450 |
| AT&T |
| Communication Services |
| Integrated Telecommunication Services |
| United States |
| 6.81% |
| -5.78% |
| 3.0% |
| 450 |
| BB Seguridade Participações S.A. |
| Financials |
| Multi-line Insurance |
| Brazil |
| 9.19% |
| 13.89% |
| 1.5% |
| 225 |
| Johnson & Johnson |
| Health Care |
| Pharmaceuticals |
| United States |
| 2.84% |
| 6.11% |
| 5.0% |
| 750 |
| Kinder Morgan |
| Energy |
| Oil and Gas Storage and Transportation |
| United States |
| 6.75% |
| 14.16% |
| 1.5% |
| 225 |
| The Bank of Nova Scotia |
| Financials |
| Diversified Banks |
| Canada |
| 6.24% |
| 4.38% |
| 4.5% |
| 675 |
| U.S. Bancorp |
| Financials |
| Diversified Banks |
| United States |
| 6.31% |
| 10.00% |
| 2.5% |
| 375 |
| United Parcel Service |
| Industrials |
| Air Freight and Logistics |
| United States |
| 3.67% |
| 12.53% |
| 2.0% |
| 300 |
| Verizon Communications |
| Communication Services |
| Integrated Telecommunication Services |
| United States |
| 7.21% |
| 2.04% |
| 2.0% |
| 300 |
| Schwab U.S. Dividend Equity ETF |
| ETFs |
| ETFs |
| United States |
| 3.74% |
| 15.56% |
| 70.0% |
| 10500 |
| Average |
| 4.38% |
| 12.68% |
| 100.0% |
| 15000 |
Source: The Author
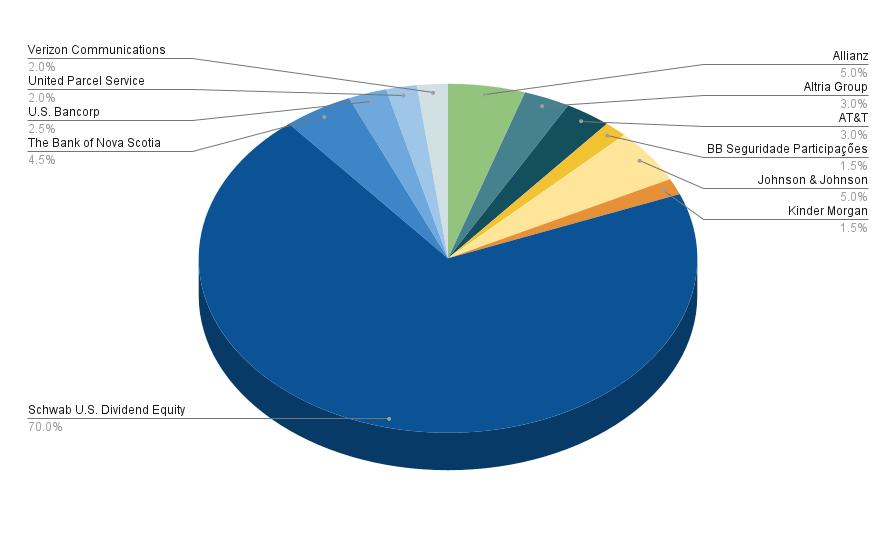
Portfolio Allocation per Company/ETF
The Schwab U.S. Dividend Equity ETF ( SCHD ) holds the highest proportion of the overall portfolio, accounting for 70%.
Since my goal is to show you how you could allocate $15,000 among only one ETF and 10 high dividend yield companies, I have assigned this proportion of 70% to the Schwab U.S. Dividend Equity ETF. This ensures that not one of the selected individual companies has a proportion of more than 5%, thus helping us to reduce the portfolio’s risk level.
The following companies represent the largest individual positions of this investment portfolio:
- Allianz (5%)
- Johnson & Johnson (5%)
- The Bank of Nova Scotia (4.5%)
- Altria (3%)
- AT&T (3%)
These selected picks, which have the highest proportion of the overall portfolio (besides the ETF), share some characteristics: I believe the risks for investors to invest in these companies are relatively low and I expect the annual rate of return (representing the reward for investors) to be relatively high.
In addition, all of these selected picks provide your investment portfolio with an attractive Dividend Yield, while at the same time contributing Dividend Growth. Allianz’s Dividend Yield [TTM] is 5.45%, Johnson & Johnson’s is 2.84%, The Bank of Nova Scotia’s is 6.24%, Altria’s is 8.21% and AT&T’s is 6.81%.
Companies such as Kinder Morgan (1.5% of the overall portfolio) and BB Seguridade Participações S.A. (1.5%) have the smallest proportion of the overall portfolio. The reason being that I believe the risk factors that come attached to an investment in these companies is higher and therefore I suggest underweighting them. By doing so, we ensure that a possible decline of the companies’ stock price (for example as a result of a dividend cut) would have a lower negative impact on the Total Return of our investment portfolio, thus decreasing the level of risk for your portfolio.
Illustration of the Portfolio Allocation per Company/ETF
Source: The Author
Illustration of the Portfolio Allocation per Company when allocating SCHD to the Companies it is invested in
In this chapter, I will describe the portfolio allocation per company when allocating the Schwab U.S. Dividend Equity ETF to the companies it is actually invested in. The principal goal is to ensure that we achieve a broad diversification with this investment portfolio, and to ensure that no individual company has a proportion of more than 5% of the overall portfolio.
Below you can find the 15 largest positions of the investment portfolio when allocating the Schwab U.S. Dividend Equity ETF to the companies it is actually invested in.
As you can see, I have ensured that through the combination of an ETF and individual companies, no single company has a higher proportion than 5% of the overall portfolio. By doing so, I have reduced the risk level as the Total Return of the overall portfolio would be less dependent on the performance of an individual company.
| Company |
| Portfolio Allocation |
| Allianz |
| 5.00% |
| Johnson & Johnson |
| 5.00% |
| Verizon |
| 4.91% |
| Altria |
| 4.89% |
| United Parcel Service |
| 4.75% |
| The Bank of Nova Scotia |
| 4.50% |
| U.S. Bancorp |
| 3.44% |
| PepsiCo |
| 3.23% |
| Merck & Co |
| 3.14% |
| Coca-Cola |
| 3.07% |
| AT&T |
| 3.00% |
| Broadcom |
| 2.88% |
| Home Depot |
| 2.86% |
| AbbVie |
| 2.86% |
| Amgen |
| 2.85% |
Source: The Author
By using an example, I would like to demonstrate how I have calculated these numbers: A proportion of 2.7% of the Schwab U.S. Dividend Equity ETF is invested in Altria. As this ETF makes up 70% of the investment portfolio, this would imply that 1.89% is invested in Altria. Since I have also included Altria as an individual investment (representing 3% of the overall portfolio), this means that 4.89% of the portfolio is represented by Altria (being the sum of 3% and 1.89%).
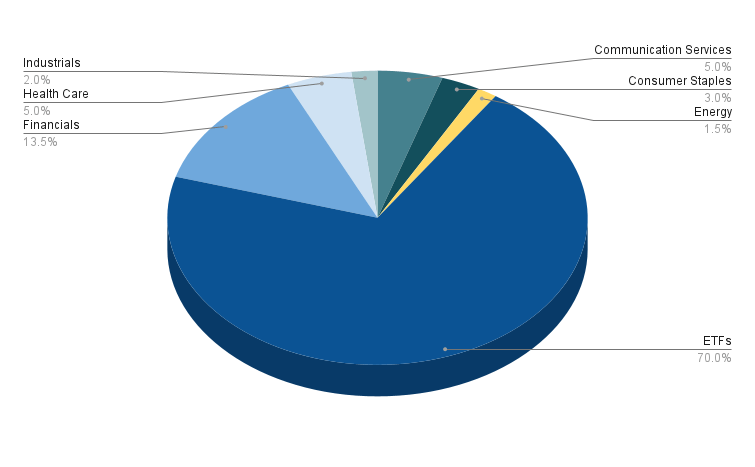
Portfolio Allocation per Sector
Excluding the ETF, which has a proportion of 70% of the overall portfolio, the Financials Sector has the highest proportion (representing 13.5% of the overall portfolio).
The following companies belong to the Financials Sector: Allianz (with a proportion of 5% of the overall portfolio), The Bank of Nova Scotia (4.5%), U.S. Bancorp (2.5%), and BB Seguridade Participações S.A. (1.5%).
The Communication Services Sector has a proportion of 5% of the overall portfolio (with AT&T representing 3% and Verizon 2%). The Health Care Sector also has a proportion of 5% of the portfolio (represented by Johnson & Johnson).
The Consumer Staples Sector makes up 3% (represented by Altria), the Industrials Sector 2% (represented by United Parcel Service), and the Energy Sector 1.5% (represented by Kinder Morgan).
Illustration of the Portfolio Allocation per Sector when allocating SCHD to the ETF Sector
The graphic below shows the portfolio allocation per sector while allocating the Schwab U.S. Dividend Equity ETF to the ETF Sector.
Source: The Author
Below you can find the list of companies/ETFs that belong to each sector.
ETFs (70%)
- Schwab U.S. Dividend Equity ETF (70%)
Financials (13.5%)
- Allianz (5%)
- The Bank of Nova Scotia (4.5%)
- U.S. Bancorp (2.5%)
- BB Seguridade Participações S.A. (1.5%)
Communication Services (5%)
- AT&T (3%)
- Verizon (2%)
Health Care (5%)
- Johnson & Johnson (5%)
Consumer Staples (3%)
- Altria (3%)
Industrials (2%)
- United Parcel Service (2%)
Energy (1.5%)
- Kinder Morgan (1.5%)
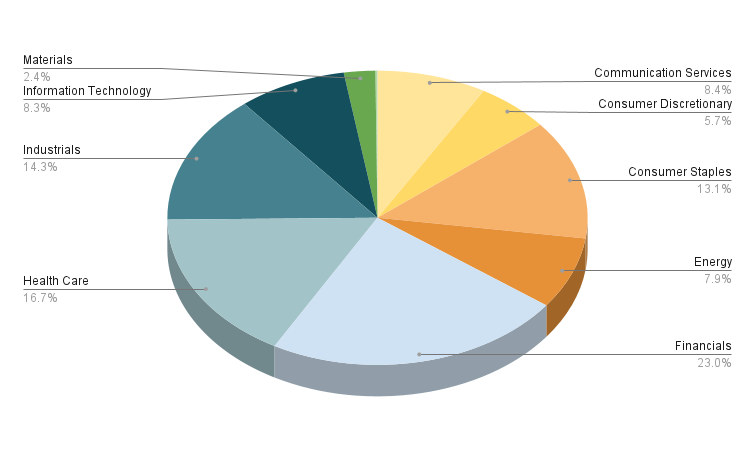
Illustration of the Portfolio Allocation per Sector when allocating the ETF among the Companies and Sectors it is invested in
Below you can find a graphic that shows the sectors of this investment portfolio when allocating the Schwab U.S. Dividend Equity ETF among the companies and sectors it’s actually invested in. By doing so, we ensure that no sector is overrepresented.
Source: The Author
After having allocated the Schwab U.S. Dividend Equity ETF to the companies and sectors it is actually invested in, we can see that the Financials Sector makes up the highest proportion of the overall portfolio (with 23%).
The Health Care Sector is the second largest with a proportion of 16.7%. The third largest is the Industrials Sector with a percentage of 14.3%, followed by the Consumer Staples Sector (13.1%).
The Communication Services Sector makes up 8.4% of the overall portfolio, while the Information Technology Sector is at 8.3%, and the Energy Sector 7.9%.
A smaller percentage is represented by companies from the Consumer Discretionary Sector (5.7%) and the Materials Sector (2.4%).
I believe this portfolio has a relatively broad diversification over sectors, which is based on the fact that no sector has a proportion of more than 25%.
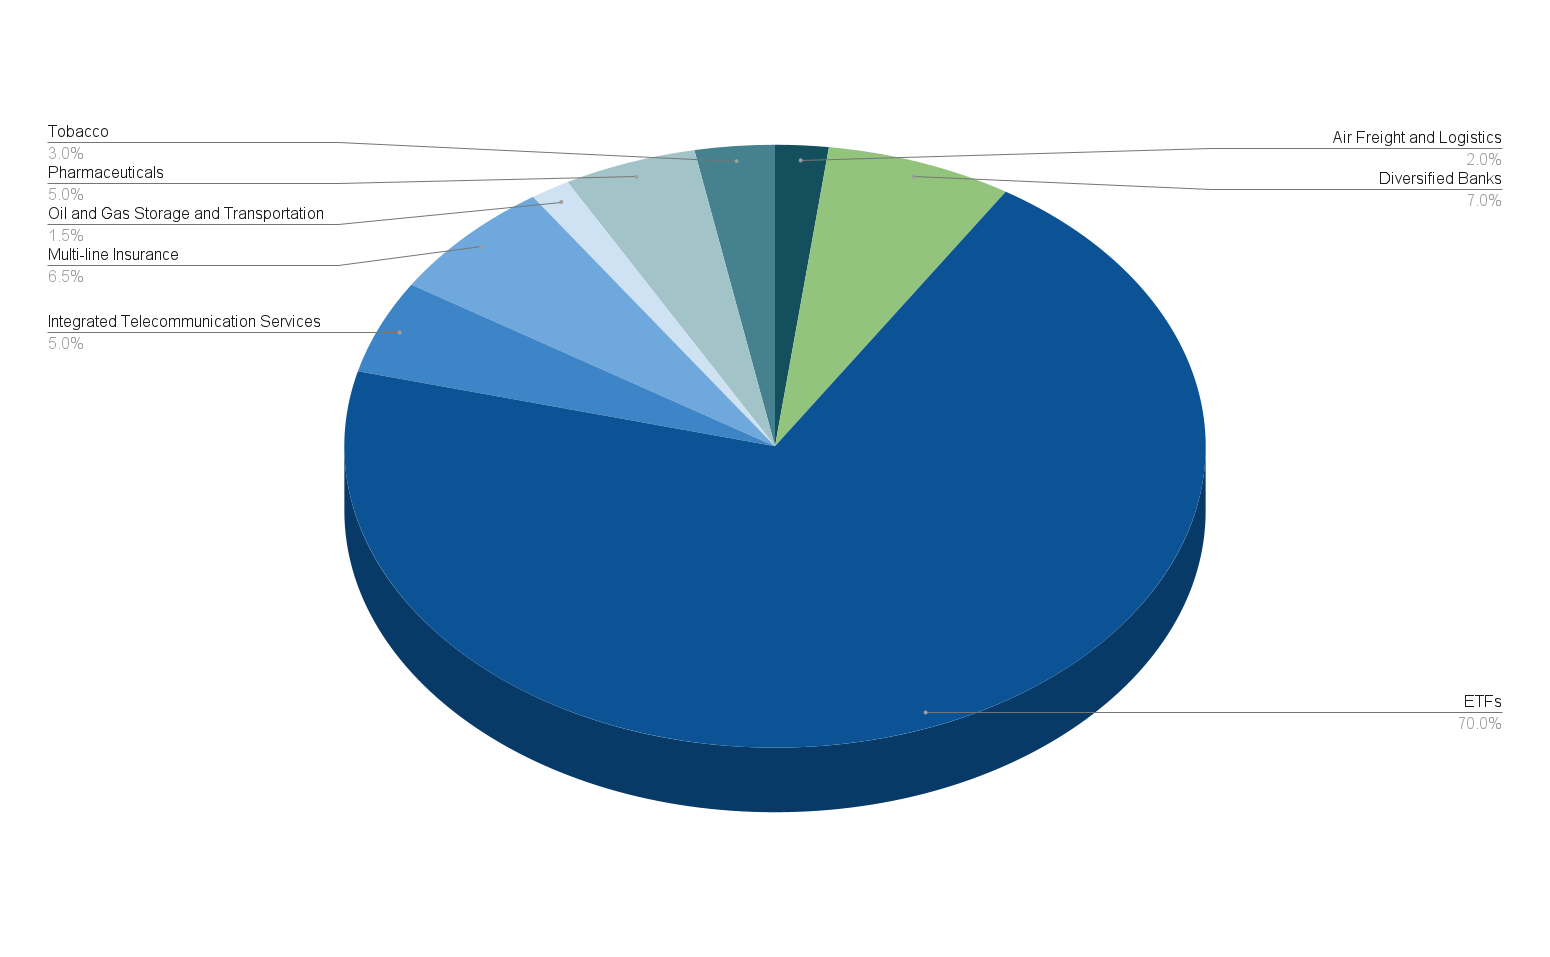
Portfolio Allocation per Industry
The graphic below shows the portfolio allocation per industry when allocating the Schwab U.S. Dividend Equity ETF to the ETF Industry.
It can be highlighted that (excluding the Schwab U.S. Dividend Equity ETF), the Diversified Banks Industry (with 7% of the overall portfolio) represents the largest Industry, followed by the Multi-line Insurance Industry (6.5%), the Pharmaceuticlas Industry (5%), and the Integrated Telecommunication Services Industry (5%).
Companies from the Tobacco Industry (3%), the Air Freight and Logistics Industry (2%), and the Oil and Gas Storage and Transportation Industry (1.5%) represent the smallest proportion of the overall portfolio.
The fact that no Industry has a proportion of more than 7%, strengthens my belief that the portfolio is broadly diversified over industries.
Illustration of the Portfolio Allocation per Industry when allocating SCHD to the ETF Industry
Source: The Author
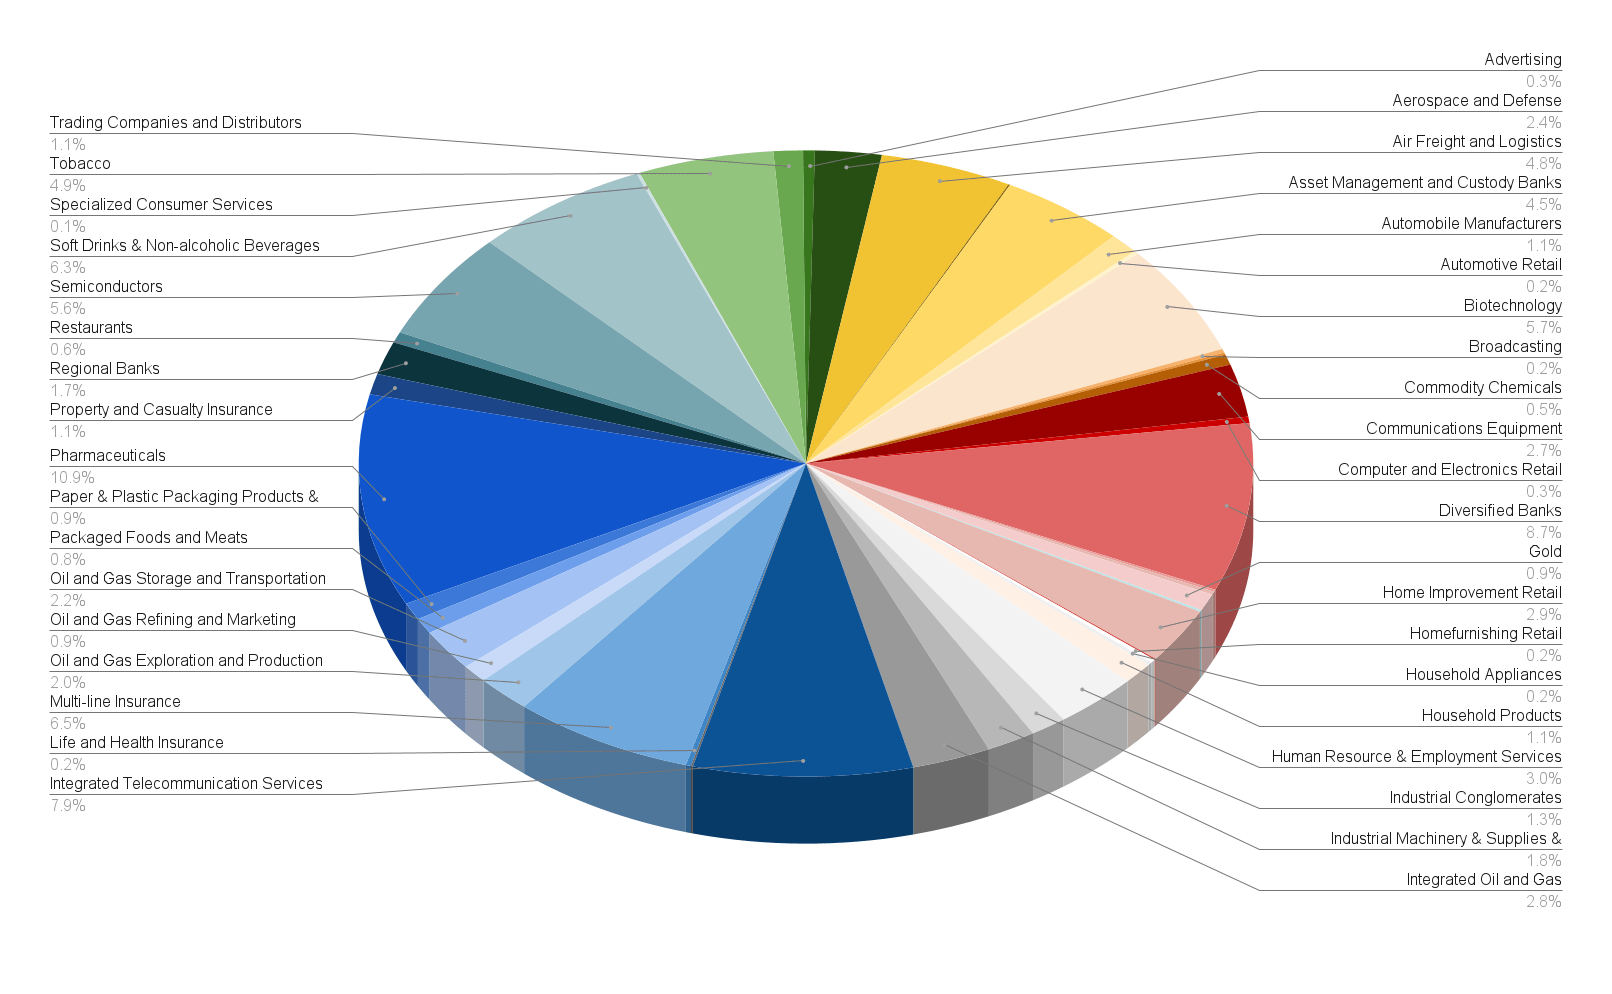
Illustration of the Portfolio Allocation per Industry when allocating the ETF among the Companies and Industries it is invested in
Below you can find a graphic that illustrates the allocation of this investment portfolio when allocating the Schwab U.S. Dividend Equity ETF among the companies and industries it is actually invested in.
Source: The Author
The graphic shows that the Pharmaceuticals Industry is the one with the highest percentage of the overall portfolio (10.9%), followed by the Diversified Banks Industry (8.7%), the Integrated Telecommunication Services Industry (7.9%), and the Multi-line Insurance Industry (6.5%).
The Soft Drinks & Non-alcoholic Beverages Industry makes up 6.3% of the overall portfolio, the Biotechnology Industry 5.7%, the Semiconductors Industry 5.6% and the Tobacco Industry 4.9%. All other industries represent an even smaller percentage.
The fact that no industry has a proportion of more than 11% of the overall portfolio, shows that this portfolio is broadly diversified over industries.
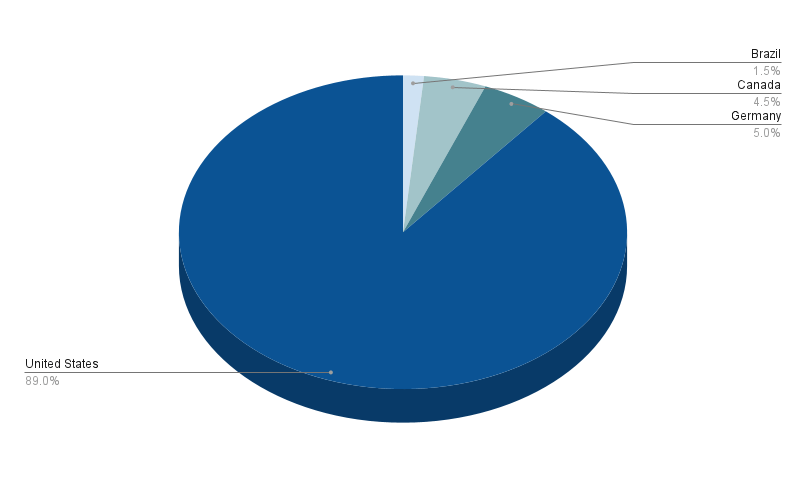
Portfolio Allocation per Country
Below you can find a graphic that illustrates the portfolio allocation per country.
You can see that 89% of this portfolio is represented by companies that are based within the U.S. while 11% are based outside the United States.
From the 11% of companies that are based outside the United States, 5% are from Germany (represented by Allianz), 4.5% come from Canada (represented by The Bank of Nova Scotia), and 1.5% are from Brazil (represented by BB Seguridade Participações S.A.).
Due to the fact that the largest number of companies from this investment portfolio are based in the U.S. while still including companies from outside, my geographical diversification requirements have been fulfilled.
Illustration of the Portfolio Allocation per Country
Source: The Author
How to achieve an even Broader Diversification
If you would like to achieve an even broader diversification than this investment portfolio offers , you might consider invest ing in an additional ETF: you could take a closer look at the iShares Core Dividend Growth ETF ( DGRO ), since it provides you with a relatively attractive Dividend Yield [TTM] of 3.37% and a Dividend Growth Rate [CAGR] of 10.32% over the past 5 years.
In case you ask yourself if it makes sense to only invest in SCHD, I would like to highlight some advantages of picking stocks individually over only investing in ETFs:
- It provides your portfolio with more individuality and flexibility
- You can protect your investment portfolio against the next stock market crash by adding companies with a low Beta Factor (an example of a company with a low Beta Factor would be Johnson & Johnson, which is part of this portfolio)
- You can overweight industries with which you are more familiar and you can avoid others you do n’t want to invest in
- You can select stocks which you think are able to beat the market or you can select ones to raise the Weighted Average Dividend Yield or Weighted Dividend Growth Rate of your investment portfolio
- You can also achieve an even broader geographical diversification of your portfolio
In my article 10 Dividend Stocks To Show The Advantages Of Investing In Individual Stocks Over ETFs I discuss the advantages of the selection of stocks over ETFs in greater detail.
Conclusion
In this article, I have shown you how you could allocate $15,000 among an ETF and my top 10 high dividend yield companies for June 2023.
Through the allocation of the portfolio, we have achieved a broad diversification over sectors, industries and countries.
In addition to that, it can be highlighted that the portfolio offers a Weighted Average Dividend Yield [TTM] of 4.38%. I consider this Weighted Average Dividend Yield to be attractive for investors, since it allows you to earn a significant amount of extra income without the need to sell some of your stocks to obtain capital gains.
Moreover, I believe that such a portfolio can help you increase the annual income via dividends that you receive year over year. My belief is based on the fact that the selected picks have shown a Weighted Average Dividend Growth Rate of 12.68% over the past 5 years.
Implementing this dividend income investment strategy that aims to combine an attractive Dividend Yield with Dividend Growth, allows you to steadily increase your wealth while always being in control of your invested money.
Author’s Note: Thank you very much for reading and I would appreciate hear ing your opinion on this investment portfolio and its allocation! Do you own or plan to acquire one of the selected picks? Any suggestion to improve my analyses is much appreciated! Thank you!
For further details see:
How To Allocate $15,000 Among My Top 10 High Dividend Yield Companies For June 2023