XOM - How To Allocate $25000 Among 10 Dividend Income And Dividend Growth Companies And ETFs
Summary
- In this article, I will show you how you could allocate $25,000 among 10 dividend income and dividend growth companies as well as ETFs.
- The 10 selected picks provide you with a Weighted Average Dividend Yield [TTM] of 3.25% while they have shown a Weighted Average Dividend Growth Rate of 9.30%.
- Besides an attractive Dividend Yield and Dividend Growth Rate, this retirement portfolio that I have developed for you, provides a broad risk diversification.
Investment Thesis
In this article, I have built an investment portfolio for your retirement, consisting of 10 positions, which aims to not only offer an attractive Dividend Yield [TTM] but also significant Dividend Growth.
This retirement portfolio provides investors with a Weighted Average Dividend Yield [TTM] of 3.25% and, at the same time, the 10 selected picks (from which 2 are dividend paying ETFs and 8 dividend paying companies) have shown a Weighted Average Dividend Growth Rate of 9.30% over the past 5 years. This significant Weighted Average Dividend Growth Rate over the last 5 years strengthens my belief that it should be able to provide you with significant Dividend Growth in the years ahead.
No Industry has a percentage of more than 8% of the overall portfolio, making it a broadly diversified investment portfolio.
I would like to repeat the pillars of my investment approach:
- Relatively high Average Dividend Yield of the companies
- Relatively high Average Dividend Growth Rate
- Attractiveness in terms of risk and reward
- Companies with strong competitive advantages that provide an economic moat
- Companies with strong financials
- Companies with a relatively high brand value
- Consumer familiarity with the products of these companies
- Attractive Valuation of the companies
- Aiming to achieve a relatively high Yield on Cost when having a long investment horizon
- Risk diversification across sectors and industries
These are the selected ETFs and companies that are part of this portfolio:
- Apple (NASDAQ: AAPL )
- BlackRock (NYSE: BLK )
- British American Tobacco (NYSE: BTI )
- iShares Core High Dividend ETF (NYSEARCA: HDV )
- JPMorgan (NYSE: JPM )
- McDonald's (NYSE: MCD )
- Microsoft (NASDAQ: MSFT )
- Realty Income (NYSE: O )
- Schwab Strategic Trust - Schwab U.S. Dividend Equity ETF (NYSEARCA: SCHD )
- Visa (NYSE: V )
Overview of the selected ETFs and Companies
| Company |
| Sector |
| Industry |
| Country |
| Dividend Yield |
| 5 Year Average Dividend Growth |
| Proportion |
| Apple |
| Information Technology |
| Technology Hardware, Storage and Peripherals |
| United States |
| 0.62% |
| 7.87% |
| 5.0% |
| BlackRock |
| Financials |
| Asset Management and Custody Banks |
| United States |
| 2.83% |
| 14.31% |
| 8.0% |
| British American Tobacco |
| Consumer Staples |
| Tobacco |
| Great Britain |
| 6.94% |
| -1.78% |
| 3.0% |
| HDV - iShares Core High Dividend ETF |
| ETFs |
| ETFs |
| United States |
| 3.70% |
| 4.73% |
| 30.0% |
| JPMorgan |
| Financials |
| Diversified Banks |
| United States |
| 2.79% |
| 13.54% |
| 4.0% |
| McDonald's |
| Consumer Discretionary |
| Restaurants |
| United States |
| 2.20% |
| 8.26% |
| 4.0% |
| Microsoft |
| Information Technology |
| Systems Software |
| United States |
| 1.04% |
| 9.92% |
| 4.0% |
| Realty Income |
| Real Estate |
| Retail REITs |
| United States |
| 4.66% |
| 3.79% |
| 8.0% |
| SCHD - Schwab Strategic Trust - Schwab U.S. Dividend Equity ETF |
| ETFs |
| ETFs |
| United States |
| 3.44% |
| 13.74% |
| 30.0% |
| Visa |
| Information Technology |
| Data Processing and Outsourced Services |
| United States |
| 0.75% |
| 17.55% |
| 4.0% |
| 3.25% |
| 9.30% |
| 100.0% |
Source: The Author, data from Seeking Alpha
An investment portfolio that provides you today with a Weighted Average Dividend Yield [TTM] of 3.25% while implying a Weighted Average Dividend Growth Rate of 9.30% in the future, would mean that you could achieve a Yield on Cost of 7.91% in 2033 and 19.24% in 2043.
Below you can find a graphic that illustrates the allocation of this investment portfolio. You can see that the two selected ETFs (SCHD and HDV) make up 60% of the total portfolio. Since the largest part of this investment portfolio for retirement consists of ETFs, you achieve a broad risk diversification.
The graphic below demonstrates the Industry-based allocation. Due to the fact that no Industry has a percentage of more than 8%, the investment portfolios' broad diversification is, once again, underlined.
Apple
In my opinion, Apple is a must have stock for anybody aiming to invest for retirement. My statement is underlined by the fact that the company is the largest position of my personal investment portfolio.
I expect the company to continue to raise its Dividend significantly in the years ahead. Apple's Average EPS Diluted Growth Rate [FWD] has been 15.45% over the past 5 years and its Average EBIT Growth Rate [FWD] has been 9.44%. Both metrics strengthen my belief that the company should be able to continue to raise its Dividend in the upcoming years. Its Average Free Cash Flow Per Share Growth Rate [FWD] of 9.49% once again underlines this statement.
However, as an Apple investor, you don't only benefit from the Dividend Growth that it provides you with. You can also benefit from the enormous share buyback program that the company offers. In 2022, for example, the company bought back the enormous amount of $90 billion of its own shares .
At its current price level, I see Apple as being fairly valued: the company's P/E [FWD] Ratio of 24.60 is in line with the Sector Median (which is also 24.60). In addition to that, its P/E [FWD] Ratio of 24.60 is only slightly above its Average P/E [FWD] Ratio over the past 5 years (which is 23.26), indicating, once again, that Apple is currently fairly valued.
BlackRock
There are numerous reasons why BlackRock is part of this selection of dividend income stocks for your retirement investment portfolio.
The company shows strong results in terms of Profitability: BlackRock has an EBITDA Margin [TTM] of 38.59%. This number lies 91.05% above the Sector Median (which is 20.20%), indicating that the company is more profitable than its competitors.
Furthermore, the company has produced excellent results when it comes to Growth: BlackRock has shown an Average Free Cash Flow Per Share Growth Rate [FWD] of 22.61% over the past 5 years and an EPS Diluted Growth Rate [FWD] of 10.14%.
In addition to the above, I think that BlackRock is fairly valued at this moment of writing, which is proven by the fact that its P/E [FWD] Ratio of 19.49 is in line with its Average P/E [FWD] Ratio of the past 5 years (19.18): its current P/E [FWD] Ratio only stands 1.60% above the Average of the last 5 years.
The company's current Dividend Yield [TTM] of 2.87% stands 17.53% above its Average Dividend Yield [TTM] of 2.44%, which acts as a further indicator that it's currently fairly valued. The same is proven by BlackRock's current Price / Cash Flow [TTM] Ratio of 20.63, which is 21.42% below its Average Price / Cash Flow [TTM] Ratio over the past 5 years (which is 26.26), indicating that the price you currently pay for the company's stock is attractive when compared to the Cash Flow it generates.
British American Tobacco
British American Tobacco currently has a market capitalization of $83.86B and the company has a total number of 52,077 employees.
I have selected British American Tobacco since it can help you to raise the Weighted Average Dividend Yield [TTM] of this investment portfolio built for your retirement. Currently, the company pays its shareholders an attractive Dividend Yield [FWD] of 7.40%, which is 5.58% above its Average Dividend Yield [FWD] over the past 5 years.
British American Tobacco's high Net Income Margin [TTM] of 24.10% provides us with evidence of its strong Profitability. The company's Net Income Margin is 595.26% above the Sector Median (which is 3.47%).
In my opinion, the Tobacco Manufacturer is currently undervalued: its P/E [FWD] Ratio of 9.92 is 49.71% below the Sector Median (19.73), thus underlying this theory.
HDV - iShares Core High Dividend ETF
In my opinion, the HDV - iShares Core High Dividend ETF is an excellent core investment to make up part of this retirement portfolio.
This ETF provides you with an attractive Dividend Yield [TTM] of 3.70%, being 76.52% above the Median of all ETFs (which is 2.09%). In addition to that, it has shown a Dividend Growth Rate 3Y [CAGR] of 5.01%, which is 151.56% above the Median of all ETFs (1.99%). Through its attractive Dividend Yield, this ETF can help you to significantly raise the Weighted Average Dividend Yield [TTM] of this retirement portfolio.
Below you can find an overview of the sectors in which this ETF is invested in. The largest percentage is invested in the Energy Sector (26.44%) and then in the Health Care Sector (22.89%).
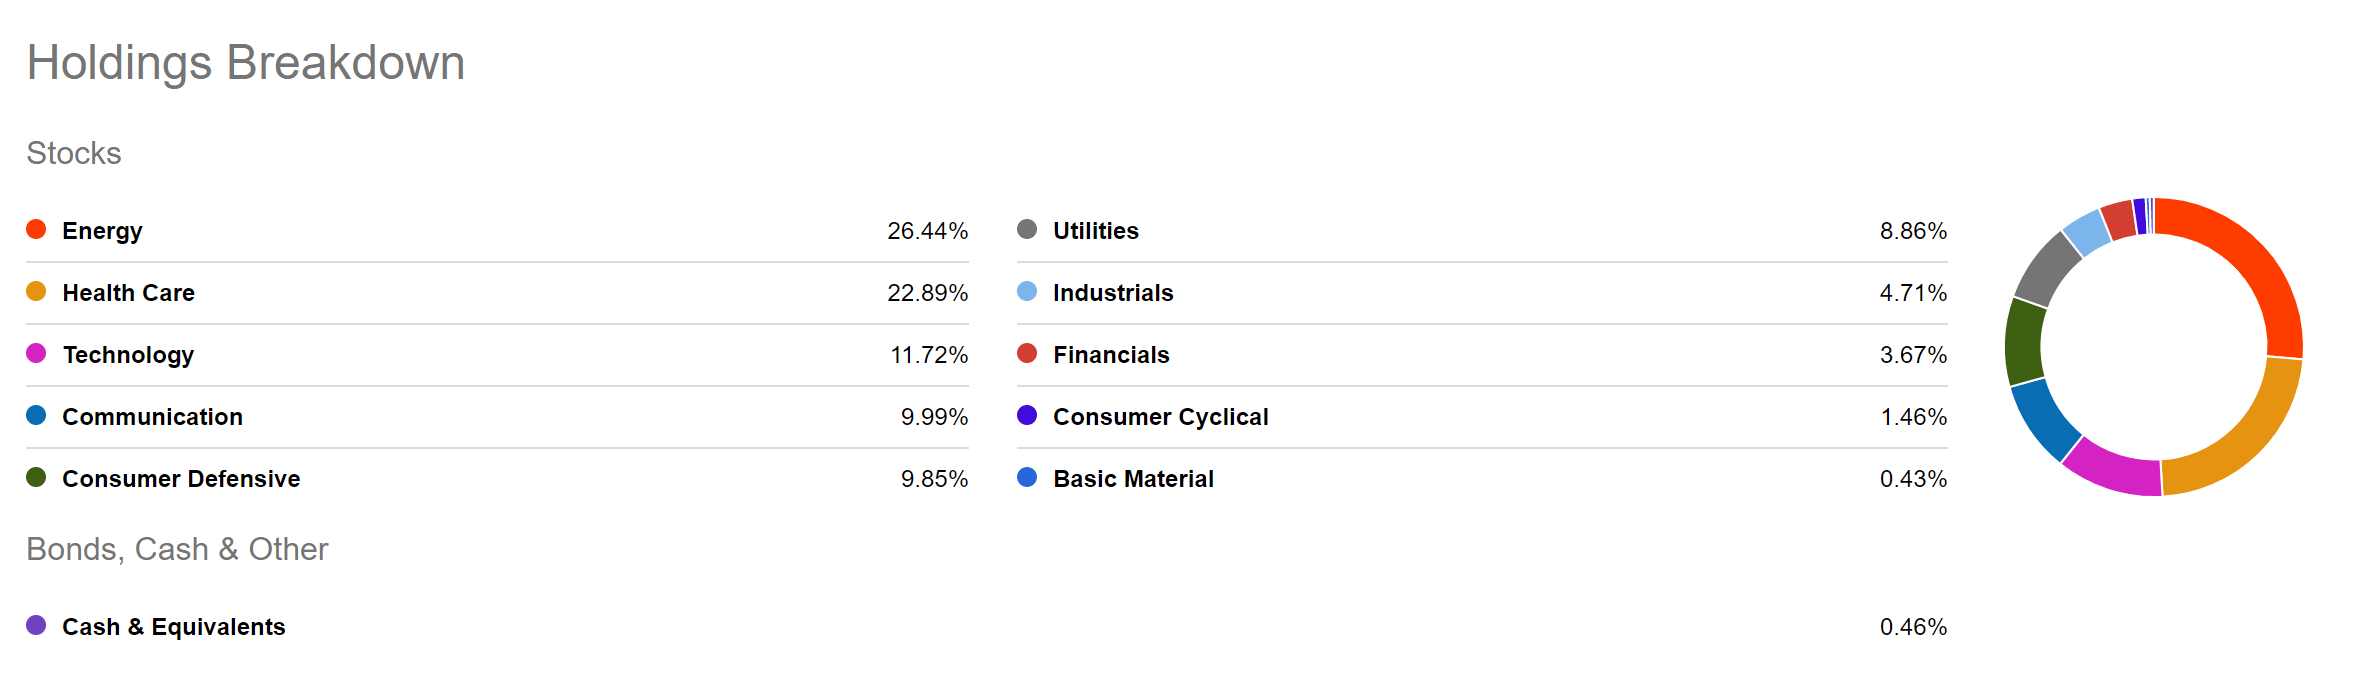
Below is a list of the Top 10 Holdings that the ETF is invested in. Exxon Mobil (9.62%) (NYSE: XOM ), Verizon (NYSE: VZ ) (6.78%), Chevron (NYSE: CVX ) (5.72%) and AbbVie (NYSE: ABBV ) (5.47%) make up the largest part of this ETF.
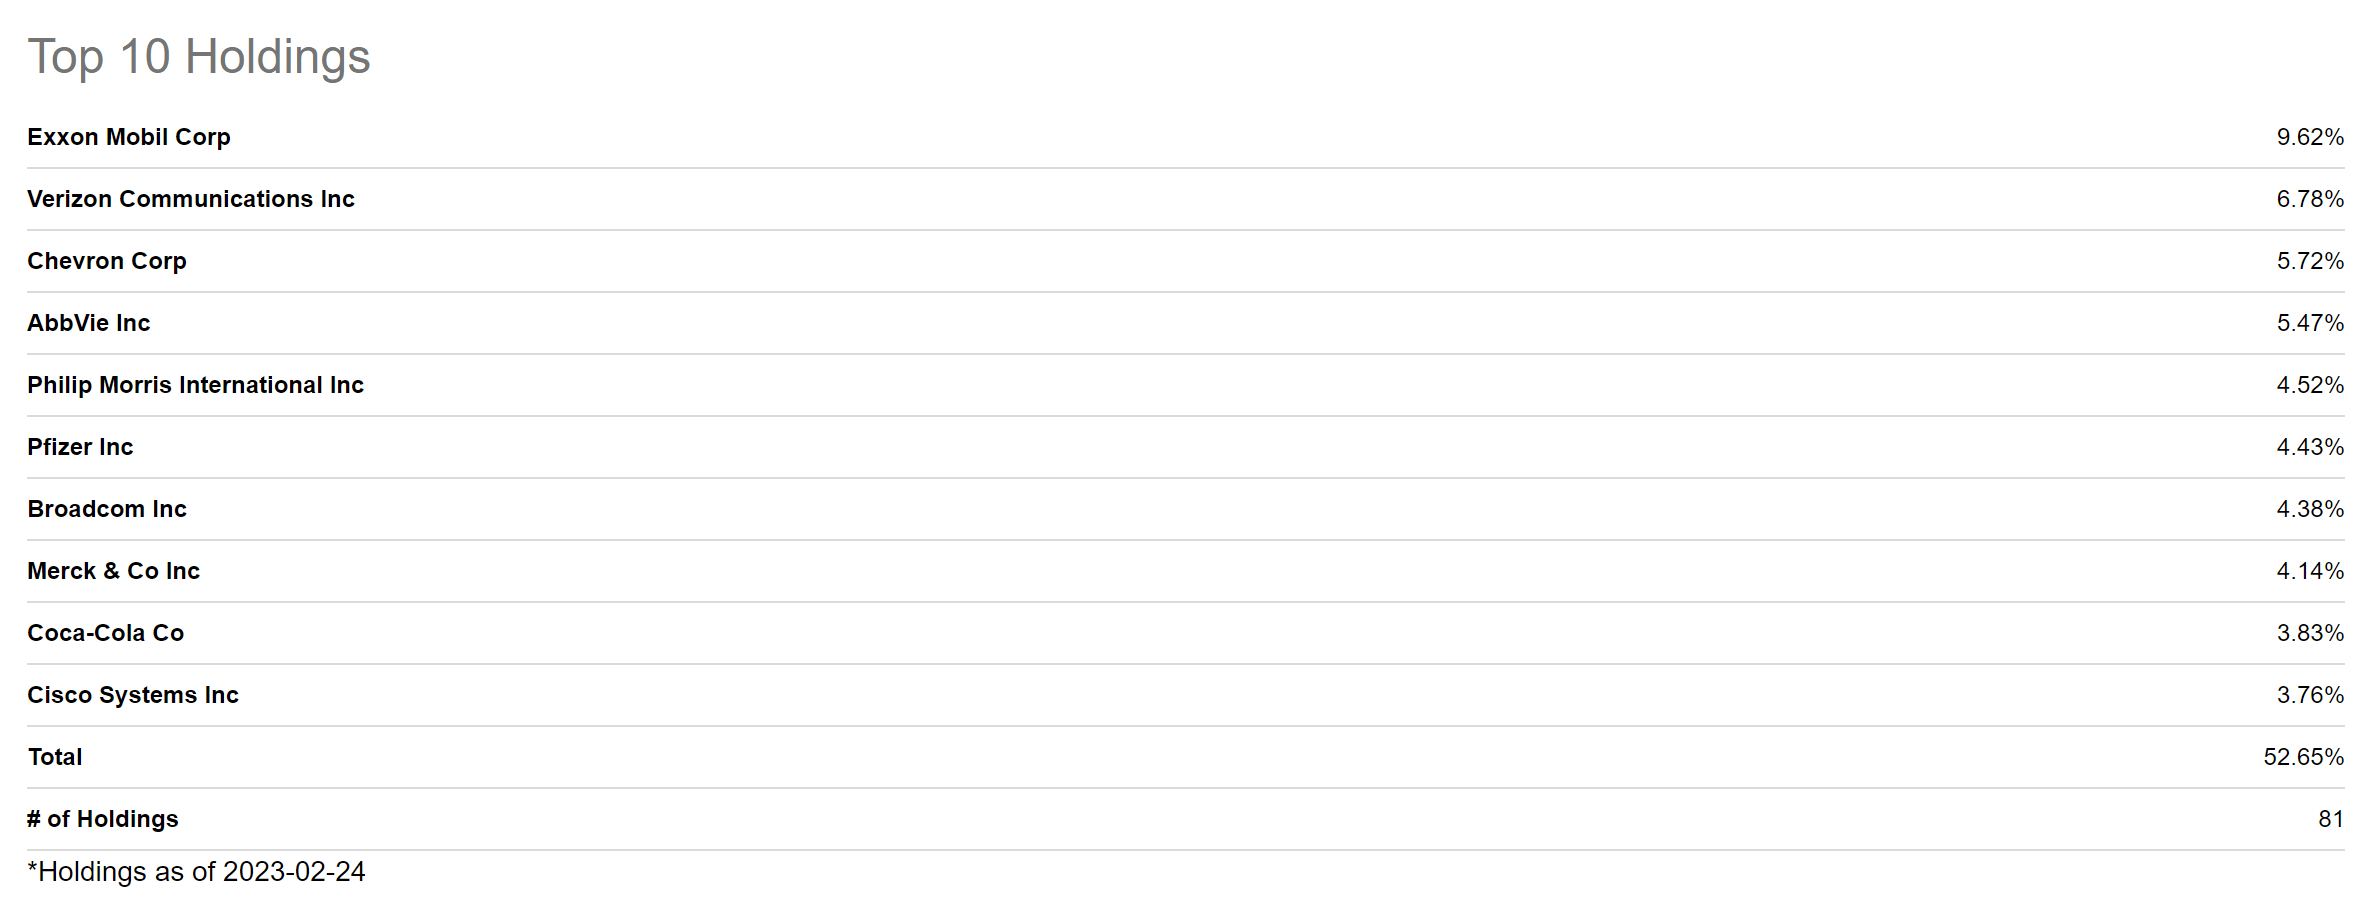
JPMorgan
JPMorgan is one of my favorite bank picks and I suggest that you make it part of your retirement portfolio. At the company's current price of $140.80, it pays a Dividend Yield [FWD] of 2.81%.
Furthermore, the U.S. bank has shown a Dividend Growth Rate 10Y [CAGR] of 16.09%, which is 102.87% above the Sector Median of 7.93%, thus strengthening my belief that you can achieve a high Yield on Cost when investing in the bank and while having a long investment-horizon.
In my opinion, JPMorgan is currently at least fairly valued: this is underlined by the fact that its P/E [FWD] Ratio of 11.13 is only 10.03% above the Sector Median (which is 10.11). At the same time, the bank's current P/E [FWD] Ratio is 10.43% below its 5 Year Average P/E [FWD] Ratio of 12.42, which reinforces my theory that JPMorgan is at least fairly valued.
The bank's Profitability is underlined by its high Return on Equity of 13.69%, which lies 22.59% above the Sector Median of 11.17%.
JPMorgan's broad and diversified product portfolio and its resistance to crisis is reflected in the Total Return the company has shown over the past 12-month period: while JPMorgan has shown a positive Total Return of 3.79%, competitors such as Bank of America (NYSE: BAC ) (Total Return of -19.88%), Wells Fargo (NYSE: WFC ) (-10.76%), Citigroup (NYSE: C ) (-11.24%) or Royal Bank of Canada (NYSE: RY ) (-5.37%), have all shown a negative performance.
McDonald's
I have selected McDonald's to be part of this retirement portfolio for several reasons, with the main one being that the company can contribute to reducing its volatility. Proof of this are its 24M Beta of 0.63 and its 60M Beta of 0.64. The company's 24M Beta Factor of 0.63 indicates that, when the broad stock market declines by 10%, the McDonald's stock would tend to decline by only 6.3%. This indicates that the company can serve as an excellent defense play in order to help you protect your investment portfolio.
The company has a high EBITDA Margin [TTM] of 52.69%, which is 364.65% above the Sector Median (11.34%). This demonstrates the excellent competitive position the company has within the Restaurants Industry while highlighting its strength when it comes to Profitability.
In terms of Valuation, I currently see McDonald's as fairly valued. This is due to its P/E [FWD] Ratio of 24.94 being 7.28% below its Average P/E Ratio over the past 5 years (which is 26.90). In addition to that, its current Dividend Yield [TTM] of 2.20 stands only -3.80% below its Average Dividend Yield [TTM] over the past 5 years (2.28). These metrics can serve as an additional indicator that the company is currently fairly valued.
Microsoft
At the time of writing, Microsoft has a market capitalization of $1.83T, which is inferior to the one of Apple (market capitalization of $2.30T), but superior to Alphabet (NASDAQ: GOOG ) ( GOOGL ) ($1.16T) and significantly higher than Oracle (NYSE: ORCL ) ($232.79B).
I consider Microsoft to be an excellent fit to be part of this long-term investment portfolio built for your retirement due to a wide variety of reasons.
The company is highly diversified, which means that revenue declines in some of its business units can be offset by others. Due to its Dividend Growth Rate 10Y [CAGR] of 11.70% in combination with its low Payout Ratio of 28.51%, I expect that the company can contribute significantly to provide your investment portfolio with Dividend Growth. This makes Microsoft an ideal pick to be part of this investment portfolio for your retirement.
Even though Microsoft's current Valuation is not particularly low, I consider the company's current Valuation to be fair: its P/E [FWD] Ratio of 26.65 is 12.53% below its Average P/E [FWD] Ratio over the past 5 years, thus confirming this thesis.
Below you can find an overview of Microsoft's excellent results in terms of Dividend Growth.
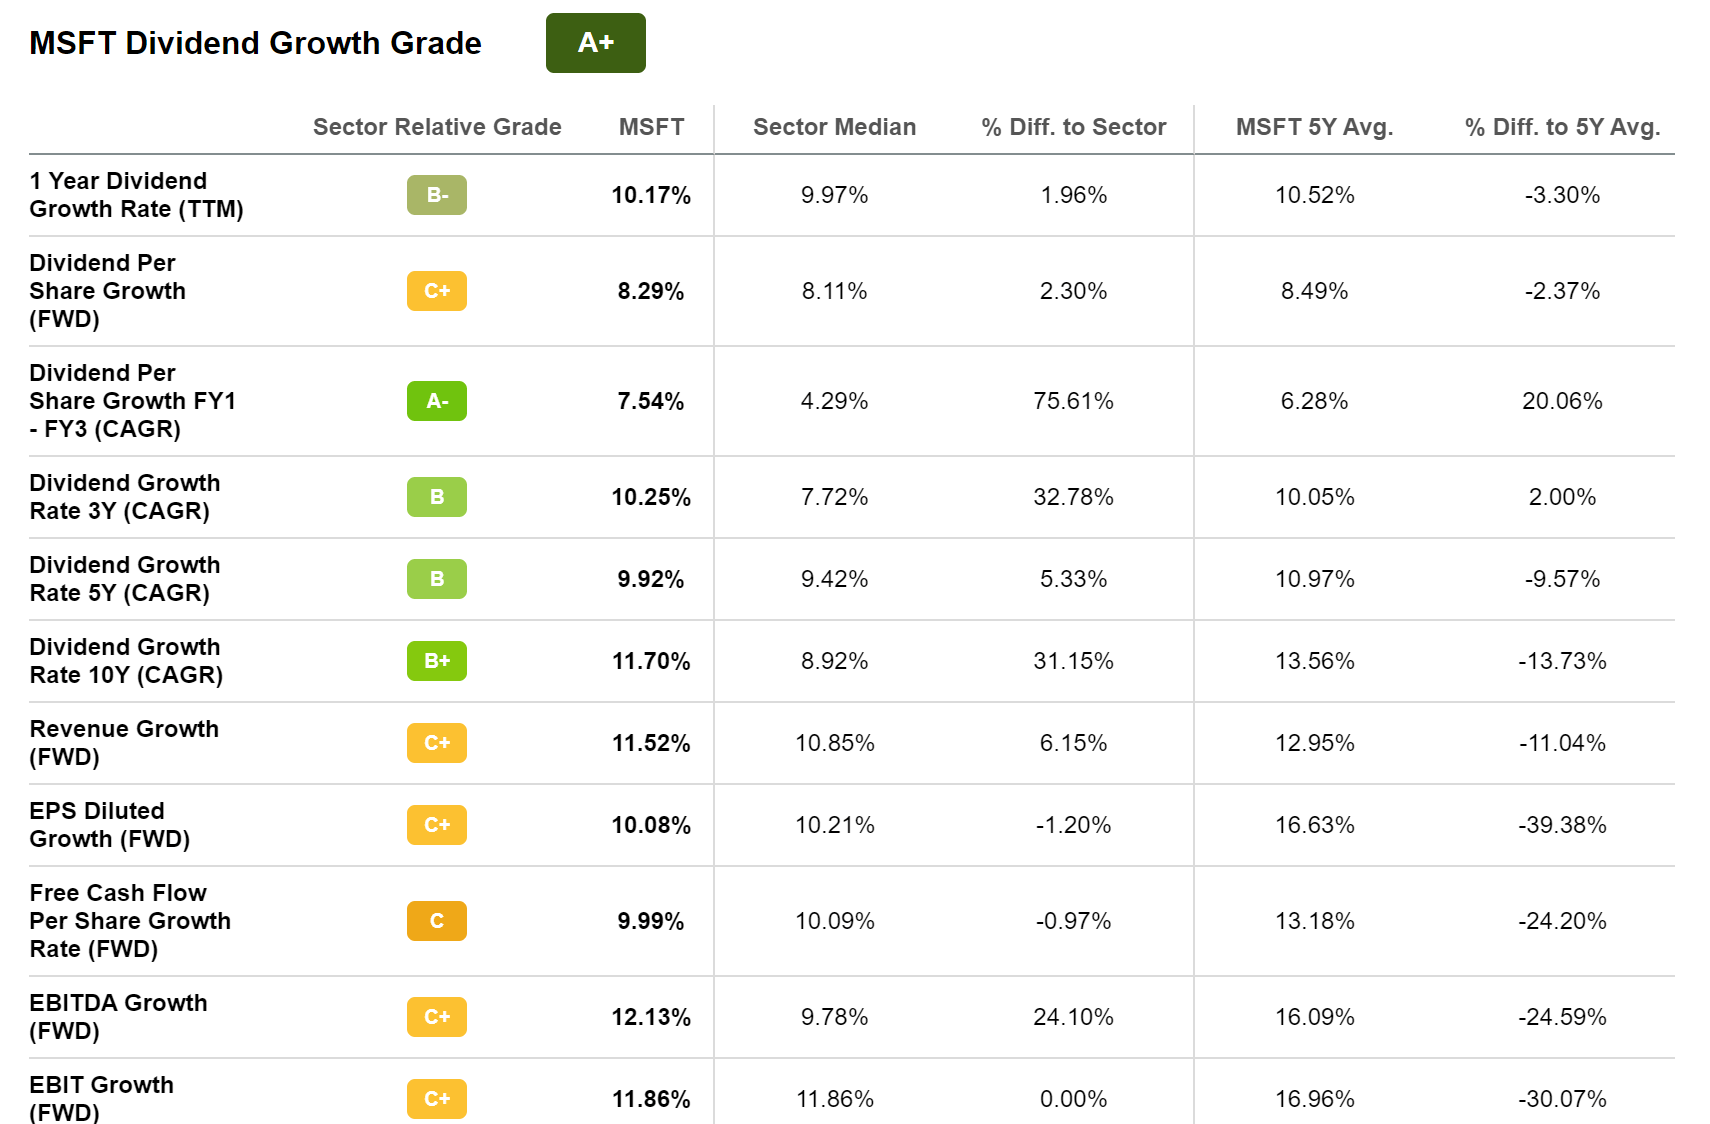
Realty Income
Realty Income's 24M Beta of 0.62 indicates that the company can contribute to decreasing the volatility of your investment portfolio. Therefore, it can serve as an additional defense play.
Realty Income has a market capitalization of $42.07B, which is slightly below the market capitalization of Simon Property Group (NYSE: SPG ) (market capitalization of $45.38B), but above the one of Kimco Realty (NYSE: KIM ) ($12.69B), Regency Centers (NASDAQ: REG ) ($10.77B) or Federal Realty Investment Trust (NYSE: FRT ) ($8.67B).
The company provides investors with a Dividend Yield [FWD] of 4.81% and has shown a Dividend Growth 3 Yr [CAGR] of 4.05%. This indicates that it can help you generate a significant amount of extra income in the form of dividend while increasing this extra income from year to year. For this reason, Realty Income is an appealing fit for this investment portfolio that is built for your retirement.
The Seeking Alpha Factor Grades also underline that the company is an appealing pick to be part of this portfolio. It is rated with an A in terms of Growth, Profitability and Revisions. For Momentum, the company is rated with a B+ and for Valuation, it receives a C rating.
Source: Seeking Alpha
SCHD - Schwab Strategic Trust - Schwab U.S. Dividend Equity ETF
SCHD is an excellent pick for this retirement portfolio that I have built for you. This is because it provides investors with a balanced combination of Dividend Income and Dividend Growth: the ETF currently shows a Dividend Yield [TTM] of 3.44% and, furthermore, it has shown a Dividend Growth Rate 3 Yr [CAGR] of 14.10%. This contributes to raising both the Weighted Average Dividend Yield [TTM] and the Dividend Growth Rate of this investment portfolio built for your retirement.
When taking a closer look at the performance of this ETF over the past 5 years, we can see that it has outperformed several other ETFs: while SCHD has shown a Total Return of 72.88% over the past 5 years, the performance of the DVY (NASDAQ: DVY ) has been 62.63% over the same period while the performance of VYM (NYSEARCA: VYM ) has been 46.66%.
The Seeking Alpha Quant Ranking underlines that SCHD is a top pick among the ETFs. It is ranked 2nd (out of 93) in its Sub Class Large Value and ranked 31st (out of 512) in its Asset Class U.S. Equity. In the overall ranking, the ETF is at position 159 (out of 2146).
Source: Seeking Alpha
Visa
The U.S. company from the Data Processing and Outsourced Services Industry currently has a market capitalization of $449.06B and has a total number of 26,500 employees.
Visa's market capitalization is slightly higher than the one of competitor Mastercard (NYSE: MA ) (which has a market capitalization of $336.97B) and significantly above other competitors such as American Express (NYSE: AXP ) ($130.91B), PayPal (NASDAQ: PYPL ) ($83.52B) or Block (NYSE: SQ ) ($46.13B).
Compared to these competitors, Visa also has the highest EBIT Margin [TTM]: while Visa's EBIT Margin [TTM] is 67.14%, Mastercard's is 56.77%, PayPal's is 14.68% and Block's is -3.30%. These numbers are a strong indicator of Visa's excellent competitive position within the Data Processing and Outsourced Services Industry and they furthermore underline the company's enormous Profitability.
Let's now take a look at Visa's current Valuation: I currently consider the company to be undervalued. This is because its P/E [FWD] Ratio of 26.67 is 17.57% below its Average P/E [FWD] Ratio over the past 5 years.
Visa is part of this investment portfolio as it should be able to significantly contribute to raising the Average Dividend Growth Rate: Visa's Dividend Growth Rate 3Y [CAGR] is 14.47% and its EBIT Growth Rate (YoY) of 19.71% serves as a further indicator that the company is on track when it comes to Growth.
Conclusion
The aim of this article was to show you how you can build a long-term investment portfolio for your retirement while investing in 10 positions. In my opinion, each of the picks that I have selected and presented in this article are an excellent choice when it comes to risk and reward.
2 of the 10 picks are ETFs and 8 are dividend income or dividend growth companies. This retirement portfolio I have built for you reaches a Weighted Average Dividend Yield [TTM] of 3.25% and the selected picks have shown a Weighted Average Dividend Growth Rate of 9.30% over the past 5 years. Combining an attractive Dividend Yield with an attractive Dividend Growth Rate helps you to generate a significant amount of extra income that you can raise year over year for your retirement.
Investing on a long-term basis and focusing on dividend income and dividend growth, instead of looking for quick capital gains while speculating over the short term, allows you to have more control about your investments and helps you to build a much more secure income during your journey to retirement.
Author's Note: I would love to hear your feedback on this article and to know if you own any of the selected picks I have mentioned!
For further details see:
How To Allocate $25,000 Among 10 Dividend Income And Dividend Growth Companies And ETFs