UNH - How To Invest $100000 Today: 5 Strategies Including The Near-Perfect Portfolio Strategy
2023-08-12 09:00:00 ET
Summary
- Markets are at a critical juncture, with uncertainty about the sustainability of the recent bull market rally.
- It is important to invest with a definite strategy and know your risk tolerance.
- The article presents five different investment strategies, including a growth-focused strategy, high-income strategy, sleep well at night strategy, fixed income strategy, and the Near-Perfect Portfolio, or NPP, strategy.
- Our NPP Strategy specifically revolves around low drawdowns, capital preservation, sustainable income, and reasonable growth over the long term.
Markets are at a critical juncture. We have had an incredible run in the last couple of months. However, now the question is if this is sustainable. Will the bull markets continue, or was it just a bear market rally?
The Fed's pivot is still elusive as they increased the interest rates by another 25 basis points last month. Most experts now talk of a soft landing, and consensus is emerging of a mild recession if there is one. If you have fresh capital to invest, it seems daunting to decide if it is a good time to invest.
However, we believe it is always appropriate to invest with a definite strategy. Staying in cash for an extended period of time does not pay in the long run. Cash loses its value every day of the year due to inflation.
In this article, we will discuss five different strategies for a wide audience with different goals. We also include our flagship Near-Perfect Strategy to demonstrate how this can help us overcome some of the conundrums that we face in today's market environment. Whether you are a 30-year-old or well into your 70s, you can find one of the five strategies presented below that would meet your specific goals and personal situation.
Know Your Risk Tolerance:
We urge readers to know their personal tolerance of risk, or in other words, know their tolerance of drawdowns. Most readers know what we mean by Risk Tolerance. However, for the sake of an example, we will consider a hypothetical scenario. Let's assume we have two investors, Steve and Mark, aged 60 and 45 years, respectively. In the year 2020, prior to the pandemic, both were fully invested in the stock market and had reasonable levels of diversification but were limited to stocks with a bit of an overdose of high-growth tech stocks.
At the start of the pandemic and during March and April, the stock market lost nearly 35% from top to bottom, but many individual stocks lost even more, some 50 to 60%. Since Steve was much closer to retirement and had fully invested in stocks, he could no longer tolerate a drawdown of 45% in his portfolios and, in a moment of panic, sold everything to get into cash. The thinking was that he would buy back once the market hit rock bottom. On the other hand, being much younger, Mark was calm and confident that panic was temporary and, eventually, the markets would come back even. He was also comforted by the fact that he had more than 20 years of working life ahead, and it would be plenty of time to recover and prosper. So, Mark stayed invested.
Due to the floodgates of stimulus and actions of the Fed, markets started recovering rather quickly. Like most people, Steve thought at the time that it was a false recovery and that markets would revert. In short, he could not get back in until much later at much higher prices than where he had sold. The moral of the story is that it is very difficult to be right twice.
So, it is very important that you know your tolerance for drawdowns based on your personal situation and be invested accordingly. We are not advocating for staying in cash or not fully invested, but there are strategies that protect you from the extreme downside during panics and corrections and help you stay calm and invested. One such strategy is our NPP strategy, discussed later.
Strategy 1: Growth-Focused Strategy
Strategy 2: High-Income Strategy
Strategy 3: Sleep Well At Night Strategy
Strategy 4: Fixed Income Strategy
Strategy 5: The NPP (Near-Perfect Portfolio) Strategy
Strategy 1: Growth-Focused Strategy
If you are in your 30s, the first thing that you need to recognize is that this is the most important stage in your working career that you should utilize to invest and secure your future. The money invested now will go a long way, and nearly 30 years of compounding can do wonders to this capital.
Second, at this stage, allocating at least 50% of your capital to growth-oriented strategies or stocks is better. The rest 50% should be invested into stable, relatively large blue-chip companies, preferably paying dividends. Even if you are in your 40s, this strategy could be well suited for your needs. The money invested in growth strategies or high-growth stocks will generally have high volatility, and the ride will be a bit bumpy. But that is relatively easy to ignore at a younger age as long as you are committed to the strategy.
For a Dividend-paying blue-chip stock portfolio, please see our sample portfolio included in the NPP strategy later in this article.
By Growth-oriented stocks, we do not mean to invest in speculative stocks.
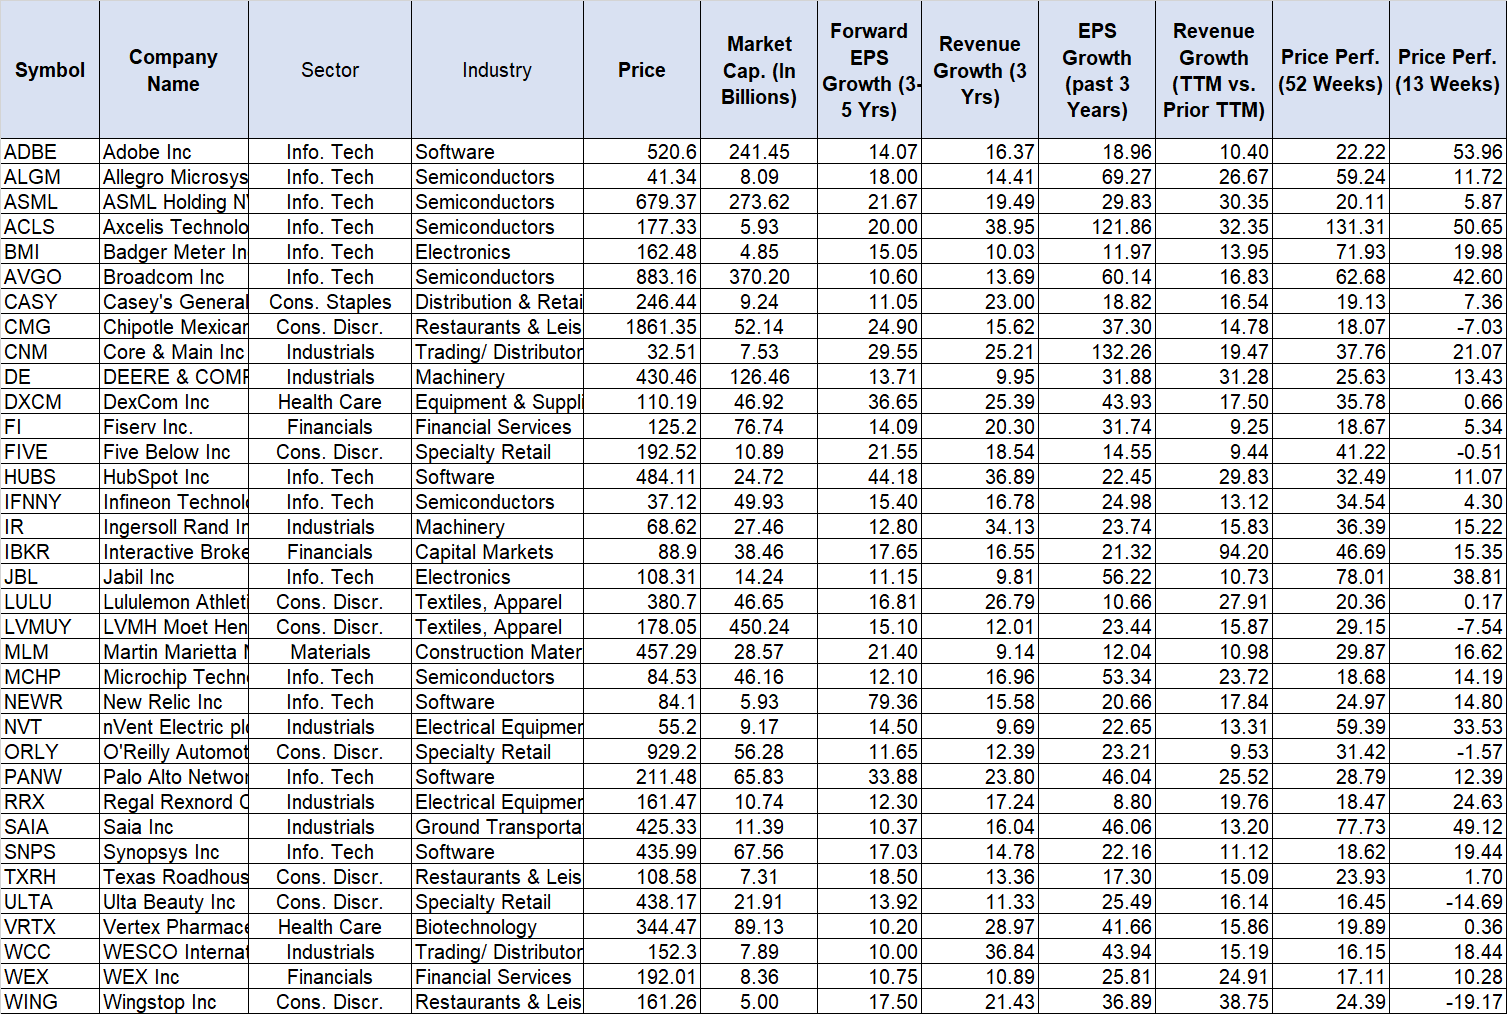
One of the methods is to use a filtering/screening process periodically (maybe once a year) and select the top 10 stocks for the next year or so. We will describe one such method below. Usually, many Software, IT, and Semiconductor stocks will tend to crowd this kind of list; however, we should be careful to select stocks from many sectors of the economy. Also, at least 75% to 80% of the stocks we select should be of large or mid-cap companies, as small and micro-cap stocks tend to have much higher risk profiles.
Screening process :
We will select 15 companies that meet several high-growth criteria.
- Market-capitalization
- Forward EPS (3-5 years) Growth Estimates > 10%
- EPS Growth (3-year history) > 7%
- Revenue Growth (last three years) > 9%
- Revenue growth current year vs. the previous year > 9%.
- Price-performance (52 weeks) > 15% (This condition is waived for microcaps).
- Price performance (13 weeks). We will use the price performance of the recent past. However, this is just for visual comparison (no minimum is set).
If we apply the above criteria today, we get a list of 35 companies. They are presented below alphabetically.
Table for Large and Mid caps: (Data as of 08/08/2023)
Table 1:
Strategy 2: High-Income Strategy
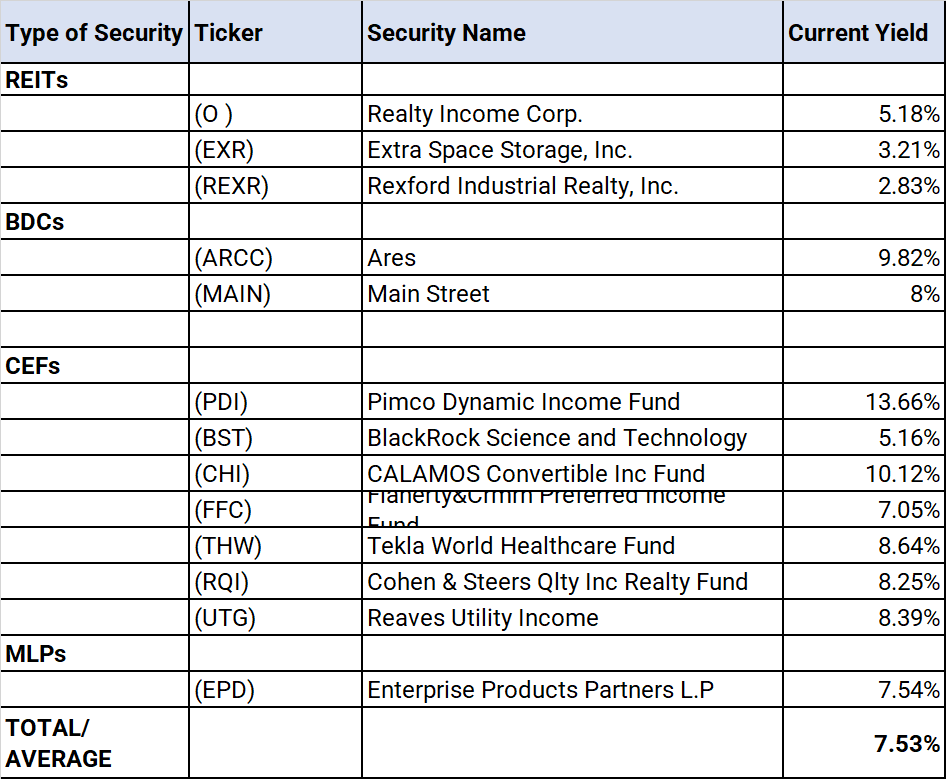
If you are retired and/or in any other situation where you need to withdraw income from your portfolio to fund your living expenses, this strategy might be for you. Please keep in mind that when you try to generate and withdraw high income (for example, 8% or higher), your portfolio may not grow much or at all. The reason is that you are not investing this income back into the portfolio, so compounding does not happen. We usually recommend withdrawing no more than 6% of income from a high-income portfolio and investing 2% back into the portfolio. By investing 2% back into the portfolio, it has a chance to grow and provide a total return of 10%. However, even if you withdraw 8% and do not invest anything back, it still is better than an annuity in many respects.
Table 2: High-Income Portfolio:
Note: EPD is a partnership (not a corporation) and provides the K-1 tax form instead of the usual 1099-DIV for tax purposes.
Strategy 3: Sleep Well At Night Strategy
Here, we want to cover a strategy where you invest and forget it for the most part. We would still recommend analyzing your portfolio on a yearly basis and seeing if it is meeting all your goals or if anything has changed that no longer meets your goals.
Another way to construct a SWAN (Sleep Well At Night) type portfolio is to invest in the Near-Perfect Portfolio strategy covered later in the article. However, that may not suit everyone as it requires some ongoing work on one part of the portfolio.
Below, we outline a simple portfolio consisting of only four components, each with an allocation of 25%. This portfolio may not beat the S&P500 at all times but will grow consistently with lower drawdowns and half the stress. Further, it is highly diversified, with 75% stocks and 25% bonds allocation, and requires no active management.
Two of the four components are highly popular dividend ETFs (Exchange Traded Funds). These two ETFs will have some overlap but are still at an acceptable level. These ETFs are low-cost and have very favorable performance records and decent yields above 3%. The third component is Berkshire Hathaway stock which is largely a proxy for the US economy; however, it provides no dividends. The long-term record of BRK is outstanding, and it seems we can't go wrong with it. At the same time, there is a little uncertainty about how the company would fare post its founder and legendary investor, Warren Buffett.
The fourth component falls under the high-yield Bond category and is a Fidelity mutual fund. Bond securities and has a decent record. For income seekers, it does provide yields of roughly 5%.
Table 3: SWAN Portfolio:
| Ticker |
| Allocation |
| Name of the Security |
| Type of Security |
| Fees |
| SCHD |
| 25% |
| Schwab U.S. Dividend Equity ETF |
| Stocks ETF |
| 0.06% |
| VYM |
| 25% |
| Vanguard High Dividend Fund ETF Shares |
| Stocks ETF |
| 0.06% |
| BRK.B |
| 25% |
| Berkshire Hathaway Inc. |
| Individual Stock (Conglomerate) |
| n/a |
| FAGIX |
| 25% |
| Fidelity Capital & Income Fund |
| Bond Mutual fund |
| 0.72% |
Strategy 4: Fixed Income Strategy
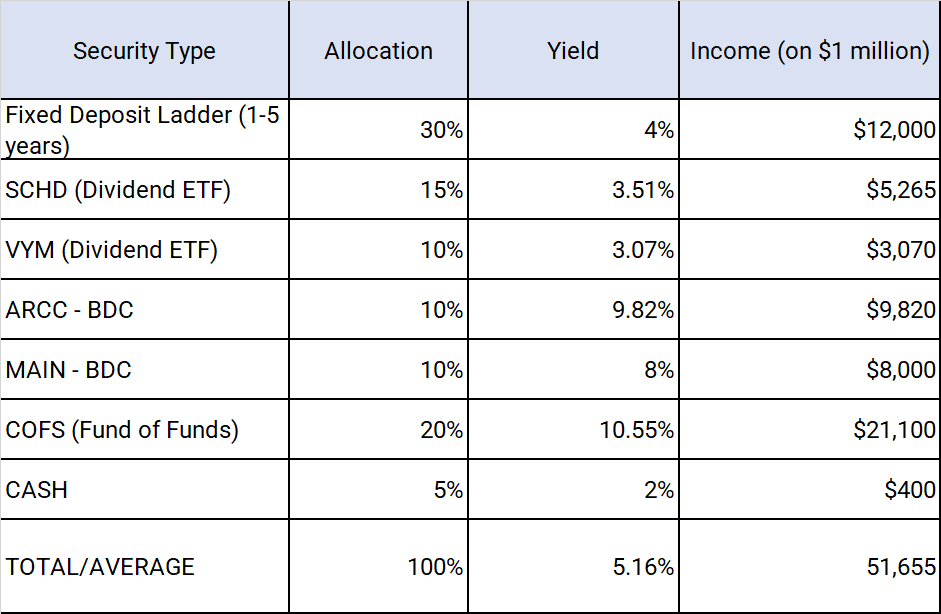
This strategy is largely passive for retired and older folks, who expect more or less fixed income from their portfolios without stress and minimal management. To make it low volatility with limited drawdowns and provide easy availability of funds at any time, we allocate nearly 35% of the funds to cash-like securities. We also allocate 25% to dividend stocks ETFs. We allocate the balance 40% to include two of the best BDCs (Business Development Companies) and a fund of funds (closed-end funds) providing a high level of income. By opting for fund of funds, we are able to have wide diversification in terms of asset classes.
Table 4:
Strategy 5: The NPP (Near-Perfect Portfolio) Strategy
We have been writing about our NPP strategies since early 2020. One of the main attributes of the NPP strategy is that it tends to provide lower volatility and limited drawdowns but still provides excellent long-term growth and decent income. In a way, the NPP strategy acts like a SWAN (Sleep Well At Night) type portfolio; however, it needs some level of management. By no means the strategy is perfect, and there will be times when it will not meet all the stated goals. But, long term, we have a lot of confidence that it will not disappoint. Sure, it needs discipline and commitment.
Note: The NPP strategy is also part of our Marketplace service, "High-Income DIY Portfolios."
So, What is the Near-Perfect Portfolio Strategy?
Our new readers would obviously ask: what is the Near-Perfect Portfolio strategy or NPP in short? The NPP strategy basically invests in three or four distinct but divergent strategies. We call them buckets (or baskets) of investments.
There are three main goals or objectives of our Near-Perfect Portfolio:
• Preserve capital during the period of uncertainties.
• Provide sustainable income of roughly 5% to those who need to withdraw.
• Grow capital at an annualized rate of 10% or better (including the income).
NPP: A Combination of The Divergent Strategies:
Most investors, especially older investors, understand the importance of diversification. In its simplest form, you hold diversified stock ETFs (exchange-traded funds), some bonds, and fixed-income securities. You could also hold individual stocks instead of stock ETFs or a mix of both. The ratio of stocks and bonds usually depends on your age and life stage. In the past, the gold standard for retirees used to be a 60:40 or 70:30 ratio for stocks and bonds. Usually, when the stocks go down, bonds would stabilize the portfolio. However, the year 2022 shattered that perfect balance between bonds and stocks. Even otherwise, you are compromising on growth by investing 40% of your portfolio in bonds. Since people are living much longer now compared to just a few decades ago, they need growth even during retirement. So, we usually recommend diversifying in varied types of asset classes and in multiple investment strategies.
The NPP strategy invests in divergent strategies and asset classes. In addition, It has an in-built hedging mechanism to lower the volatility and keep the drawdowns limited. Here are three sub-strategies that form the NPP.
- DGI (Dividend Growth Investing) sub-portfolio plays the foundational role in providing sustainable income with low volatility and decent growth.
- Risk-adjusted Rotation bucket forms an essential part of the overall strategy with an in-built hedging mechanism. It provides low drawdowns without compromising long-term growth.
- A small portfolio invested in high-income securities to boost the overall yield and income. It also helps to provide broader diversification in terms of asset classes.
NPP Strategy Performance During Bull & Bear Markets
To provide some perspective, we will now compare the performance of the NPP Strategy with the S&P 500 (SP500). We will also compare drawdowns of the recent (and not-so-recent) corrections and recessions. In the table below, we have listed the drawdowns of various buckets of the NPP strategy and the S&P 500 (based on back-tested data).
List of drawdown timeframes:
• Jan-2008 to Mar-2009 (Financial and Housing crash)
• Oct-2018 to Dec-2018 (Crash of 2018)
• Jan-2020 to Mar-2020 (Pandemic crash)
• Jan. 2022 to Sep 2022 (Most recent correction).
Table-5:
Author
** The combined NPP performance is calculated assuming a 40% allocation to DGI, 45% to Rotation, and 15% to a CEF portfolio.
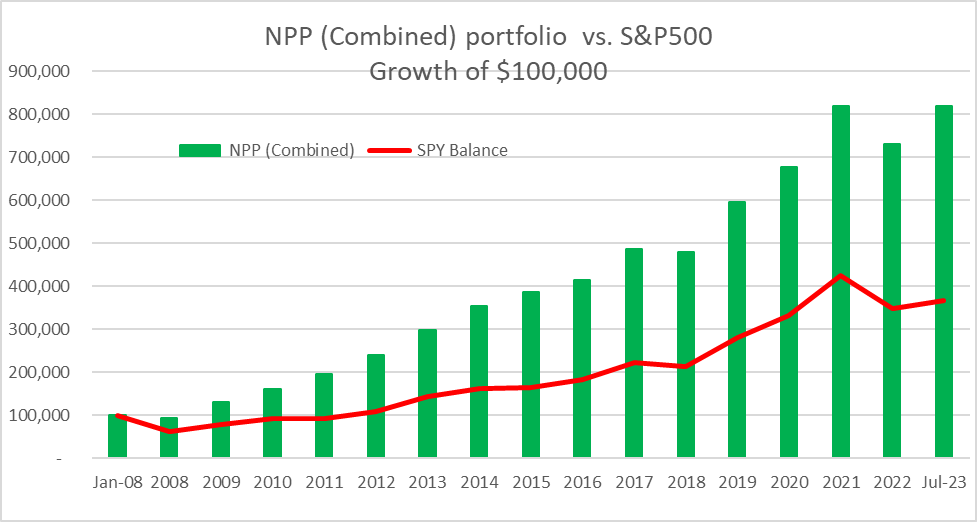
The Combined NPP Strategy Performance:
Below, we will provide the annualized growth rates ("CAGR") of various baskets of the NPP strategy. Please note these are the results based on back-tested data.
Table-5B:
| From Jan 2008 to 31 July 2023 |
| CAGR** |
| CAGR of DGI Bucket |
| 13.02% |
| CAGR of CEF-High-Income Bucket |
| 10.25% |
| CAGR of Rotation Bucket (Bull-Bear) |
| 16.63% |
| CAGR of Combined NPP Strategy |
| 14.46% |
| CAGR of the S&P500 |
| 9.64% |
** CAGR - Compound Annual Growth Rate.
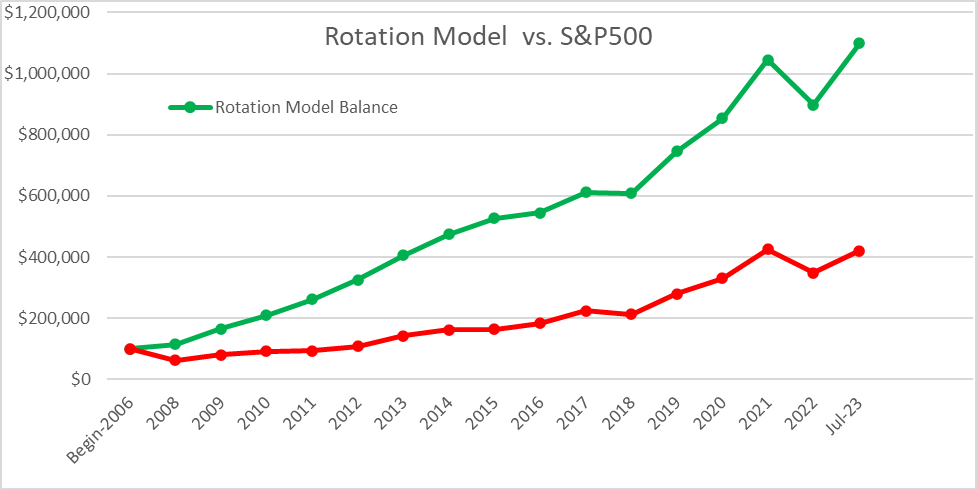
Chart-1: The Combined NPP portfolio performance vs. S&P 500.
Three Buckets of NPP
Bucket 1: DGI Bucket (Allocation – 40% - 45% of the assets)
Bucket 2: CEF High-Income Bucket (Allocation - 15% -20% of the assets).
Bucket 3: Rotational Bucket (Allocation - 35% - 45% of the asset)
Bucket-1: DGI-Core
The goals of the DGI Bucket are:
• Dividend income in the range of 3%
• Total returns in line with the broader market in the long-term
• Volatility and Drawdowns to be about two-thirds of the broader market.
Dividend ETFs Option:
If you are a highly passive investor or, for some reason, do not like to hold individual stocks, then simply invest in dividend-focused ETFs. We have discussed the dividend ETFs in other strategies discussed earlier. We list them below again but also add VIG, a dividend growth-focused ETF as well.
- Schwab U.S. Dividend Equity ETF ( SCHD ),
- Vanguard High Dividend Fund ETF ( VYM ),
- Vanguard Dividend Appreciation Fund ETF ( VIG ).
Dividend Stocks portfolio:
Constructing a DGI portfolio of individual stocks is not a complicated process. Obviously, there are many ways to do it. But since it is a long-term buy-and-hold bucket, we should invest in solid, blue-chip dividend stocks only. Also, diversification is important, so we should spread our selections to cover most sectors of the economy.
We present one simple method to select the top DGI stocks. We take the top 10 holdings from each of the dividend ETFs mentioned above, giving us a total of 30 stocks. However, since they have some overlap (the same stock appearing in multiple ETFs), we eliminate the duplicates. After removing the duplicity, we are left with 20 names.
A portfolio of these 20 stocks is presented below:
List of 20 Stocks:
AbbVie ( ABBV ), Amgen ( AMGN ), Apple (AAPL), Broadcom (AVGO), Chevron ( CVX ), Clorox ( CLX ), Coca-Cola (KO), Exxon Mobil ( XOM ), Johnson & Johnson ( JNJ ), JPMorgan Chase ( JPM ), Mastercard ( MA ), Merck ( MRK ), Microsoft Corp ( MSFT ), PepsiCo Inc ( PEP ), Pfizer ( PFE ), Procter & Gamble ( PG ), The Home Depot ( HD ), UnitedHealth Group ( UNH ), Verizon Communications ( VZ ), Visa ( V ).
Table-6:
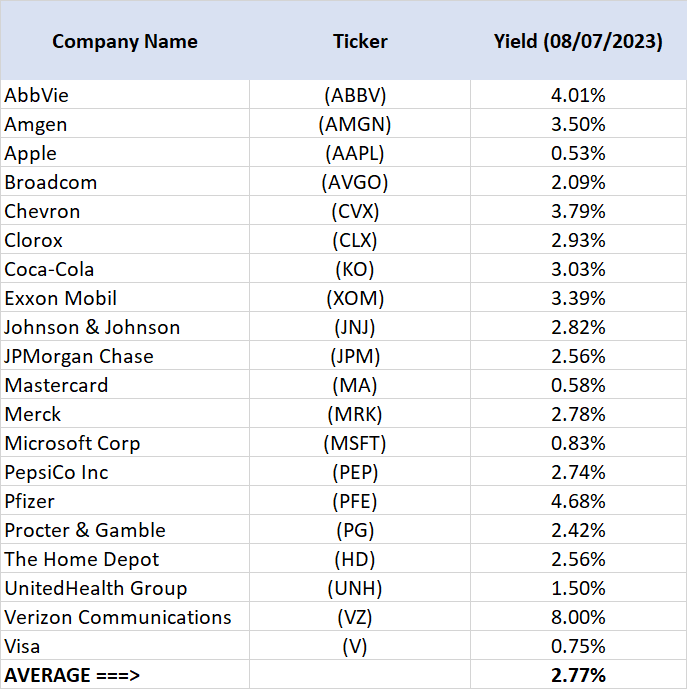
As you notice, the dividend yield is a bit low from the above portfolio. If you need a higher level of income from your DGI portfolio, we may suggest adding a few higher-paying stocks. We present another portfolio of 15 names with solid blue-chip companies but paying roughly 4% average yield (3.97% as of 08/07/2023).
AbbVie Inc. ( ABBV ), Amgen Inc ( AMGN ), The Clorox Co ( CLX ), Digital Realty ( DLR ), Enbridge Inc ( ENB ), Fastenal Co, Home Depot ( HD ), Johnson & Johnson ( JNJ ), Kimberly Clark ( KMB ), Lockheed Martin Corp ( LMT ), McDonald's Corp ( MCD ), Altria ((MO), NextEra Energy ( NEE ), Texas Instruments (TXN) and Verizon (VZ).
Bucket-2: CEF High Income Bucket
This bucket is very similar to the strategy-2 we covered earlier; however, it is part of a broader portfolio, and the allocation is only 15-25%. The purpose is to elevate the yield of the overall portfolio as well as add some new asset classes providing even more diversification.
The first goal of this small bucket is to provide an 8% or higher yield and a total return of 10% or higher (when income is re-invested). This bucket takes more risk than the DGI bucket to achieve its income goals but has a fairly small allocation.
This bucket will invest in high-income investment securities:
- CEFs (Closed-end funds),
- REITs (Real Estate Investment Trusts),
- mREITs (Mortgage REITs),
- BDCs (Business Development Companies), and
- MLPs (Master Limited Partnerships).
Please note that many of these instruments involve leverage, and leverage can lead to higher risk and volatility.
Our sample portfolio will include 11 high-income securities, mostly CEFs.
The funds/securities are: (BST), (BBN), (CHY), (EPD), (FFC),(PDI), (RQI), (THW), (USA), (UTF), (UTG).
Table-7:
Author
Note: Please note that EPD is a mid-stream partnership and provides a K1 tax form instead of 1099-DIV (for corporations).
Bucket-3: Rotational Bucket
The main purpose of this bucket is two-fold. First, to provide a hedging mechanism against deep corrections, and the second is to provide comparable growth to the broader market. Most hedging mechanisms are expensive and have an ongoing cost that must come out of your portfolio growth; however, not the Rotational portfolio.
The goals of this bucket are:
- Limited drawdowns and preserving capital
- Decent to high growth.
Note: It is important to know that the rotational strategies work best inside a tax-deferred account due to frequent trading.
Note: An important word of caution for new investors. We recommend that any new strategy (including Rotational ones) should be adopted gradually over time in smaller steps as one gains confidence in the strategy. Also, depending on the amount of capital, one could deploy should more than one such strategy to further diversify.
Rotation Strategy:
In a Rotational strategy, we would normally have multiple divergent securities in our pool, but we only invest in one or two of them for a fixed period (usually a month) based on certain criteria. So, the rotation is on a monthly basis. Our pool of securities would consist of securities with distinct attributes and will usually behave differently in different economic situations. The securities for monthly investment are selected based on a pre-determined method, usually by comparing the total performance of each of the securities during the previous period of defined length.
OPTION I: Divergent-Asset-Model
Our rotation strategy included here is pretty simple and straightforward. We will have a pool of three securities, and we will select just one of them (the top-performing one) every month for investment. Three securities in the pool are:
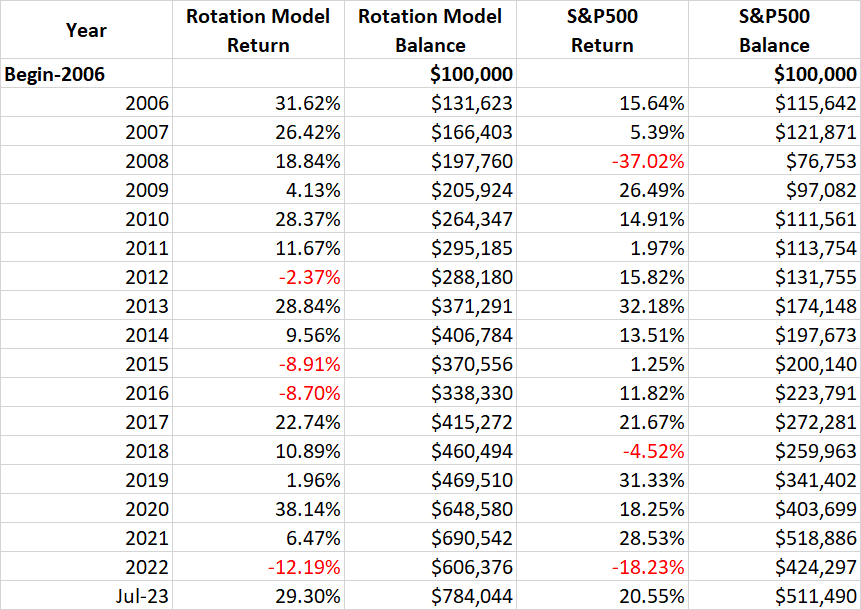
The back-tested performance and comparison with the S&P500 (from Jan 2006 to July 2023) are presented below.
Table 8A:
| (from Jan.2006 to July 2023) |
| Rotation Model |
| S&P500 |
| CAGR |
| 12.43% |
| 9.73% |
| Max Drawdown |
| -25.4% |
| -50.9% |
| Worst Year |
| -12.19% |
| -37.02% |
| Stock Market Correlation |
| 0.30 |
| 1.00 |
Table-8B:
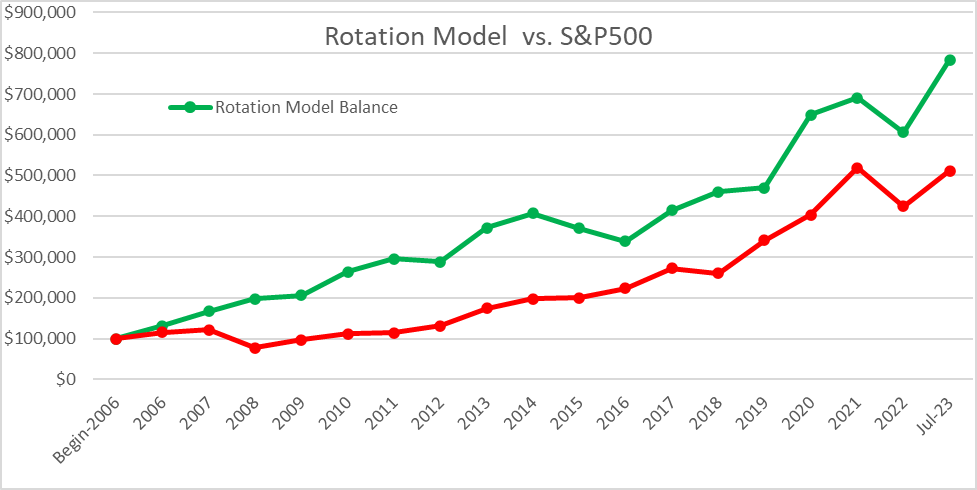
Chart-2:
You may notice in the above table that this model performs much different than the S&P500 in some of the years. Many times, it outperforms the S&P500, but other times, it underperforms, many times by a wide margin. So, the investor will obviously feel good in the year that it outperforms but not so much when it underperforms. However, the success of the model comes when the investor has the conviction in the long-term results and stays the course.
Option II. Bull-And-Bear Rotation Strategy
For our second Rotation strategy, we use a wide variety of nine securities, but we select only the top two securities to invest in for any month.
- Vanguard High Dividend Yield ETF (VYM),
- Vanguard Dividend Appreciation ETF ( VIG ),
- iShares MSCI EAFE Value ETF ( EFV ),
- iShares MSCI EAFE Growth ETF ( EFG ),
- Cohen & Steers Quality Income Realty Fund ( RQI ),
- iShares 20+ Year Treasury Bond ETF ( TLT ),
- iShares 1-3 Year Treasury Bond ETF ( SHY ),
- Invesco QQQ Trust (QQQ),
- ProShares Short 20+ Year Treasury ETF ( TBF )
The back-tested performance and comparison with the S&P500 (from Jan 2008 to July 2023) are presented below:
Table 9:
| (from Jan.2006 to July 2023) |
| Bull-Bear Rotation Model |
| S&P500 |
| CAGR |
| 16.63% |
| 9.73% |
| Max Drawdown |
| -15.66% |
| -50.9% |
| Worst Year |
| -14.07% |
| -37.02% |
| Stock Market Correlation |
| 0.54 |
| 1.00 |
Note: The Short Treasury security 'TBF' was not used for the years 2008 and 2009, as it was incepted in 2009.
Chart-3:
Concluding Thoughts
Markets are at a critical juncture. We have had an incredible run in the last couple of months. Will the bull markets continue, or has the rally begun to fizzle out? That is a million-dollar question, but no one can predict the future.
That's why it is important to have an investment approach that can handle all types of situations with relative calmness. In this article, we have presented several strategies to serve the needs of a wider audience. We have also included the NPP strategy, which is a conservative and diversified investment approach with three baskets, with a goal to provide lower volatility, lower drawdowns, and decent growth.
For further details see:
How To Invest $100,000 Today: 5 Strategies Including The Near-Perfect Portfolio Strategy