TLT - I Will Show What Recent Market Action Fundamentally Means
2023-03-11 09:00:00 ET
Summary
- Both fundamental and technical analyses reveal that the US equity markets are at a major cross-roads.
- In this article, I will show how I integrate fundamental and technical analyses to understand the past, present and potential future.
- Integration of fundamental and technical analysis significantly improves forecasting ability.
- The most important technical level in the market right now is 3764 on the S&P 500. We show what holding up above this level or breaking down below it would mean, and why.
Different fundamental analysts will interpret the same economic data differently and different technical analysts will interpret a chart with the same price data differently.
The purpose of this article is to give you an example of how we, at Successful Portfolio Strategy, integrate macro-fundamental and technical analysis to assist us in understanding: A) where the market has been and why it was there; B) where it is now, and why; C) where it my might be headed and why.
This article is essentially an exercise in exploring how the integration of fundamental and technical analysis can help to generate forecasts that are more powerful than would be the case if either form analysis was utilized in isolation.
A Brief Review of the Price Action: January 2022 - Present
In my latest article , I pointed out that US equities were at major cross-roads from a technical analysis perspective and that this was a reflection of the fact that the macro-fundamental outlook was at a major crossroads. This cross-roads in the outlook for the macroeconomy can be understood through integration of fundamental analysis of macroeconomic data with technical analysis of price data of the S&P 500.
The idea that the analysis of price action can shed light on fundamental trends and vice-versa is one that can be challenging to grasp. But it is a powerful idea that will change the way you think about markets, once you have wrapped your head around it.
If you can "read" a price chart effectively, you will be able to extract valuable information both about how markets were processing known information at a given point in time, and about the state and flow of economic expectations at that time. As we shall discuss later in this article, expectations, which are incorporated in data about price action, are both reflective of economic phenomena and are a causal factor in economic outcomes.
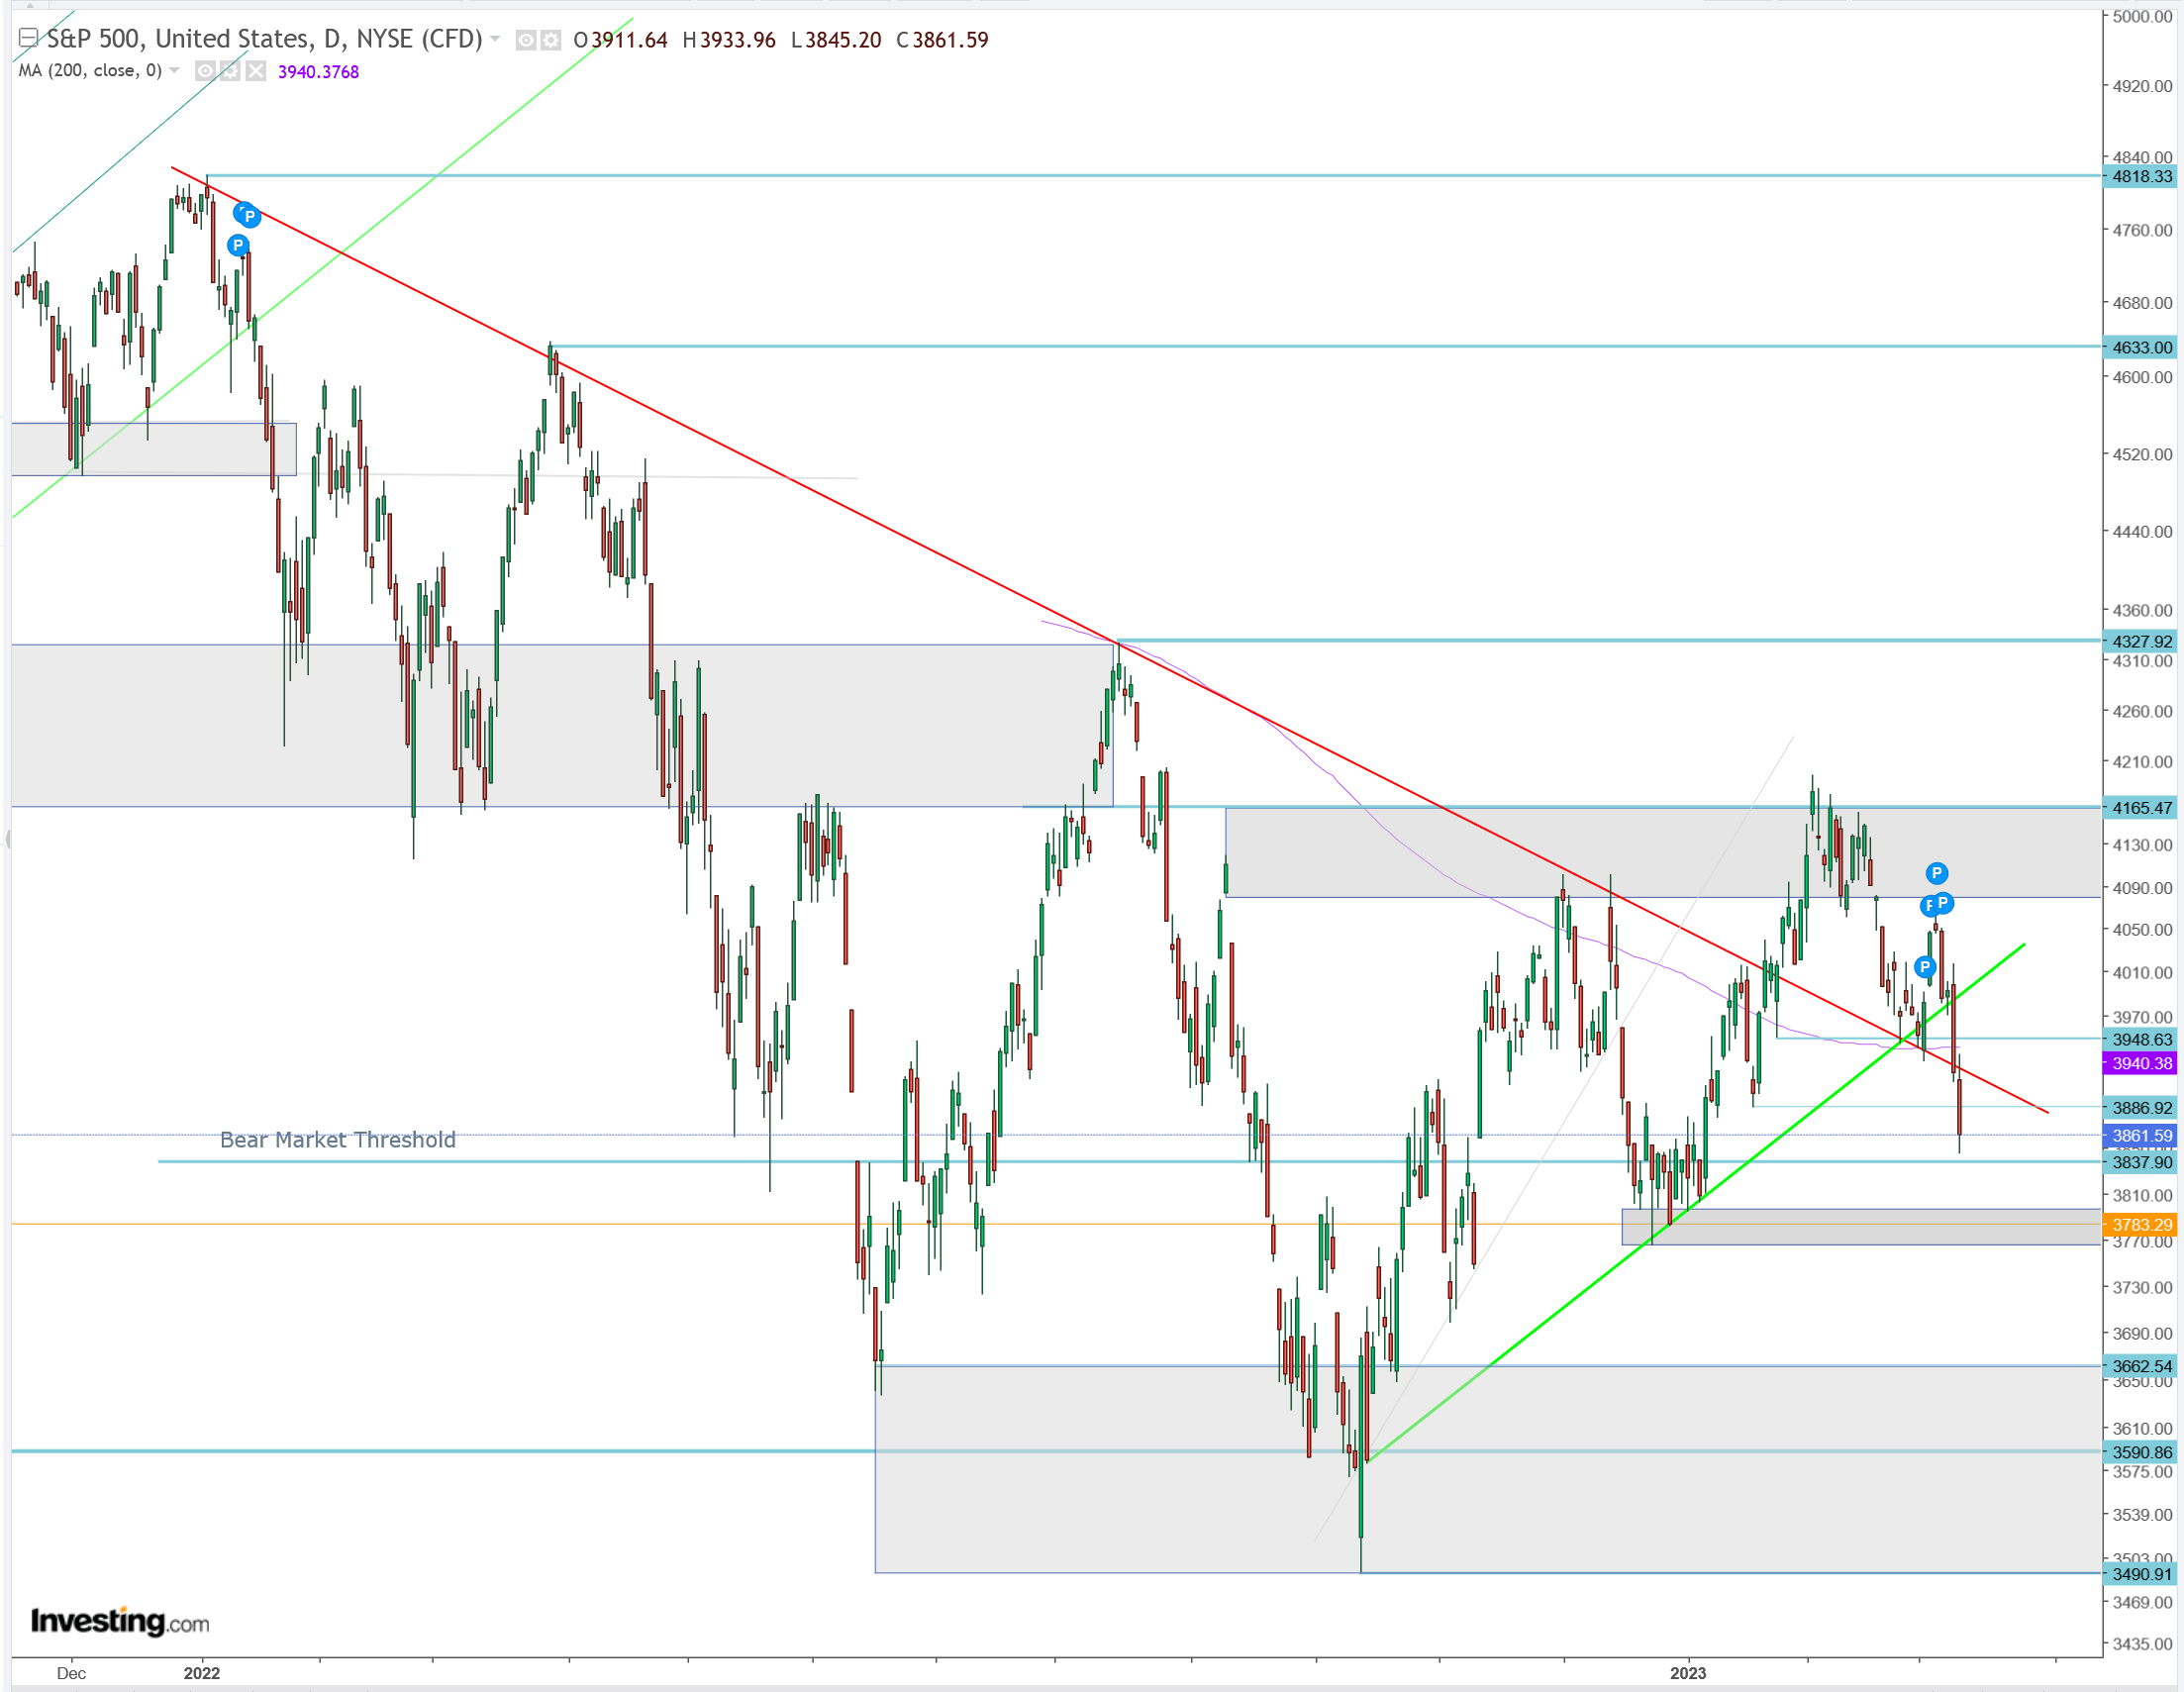
Let's look at the price action of the S&P 500 in the chart below, in detail, to see how I read and interpret the flow of macroeconomic fundamentals and the price action in an integrated fashion.
S&P 500 chart (Investor Acumen, Investing.com)
The first thing to note in this graph is the major downtrend, limited by the red trendline, that was in place from January through October of 2022. During this period of time, the "primary trend" of the market was down (i.e. bear market).
However, the second thing to note in this graph is that, from October 2022 through March 2, 2023, the price action in the SPX, delimited by the green trendline, was tracing out a clear up-trend. From a technical analysis perspective, the most important question is: Does this up-trend (green) represent the first stage in a new upwards-sloping primary trend - i.e. the first leg of a new bull market? Or is this up-trend merely a "secondary" or "corrective" trend within a primary bear market (red) that remains in place since January 2023?
Will the market confirm a new bull trend or will the older bear trend reassert itself?
Technical analysis cannot, by itself, answer this question. However, as we shall see below, integrating macro-fundamental data with careful analysis of price action will generate insights that can greatly contribute to both macroeconomic forecasts and price action forecasts.
Connecting the Price Action with the Flow of Macro-Economic Events
In order to answer the question about whether the uptrend since October 2022 is merely a secondary counter-rend rally or the initial stage of a primary bull market trend, it will be useful to understand the macro-fundamental forces that have been driving these two major opposing trends that have intersected on the chart.
From January to October 2022, the primary bear market proceeded three main stages, propelled by three main forces - all of which were clearly reflected in the price action. In the first stage of the bear market, which unfolded roughly between early January 2022 through early March of 2022, the down-trend was primarily driven by the feared macroeconomic consequences of the Ukraine-Russia conflict.
After a counter-trend rally largely driven by increasing hopes for peace, the second stage of the bear market proceeded roughly, from late March 2022 through mid-June. This stage of the bear market was primarily driven by surging (and surprising) inflation and associated concerns about potential Fed policy.
After a major counter-trend rally driven largely by optimism about an expected (or hoped-for) dovish Fed response to inflation, the third stage of the downtrend, which started in mid-August, was mainly driven a disappointment of those dovish expectations. The intensity and persistence in Fed hawkishness took many market participants by surprise. Expectations of a "pause" or "pivot" at this time were dashed, and market expectations regarding the extent and speed of Fed interest rate hikes grew significantly.
By October 2022, market participants had become very worried that excessive tightening of monetary policy by the Fed might cause a recession. Indeed, at this time, a consensus developed that there would be a recession and many feared that it could become fairly severe.
Between Mid-October and early December, the US equity market staged a major rally which was primarily driven by the fact that the economy had stayed very strong in the face of multiple shocks and showed little signs of recession. As I reported in detail in November, in my article, " The Most Widely Anticipated Recession in History ," the consensus expectation of market participants had shifted such that the current expectation was that the economy was either going to experience only a mild recession or might even pull-off an elusive a "soft landing".
A period of consolidation set in between early December and early January, based on stubbornly high inflation and a slowing economy that was having a major impact on earnings expectations. However, starting in early January, relatively strong economic data combined with easing inflation convinced many market participants (on the margin) that the probability of a soft landing was rising. Increasing optimism about a soft landing drove a strong rally from late December thru February 2.
On and around February 2, a combination of strong economic activity data combined with a hotter-than-expected CPI report (mid-month) caused market participants to assign an increasingly higher probability to a "no-landing" scenario. Market participants started to fret that a no-landing scenario would not enable inflation to decelerate sufficiently (if at all) towards the Fed's 2.0% target. As a result, fears steadily increased that the Fed would raise interest rates much "higher and longer" than expected. Indeed, the decline in the S&P 500 that started on February 3 has been primarily motivated by these fears.
Where are We Now?
According to basic principles of technical analysis, we are at a cross-roads on the chart. The upwards sloping green line has intersected with the downward sloping red line. What does this mean? How will the situation resolve?
Since February 2, 2023 market participants have been increasingly worrying about the prospect that the Fed may raise rates too high and/or for too long. On the margin, the expectations of many investors have shifted from being increasingly optimistic about a soft-landing scenario to being increasingly fearful about the prospects for a recession.
This is where the red line and the green line meet. On the one hand, the up-trend in place since October reflects increasing optimism about the possibility of a soft landing. On the other hand, the decline since February 2 is reflecting worries that hawkish Fed policy could strangle the economy and/or financial markets, provoking a resumption of the down-trend that started in January 2022.
This pull-back since February 2, 2023 was already threatening the up-trend line that has been in place since the October, 2022 lows.
And then, on March 9, 2023, the market learned of the liquidation of Silvergate Bank ( SI ) and was informed of major troubles at Silicon Valley Bank ( SIVB ). The failure of SIVB was announced on March 10. Many banks such as First Republic ( FRC ), Signature Bank ( SBNY ), Western Allliance ( WAL ) and PacWest Bancorp ( PACW ) experienced massive double-digit price declines. Regional bank indexes ( KRE ) fell sharply. As investors learned that quite a few banks had problems that were similar to that of SIVB - namely large amounts of unrealized losses on long-duration bonds held in "Hold to Maturity" accounts - speculation began to grow about the possibility of a more systemic banking crisis. These fears pushed the S&P 500 below the green uptrend line, suggesting interruption and possible reversal of the uptrend. And perhaps more importantly, it pushed the S&P 500 back below the red downtrend line, suggesting the possibility of a resumption of the bear market that began in January 2022. (Note that the 200-day average and a couple of minor horizontal supports were also broken).
Where is the US Equity Market Headed?
So, after the breakdown below these intersecting trendlines on the chart, where are we headed? Are we simply experiencing a correction within the up-trend since October 2022? Or is the market signaling that it is resuming the larger downtrend that started in January 2022?
This is where a knowledge of macro-fundamentals, integrated with a knowledge of technical analysis can be helpful.
From a technical analysis perspective, the most important element of this chart is currently the horizontal support area that encompasses the lows between late December 2022 and early January 2023. This support area goes as far down as 3764. If the S&P 500 were to break down below that area, it would be a clear TA signal that the uptrend was broken; in parallel it would be a signal that the US equity market has decisively shifted from a trend of increasing optimism about a soft landing to a trend of increasing pessimism about recession. That horizontal support area at 3764 marks the dividing line between two opposite paths. Or thought of another way, the referenced support area provides the trigger for a "signal" about what market participants are thinking and feeling about the opposing scenarios of recession versus soft landing.
The up-trend -- which has been driven by optimism about a soft landing -- gets definitively "broken" by a decline below 3764. However, as long as that support holds, the discipline of technical analysis indicates that the up-trend since October is still in place. And, in this context, this suggests that investors, on the margin, are still reasonably optimistic about the prospects a soft-landing scenario.
On the other hand, a break below 3764 would indicate that market participants, at the margin, have largely abandoned the optimism that was driving their outlooks since December, regarding the prospects of a soft landing. Every incremental decline below 3764 and towards the October 2022 low suggests that investors are increasingly discounting a high probability of a recessionary scenario.
Technical analysis cannot, by itself, tell us whether the SPX will break down below 3764 or whether recession probabilities will increase. However, it can give us an indication of what sorts of scenarios have and have not been discounted and also where expectations of the macroeconomic fundamentals might be headed. TA currently indicates that a soft-landing scenario is still the dominant expectation among market participants market, at the moment. This is because 3764 is substantially above the October 2022 highs and because the market is still technically in an up-trend as long as it stays above 3764. TA also indicates that if the SPX breaks down below 3764, then a recessionary scenario will increasingly become the dominant expectation.
Economic expectations are important because they impact the future course of events. Prices reflect expectations. Therefore, prices contain important information that will, to some extent, determine the course of events. Note that what I am saying is very different from saying that prices cause macroeconomic phenomena (although they do, to some extent). What I am saying is that prices reflect expectations, and expectations are a driver of macroeconomic events.
Keeping the above in mind, we can think of a breakdown of SPX below 3764 as a sort of "indicator" that would be telling us something important about where expectations are heading. And if we know where expectations are heading, then we have important information about a key causal factor that actually drives macroeconomic outcomes. In this case, a breakdown below 3764 and towards the October lows, suggests that economic expectations are increasingly discounting a recession. These expectations actually make a recession more likely. But here is the thing: prices at the October lows at around 3500 would not be indicative of an actual recession. They would merely be indicative of serious "worries" about recession - (such as the worries that prevailed in October 2023). Since 3500 merely indicates a moderate level of worry about a recession, an actual recession would likely send prices well below 3500.
What does fundamental analysis currently say? Right now, it hinges on the evolution of the current banking crisis. In the absence of a banking crisis, my own fundamental analysis suggests a probability of recession of less than 50%. Employment and personal consumption have remained strong, and without a significant rise in unemployment and/or a significant drop in personal consumption there will be no recession. History has shown that it would take a major shock to cause a significant increase in unemployment and/or a significant drop in consumption. However, if the economy experiences a significant shock, such as a banking crisis or another spike in oil prices above $120, the probability of recession rises well above 50%. And if the probability of recession rises well above 50%, then I have little doubt that the 3764 level on SPX will be broken.
Another way to put it is this: It is my view that unless there are additional shocks to the economy beyond that which are already discounted - i.e. a worsening of the banking crisis or a spike in oil prices - the 3764 level will probably hold.
Will 3764 hold? It is the evolution of fundamentals - not technical factors - that holds the key to whether 3764 is broken, in my view. At the same time, a break of 3764 would serve as a strong signal that expectations of recession have risen above 50%, coinciding with the flow of fundamental events.
As can be seen from the analysis above, TA can help develop a conditional forecast of future prices. Fundamentals also help to develop a conditional forecast of future prices. And by integrating both elements we can gain a significantly greater capacity to understand what conditions need to be met for certain price action scenarios to unfold. And for this reason, the integration of TA and fundamental analysis enables us to forecast outcomes far more proficiently than if we were relying on either TA or fundamentals alone.
Final Thoughts
One of the important things we do at Successful Portfolio Strategy is to integrate high quality fundamental analysis and insightful technical analysis. Our historical studies have shown that important macroeconomic turning points can be forecast effectively with fundamental data, while technical analysis can greatly assist in timing price entries and exits around those turning points. Both are needed to maximize profit. On the one hand, you need to have superior analysis of fundamentals to be able to effectively forecast macroeconomic events. On the other hand, you need a way of translating macroeconomic forecasts into concrete buy and sell decisions, and insightful technical analysis can help to greatly optimize these decisions.
A correct understanding of macroeconomic developments can help to anticipate the resolution of various price pattern scenarios that develop in the charts. From that standpoint, a good understanding of fundamentals will greatly improve the quality of technical analysis. At the same time, because market prices are partly causes of fundamental economic phenomena and because they reflect expectations about future economic developments, price analysis, including inter-market price analysis, can serve as a "secret weapon" in a complete macroeconomic forecasting system.
Technical analysis helps us understand why 3764 on the S&P 500 is a very critical point. Fundamental analysis helps us understand what sort of macroeconomic events could cause prices to fall below that level. At the same time, the technical analysis of price action at and around that 3764 level will provide us with useful information regarding the evolution of expectations that will actually help shape the macroeconomic outcomes of the future.
For further details see:
I Will Show What Recent Market Action Fundamentally Means