TLT - Industrial Production: Hinting At A Slowdown
2023-09-15 13:30:49 ET
Summary
- The Total Industrial Production Index surprised to the upside, with the manufacturing component beating expectations slightly.
- After careful analysis of the internals, we conclude that the overall report was not as strong as indicated by the headline data.
- Mining contributed to approximately half of the growth in Industrial Production for this month. Utilities also contributed disproportionately. The most economically sensitive sectors grew at historically slow rates.
On September 15, 2023, at 9:15 AM, the U.S. Federal Reserve released its monthly report on Industrial Production and Capacity Utilization. In this article, we provide in-depth analysis of the data and their implications for the US economy and for financial markets.
Summary Data and Analysis
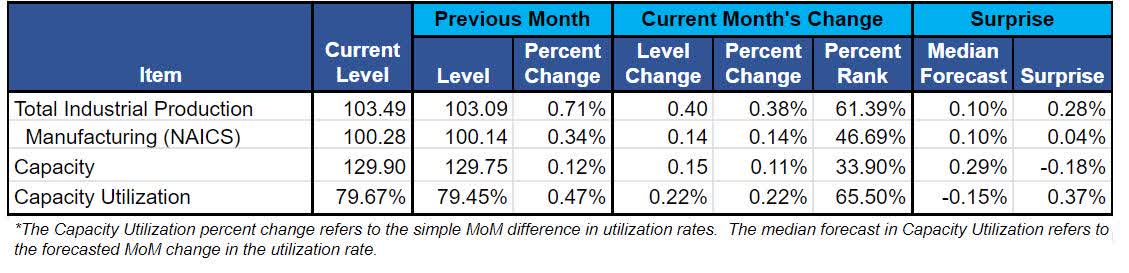
A summary of key data and analysis is provided in Figure 1.
Figure 1: Change, Acceleration, Expectations, and Surprise
Industrial Production & Capacity Utilization (Federal Reserve & Investor Acumen)
Total Industrial Production grew by 0.38% MoM, which ranks in the 61st percentile. This was an upside surprise compared to the median forecast. The rate of growth has slowed down from last month’s 0.71% (revised down from 1.0%). The manufacturing component of industrial production grew by 0.14% MoM, which slightly beat the consensus forecast of 0.10%.
Detailed breakdowns and analysis of these data follow.
Analysis of Annualized Change: Component Breakdowns
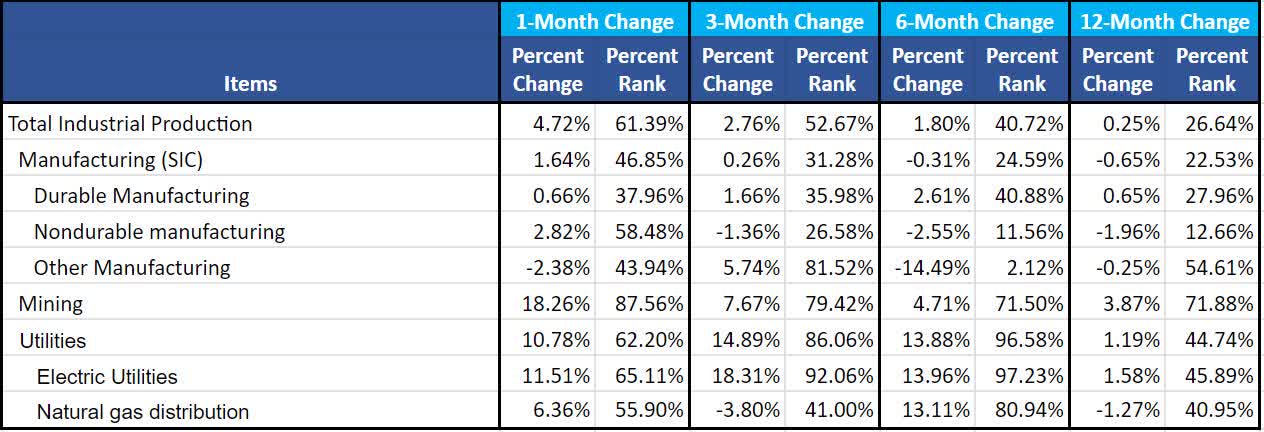
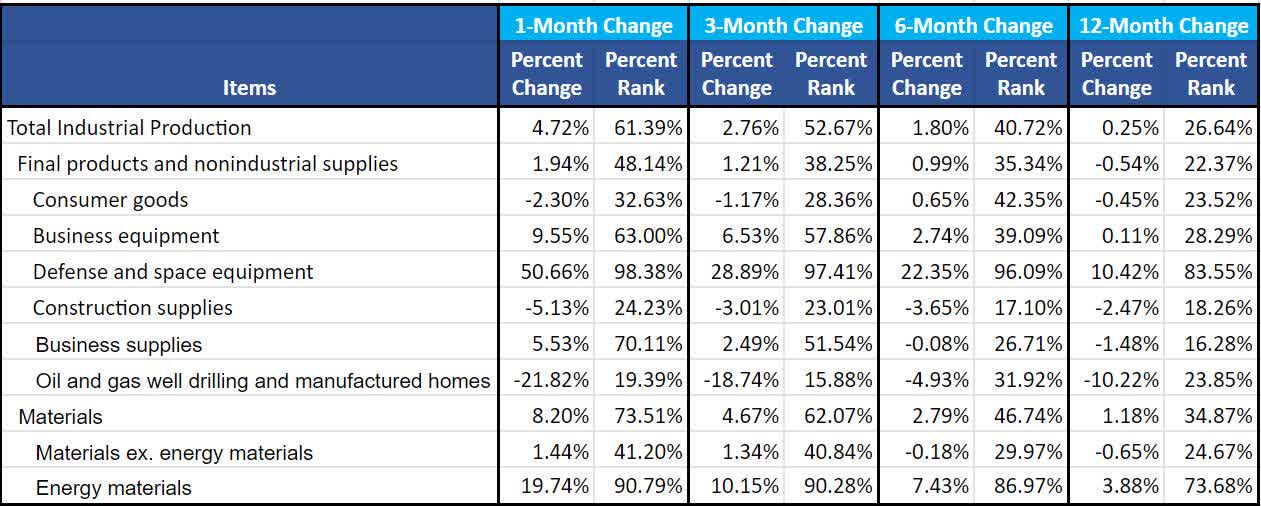
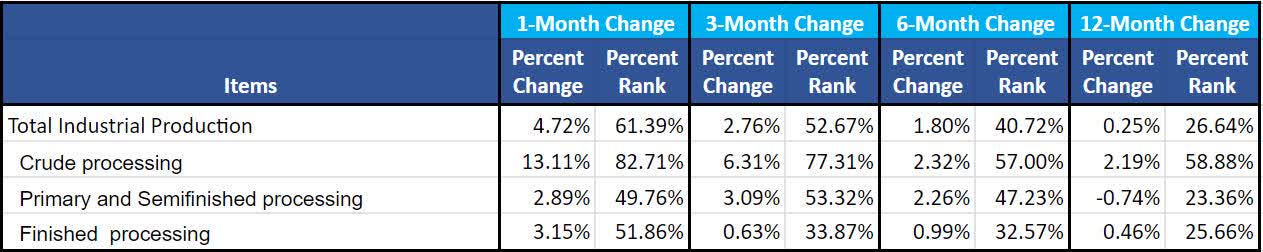
Industrial Production data can be broken down in three different ways: Industry Group, Market Group, and Stages. In this section we take these detailed breakdowns and scrutinize the annualized growth rates of key components over various time frames (1m, 3m, 6m and 12m), in order to compare growth rates of the components and the overall Industrial Production Index over these periods. In Figure 2, for each sub-component of industrial production (broken down in three different ways), we show the annualized growth rates and the respective historical percent ranks.
Figure 2: Analysis of Aggregate Components of Industrial Production
Industry Breakdown (Federal Reserve & Investor Acumen) Market Breakdown (Federal Reserve & Investor Acumen) Stage Breakdown (Federal Reserve & Investor Acumen)
One thing that we can glean from the above detailed breakdown of annualized growth rates is that many of the components that are most tied to the economic cycle have been growing in the past few months at rates that are historically well below average. Examples would be durable manufacturing and construction supplies. The implication of this is that, from a business cycle perspective, the industrial economy may not be as strong nor growing as vigorously as the headline data suggest.
Analysis of the Contribution of Change of Component Breakdowns
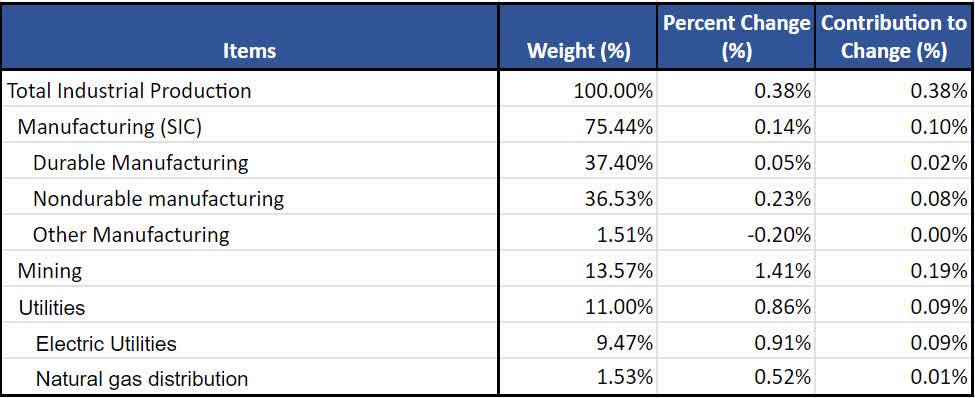
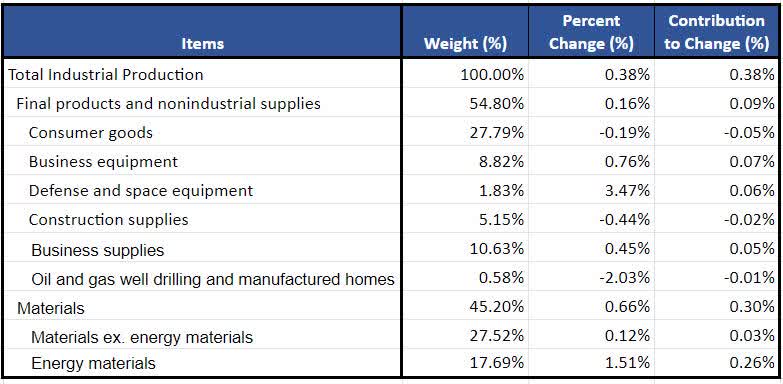
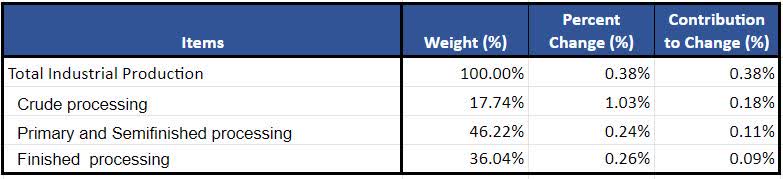
In Figure 3, we break down the analysis of the contribution of change of the IP Index into the major 3 breakdowns.
Industry Breakdown Contribution (Federal Reserve & Investor Acumen) Market Breakdown Contribution (Federal Reserve & Investor Acumen) Stage Breakdown Contribution (Federal Reserve & Investor Acumen)
Notably, the Mining sector contributed to approximately half of the growth in Industrial Production for this month. And as pointed out in the previous section, the most economically cyclical sectors made relatively weak contributions. For example, much of the "surprise" in this month's industrial production data came from Utilities (high air conditioning use to do high temperatures) and other items that don't really point to strong cyclical growth.
Implications for the Economy
Industrial production, particularly its manufacturing components, tend to be highly sensitive to the U.S. business cycle. For this reason, among coincident indicators of economic activity, industrial production data tend to provide some of the best indications regarding the current state of the U.S. business cycle.
The industrial production data this month paint of picture of an economy that has remained very resilient in the face of historically aggressive interest rate increases. However, when one looks at the data closely, as we have in this report, one can see that the most economically sensitive and cyclical components of industrial production have been weakening markedly and that growth in these components are at levels that are quite low. This could represent a leading indication of a potential economic slowdown in coming months. This slowdown signal is currently a mild one, but it should be monitored closely in coming weeks and months.
Implications for Financial Markets
The indications of a potential upcoming economic slowdown, which were alluded to above, are probably still too mild to have a significant impact on financial markets. However, in coming months, a more pronounced weakening of data in economically sensitive sectors could start to impact both the bond and stock markets. I especially suggest that investors monitor medium-term and longer term bond yields and the relative price performance of cyclical sectors of the equity markets for initial signs that investors may be concerned with the health of the U.S. business cycle. For example, if long-term bond yields fall relative to short-term yields (greater inversion of yield curve), and/or if cyclical sectors underperform defensive sectors of the equity market, this would be a sign that financial markets are starting to price in a potential slowdown in the economy.
Final Thoughts
The industrial production report, taken as a whole, was not as strong as the headline data would suggest. In addition to the downward revision of the prior month's data, the data for the current month shows weakness in the most economically sensitive sectors.
Our team is of the view that the U.S. economy cannot withstand the current level of interest rates for much longer. If interest rates and long-term yields persist at similar levels for an additional two months, we believe that significant cracks will emerge in the financial system and in the overall economy and that U.S. economic activity will slow severely from the current above-trend growth rates to significantly below-trend growth rates. Industrial production data will be some of the first economic data to reflect a major slowdown. While a major overall economic slowdown is not yet a certainty, we believe that odds of such a slowdown have become greater than 50%, and we are progressively preparing our portfolios for this eventuality.
For further details see:
Industrial Production: Hinting At A Slowdown