RTX - Is The S&P 500 Overvalued Really?
2024-01-08 14:28:56 ET
Summary
- The S&P 500's valuation is subjective and could rise instead of falling, with increasing growth opportunities and a more accessible monetary environment.
- The market is experiencing a pullback/consolidation phase after significant appreciation, but this is favorable for future gains.
- The current P/E ratio may be lowballed, and improved EPS growth could make stocks cheaper than they seem, leading to increased demand.
I often hear that the S&P 500 Index, and stocks in general, are overvalued. However, is a 21.5 P/E ratio really expensive for the world's most significant stock market index? What if this year's earnings are better than expected? What if next year's EPS growth eclipses estimates? Also, there is the inflation factor. It's not practical to compare current P/E ratios to historical valuations. Over time, stock valuations can continue increasing in the long term. This dynamic is especially true because long-term rates are in a perpetual decline.
The S&P 500's valuation is subjective, and the P/E ratio should rise instead of falling. Increasing growth opportunities like AI and other significant economic segments combined with a more accessible monetary stance and fiscal policy could enable a long-term growth runway during which earnings and stock valuations should expand, leading to much higher stock prices in many high-quality companies in future years.
It's been an exciting week to start the new year...
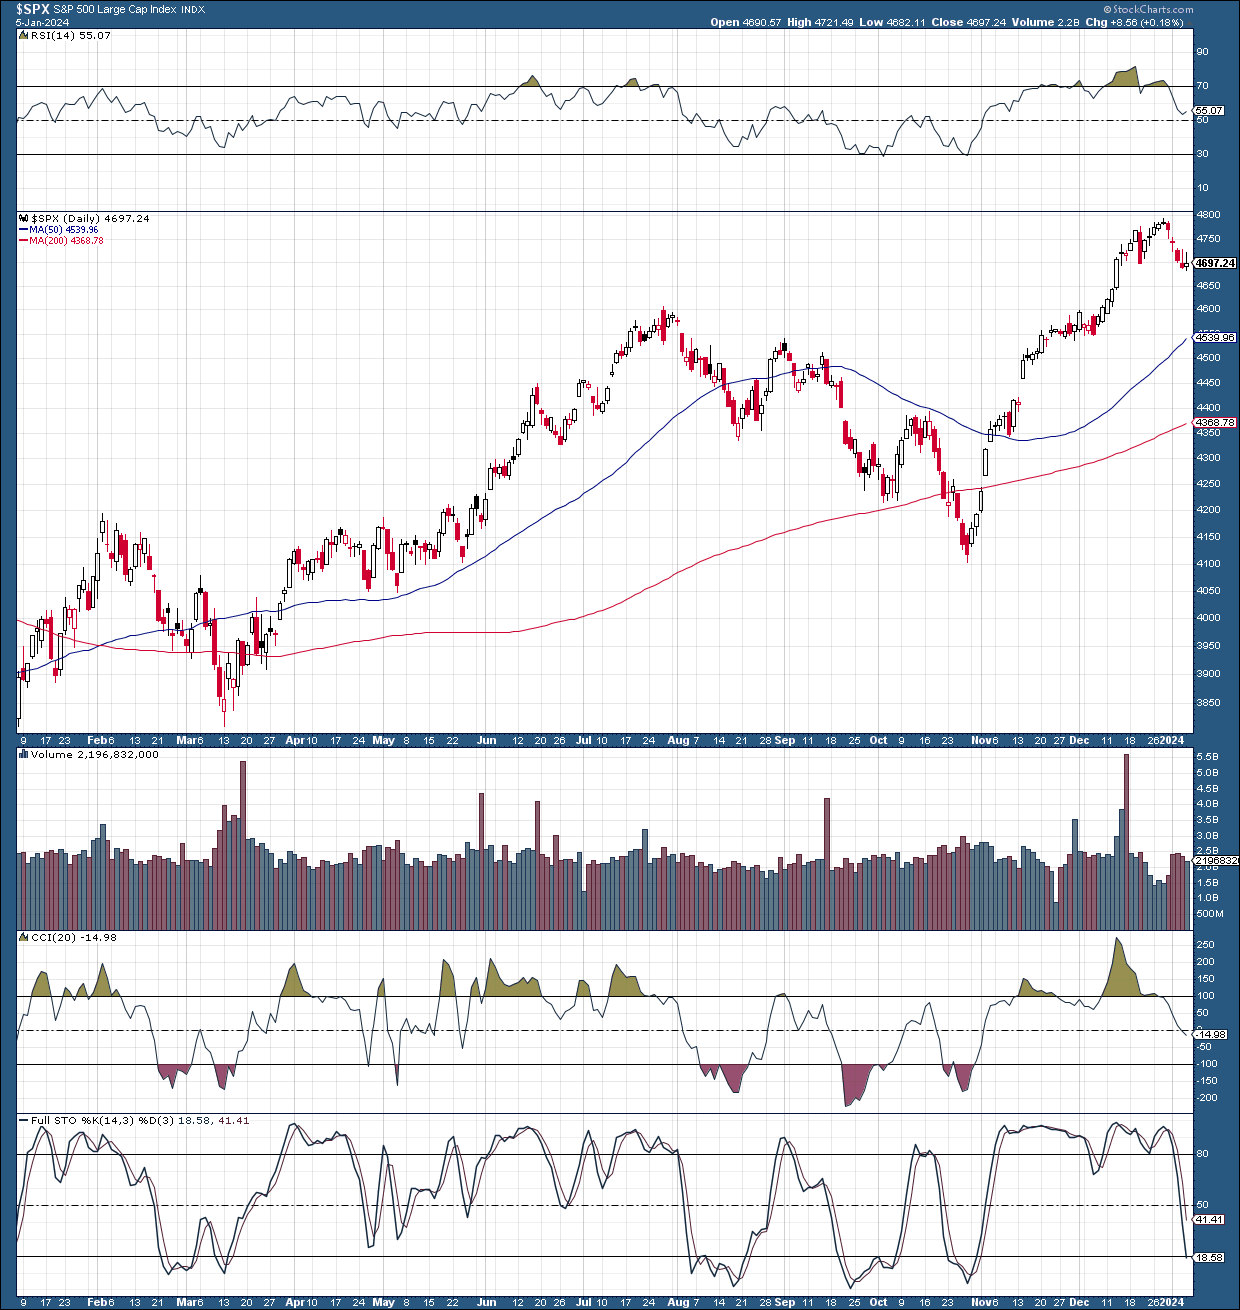
Let's face it. The S&P 500/SPX ( SP500 , SPX ), Nasdaq (COMP.IND), and stocks in general became massively overbought (on a short-term basis) going into year-end. The SPX had a considerable appreciation of 17% from the correction bottom low in late October. The Nasdaq 100 (NDX) spike was even more extreme, equating to over 20% from the correction trough to its recent peak.
If we back up to the bear market bottom levels in 2022, we will see even more substantial increases in major stock market averages. The SPX appreciated by a staggering 37% before the recent pullback started, and the Nasdaq skyrocketed by over 50%.
Taking a step back and looking at the market dynamic from the point of significant appreciation over the last year is critical. This perspective shows that a pullback/consolidation phase is inevitable and highly favorable before advancing to new ATHs in 2024.
The SPX has only pulled back by about 2% from the recent high, and we may see another several percent pullback before the consolidation period ends. The 4,700-4,600 support zone is critical, but in a worse-case scenario, we may see the 4,550-4,500 zone. This pullback should set stocks up favorably for a constructive move through earnings season and in 2024.
Fundamental Factors Are Aligning
The Economy Remains Resilient
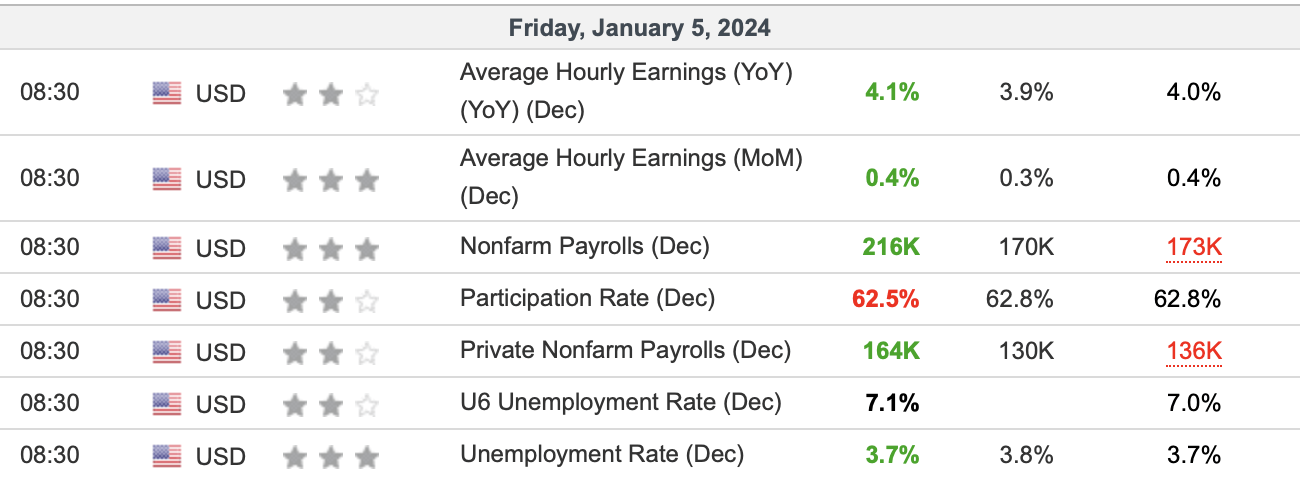
Last week's nonfarm payrolls report was better than expected. The economy added 216K jobs vs. the 170K estimate. Private nonfarm payrolls came in at 164K vs. the 130K estimate. The unemployment rate remained at 3.7% despite forecasts for an increase to 3.8%. Average hourly earnings also increased by more than anticipated, illustrating a healthy labor market despite a tight monetary stance and other challenging factors.
Core CPI This Week
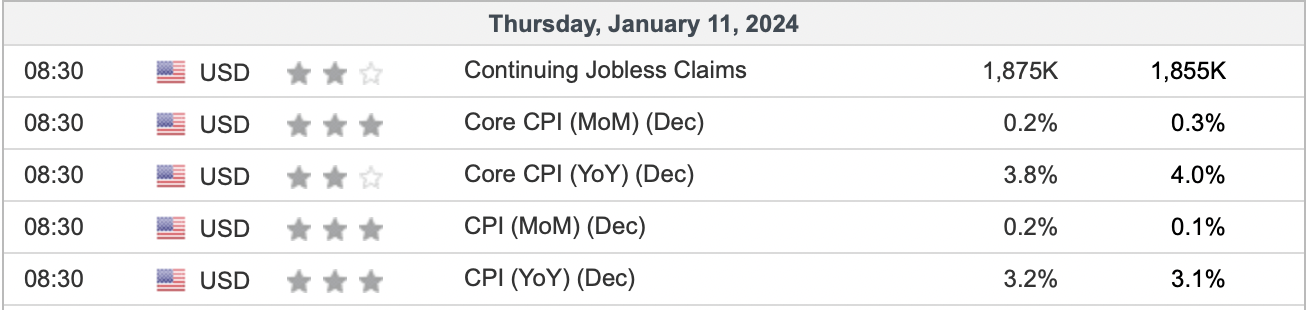
This week, we will get the critical core CPI data. The consensus estimate is for a decline to 3.8% from the 4% figure in the previous month. We must see 3.8% or better (preferably 3.6-3.7%), or the market will be disappointed if inflation ticks up. A 3.9-4% core CPIT number would be highly disappointing, as this would illustrate that inflation is re-surging. This dynamic would make it more challenging for the Fed to lower rates sooner, enabling an adverse market reaction. Therefore, we want a 3.6-3.8% core CPI read to keep markets in line.
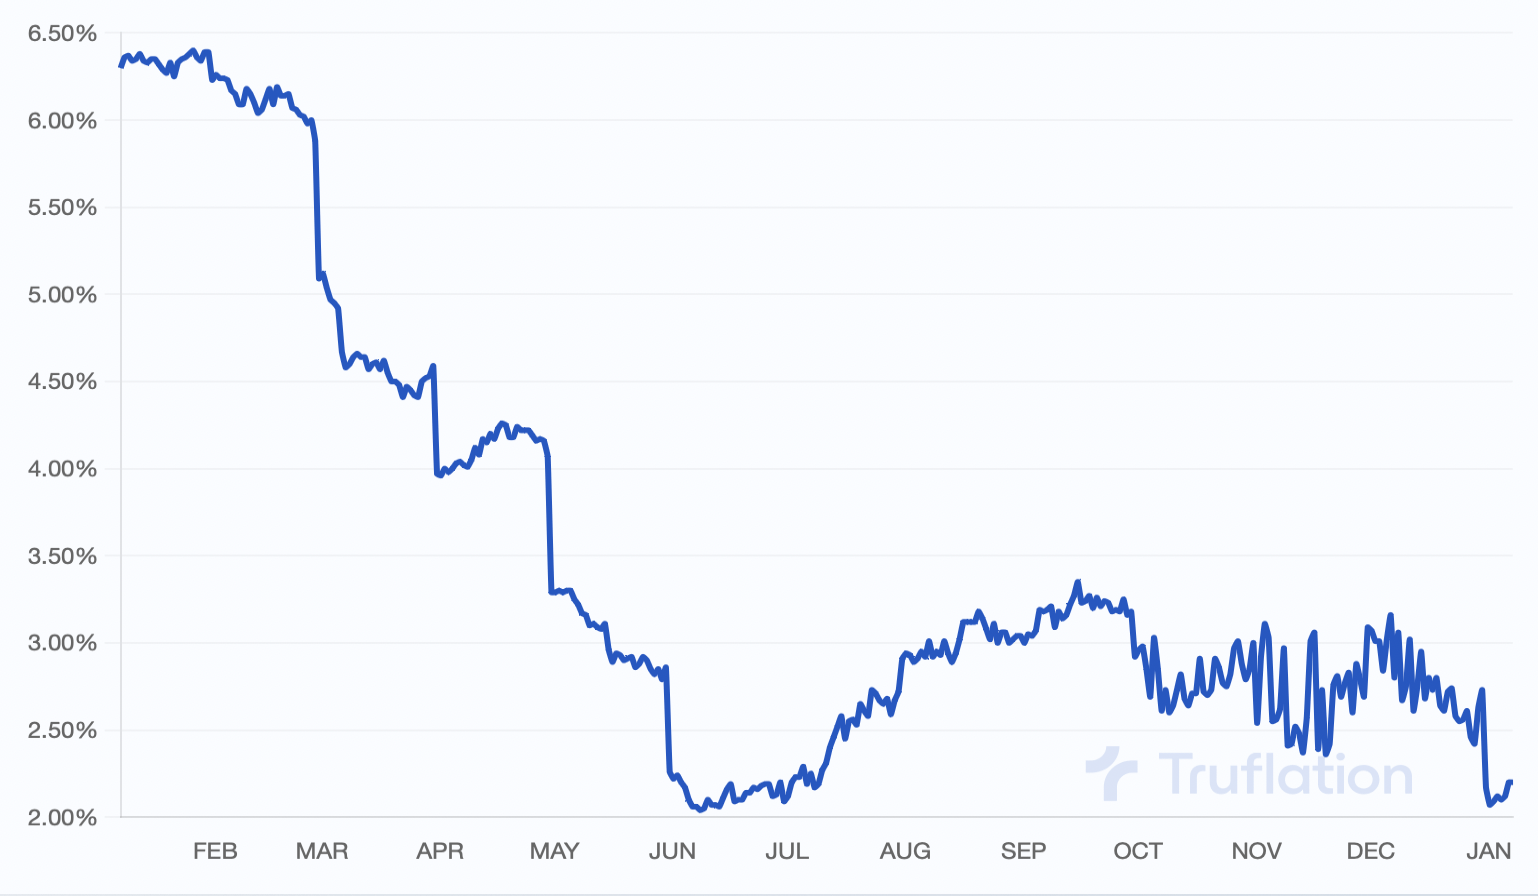
Truflation Inflation - Just 2.2%
Truflation inflation (Truflation.com )
Truflation inflation (a real-time, nongovernment inflation gauge) illustrates substantial progress on inflation, indicating inflation is around 2.2% right now. I like the truflation gauge because it is a real-time, optimized way of tracking inflation. Also, truflation is a possible prelude to the CPI/PCE data because it's not lagging. Therefore, the truflation figures may be close to what the core CPI should look like in future months. 2.2% is very close to the Fed's target rate, implying that we may see a favorable CPI reading this week, and the FOMC is likely close to introducing a more accessible monetary policy.
What The Fed Will Probably Do Soon
There's an FOMC late this month (31st January). Yet, the Fed will likely refrain from dropping the benchmark this month. As of now, there is only about a 5% chance that the Fed will lower the funds rate by 25 Bps. However, this probability will likely increase if the CPI number comes in lower than expected this week. Also, there is a high probability that the FOMC will decrease the benchmark in Q1.
Rate probabilities (CMEGroup.com )
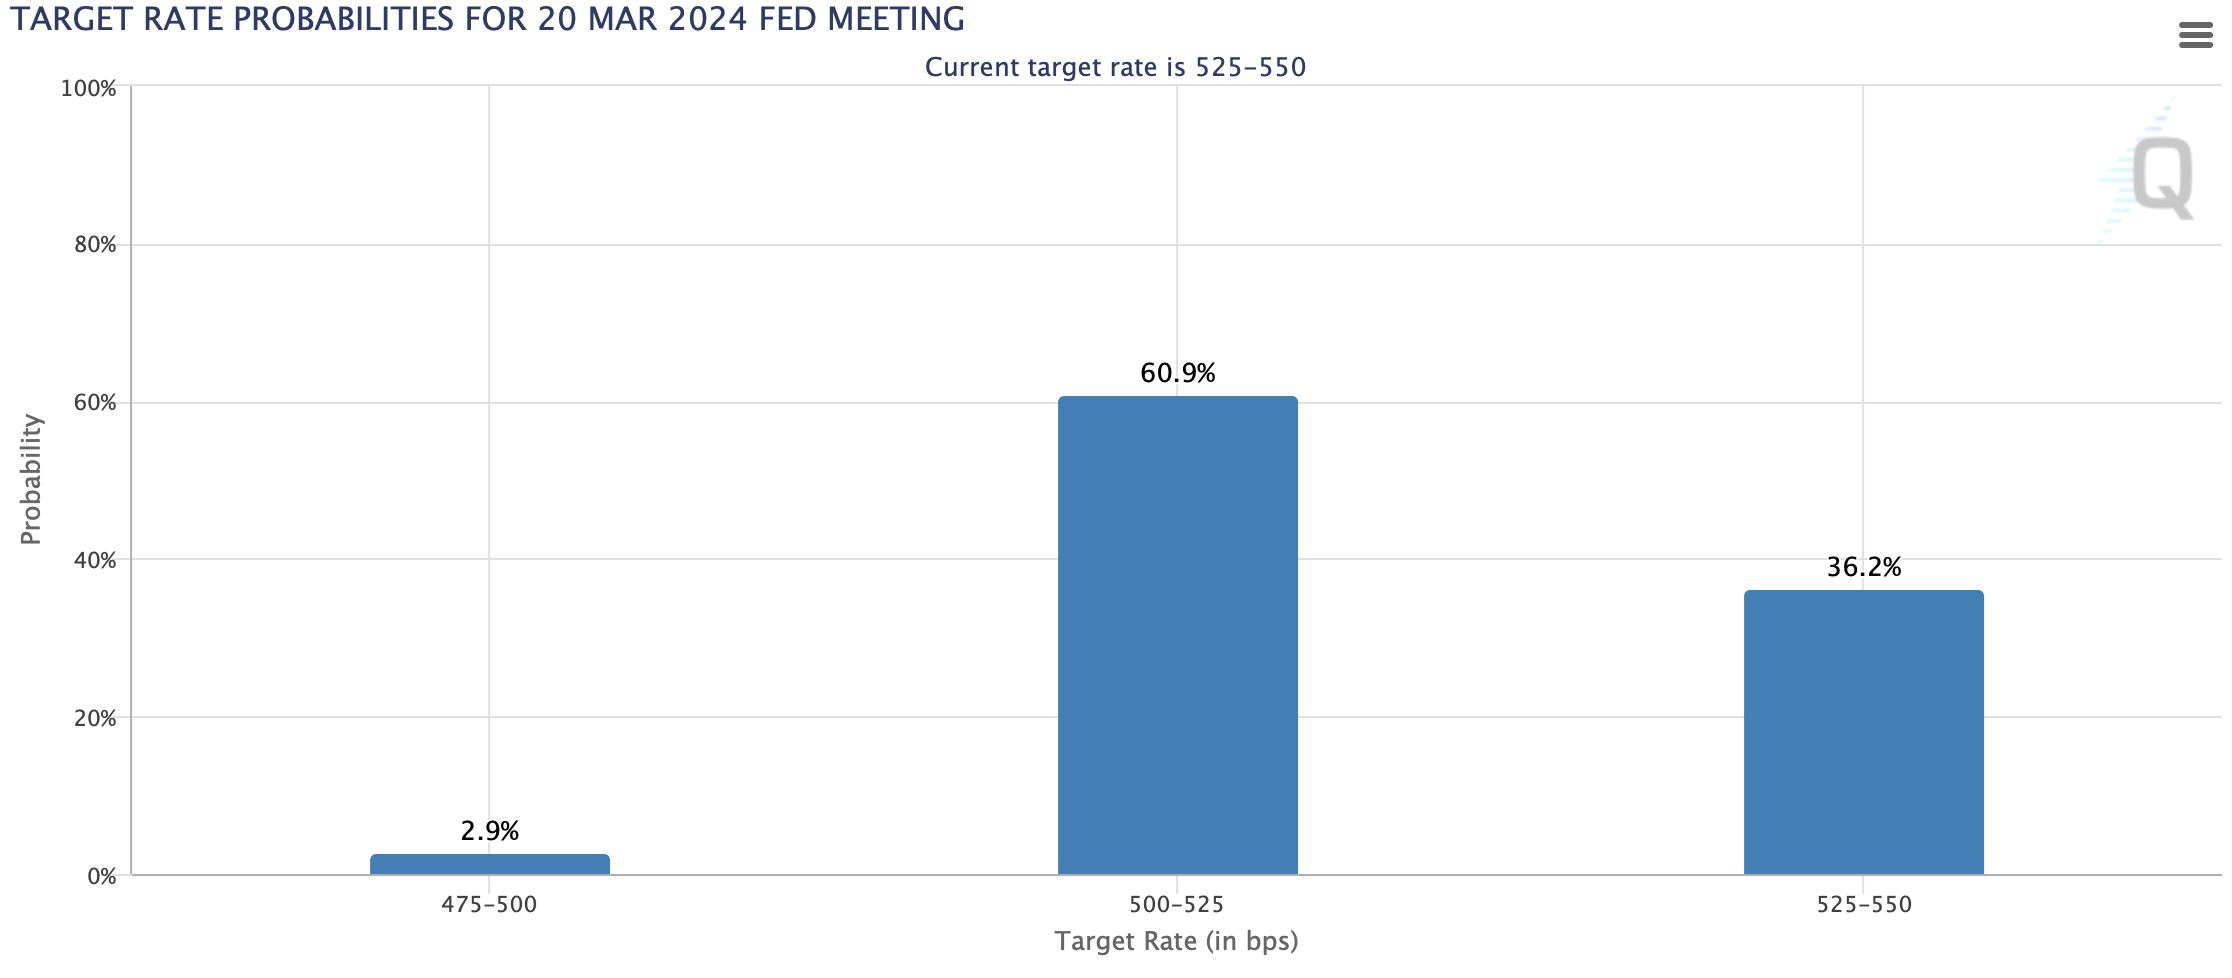
The current target rate is 5.25-5.5%. However, there is a 64% probability that the FOMC will cut the benchmark by 25-50 Bps by the March 20th meeting in late Q1. This dynamic illustrates a high probability that we will finally see a more accessible monetary policy in the coming months.
Some market participants may argue that tightening policy has a "lag" effect, and we have not seen the full ramifications of tight monetary policy and its full impact. While this may be true, the market is a forward-looking mechanism, likely looking 6-9 months ahead. Therefore, unless the economy drops into a recession, we are likely looking at a net positive effect for risk assets in the new year.
The easier monetary stance should unlock lending standards, increasing money flow in the general economy. This dynamic should lead to increased expansion in the corporate and private sectors. Additionally, we could have a spillover effect on the government segment (this is probable in an election year), resulting in an additional growth bump for the economy this year.
I also expect QT to end this year, opening the door to QE policy (likely in 2025). The Fed's monetary stimulus can be combined with government (fiscal) stimulus, producing a compound effect and boosting even more growth in the U.S. economy. As we advance in the coming years, we see a long runway of monetary and fiscal stimulus for the economy. Additionally, we should have plenty of favorable tailwinds from AI and other growth drivers.
This setup is quite favorable for risk assets. High-quality technology stocks and other systemically essential assets should benefit considerably from the upcoming economic atmosphere.
Are Stocks Really Expensive?
Is the stock market really expensive with the S&P 500 21.5 P/E? Some market participants may argue that the S&P 500 is expensive at 20 or 21 P/E. Some say the S&P 500's "fair value" is around a 13-15 P/E ratio. However, it's all relative, and the SPX's valuation is not a stagnant variable. What the SPX's valuation should be is subjective, and at the end of the day, it's what the market decides that matters.
Also, when was the last time the S&P 500's valuation was sustainable around a 15 P/E ratio, in the 1970s? Persistent inflation pushes most things higher, including stock multiples, over the long run. Another continuous and persistent phenomenon is lower and lower interest rates. As interest rates drift toward zero, stocks will deserve higher multiples as we move on.
Major average valuations (WSJ.com)
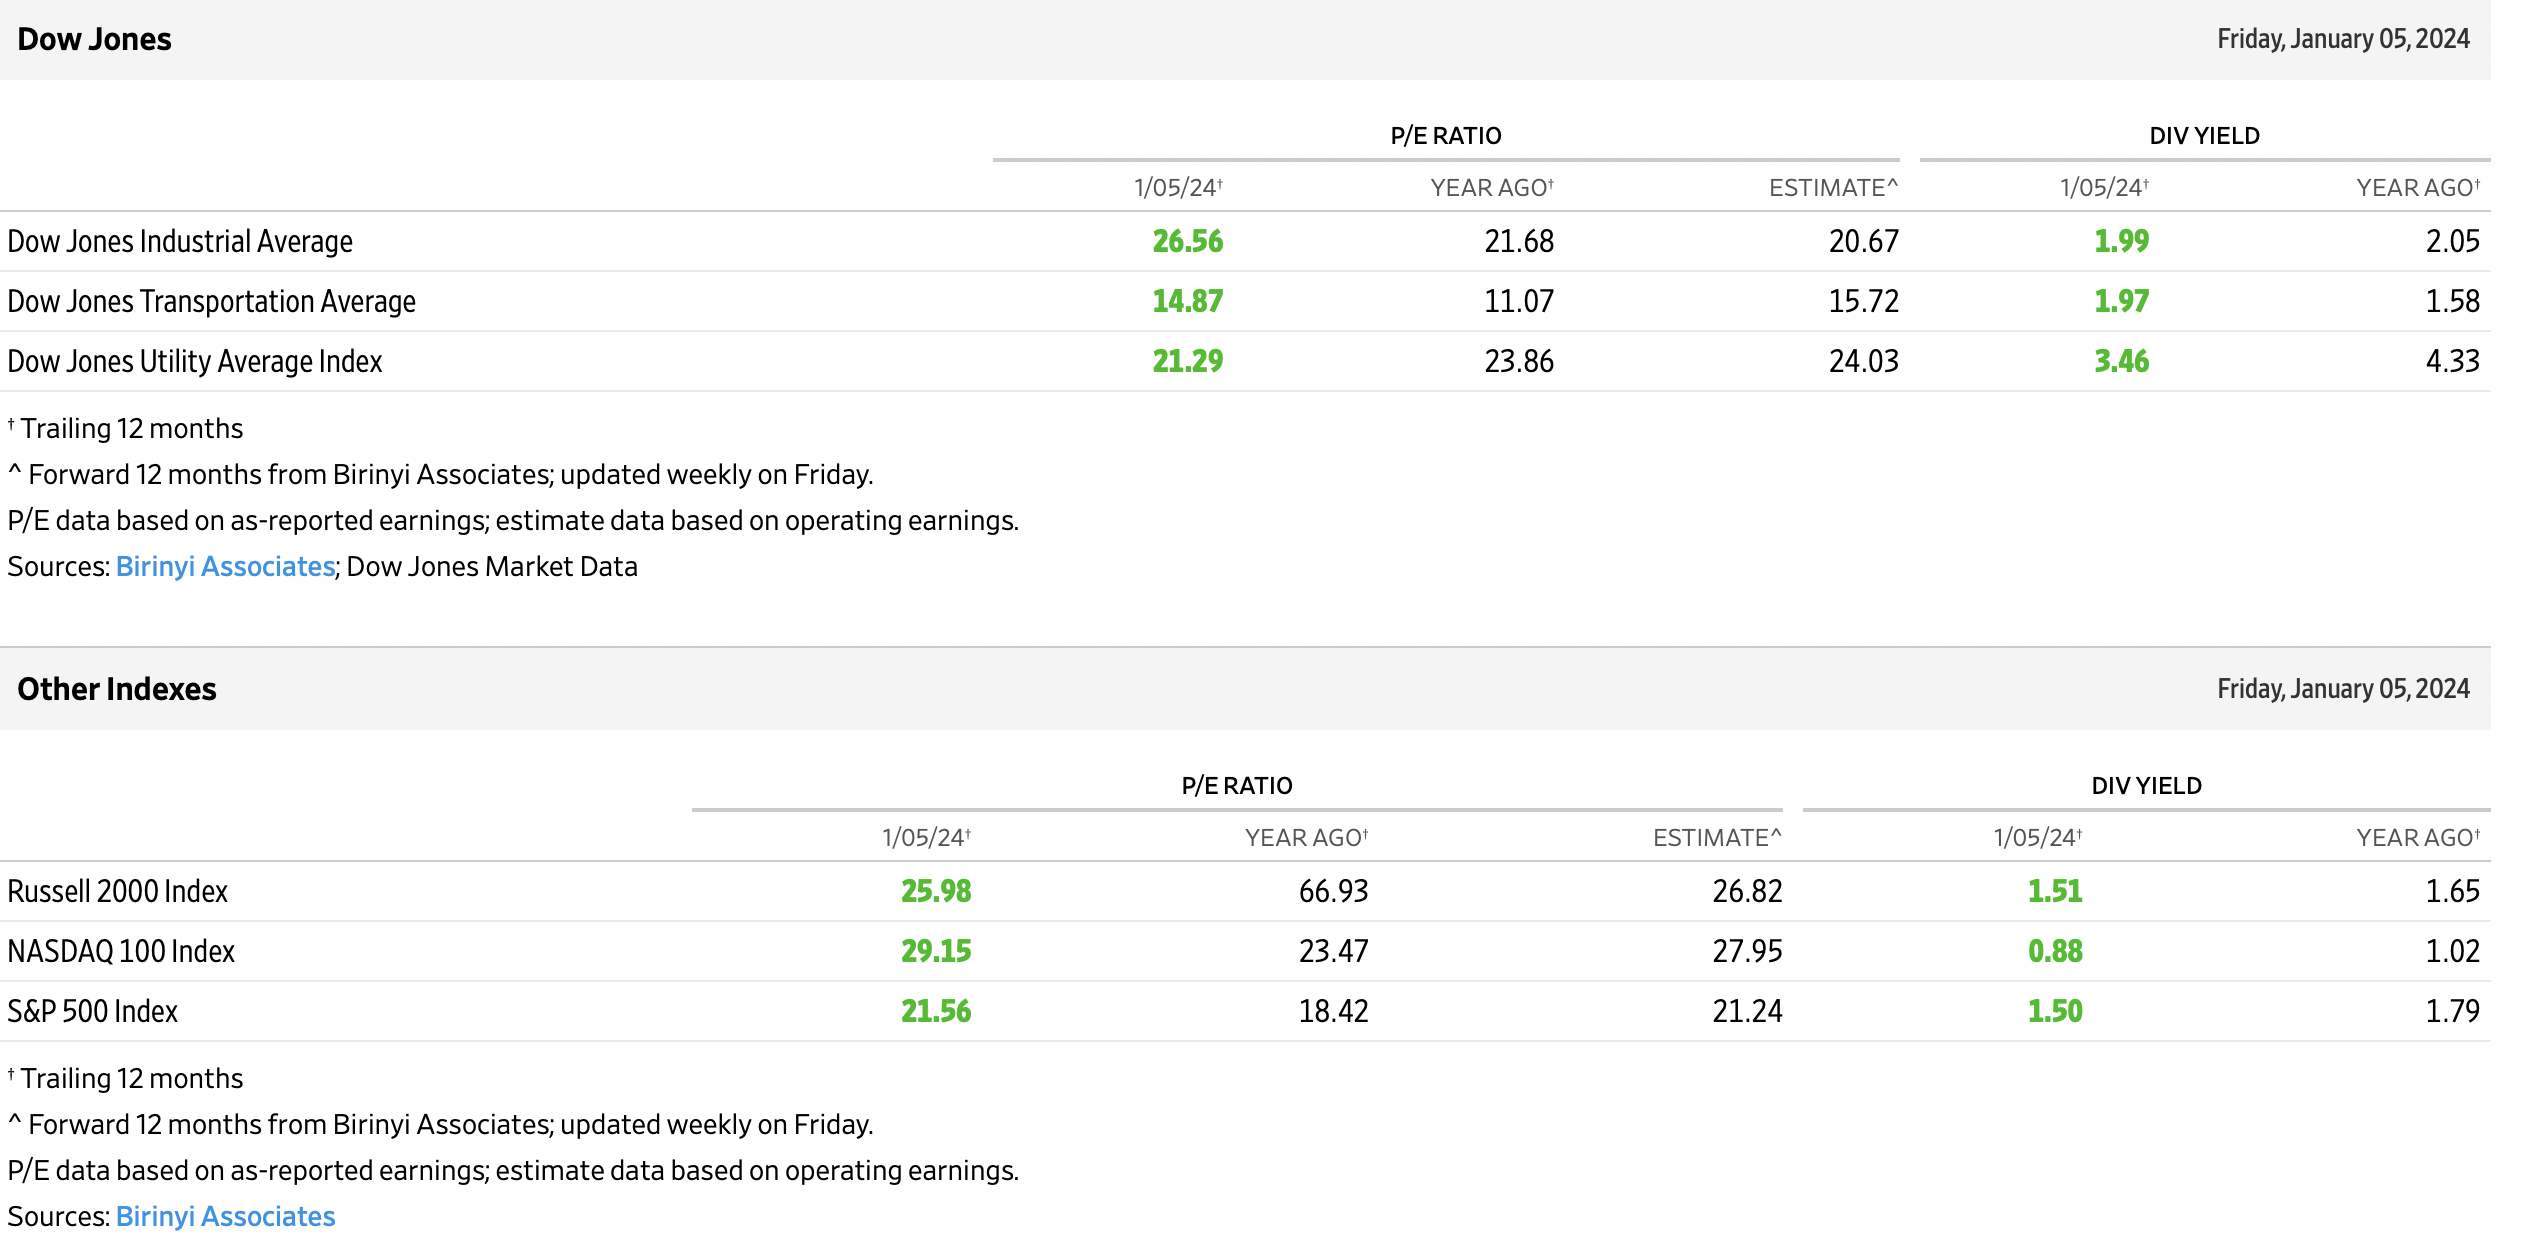
The SPX 500's forward P/E multiple is 21.24 here . However, that looks like a lowballed estimate, as it factors in almost no earnings growth this year. The consensus estimate for the S&P 500 companies is for 5% EPS growth this year. 5% EPS growth would drop the S&P 500's forward P/E ratio to the 21-20 level. Also, due to burgeoning growth industries like AI, a more accessible monetary environment, and other favorable elements, the S&P 500 companies may see improved EPS growth this year.
In a bullish case outcome, we may see around 7-8% EPS growth this year, accelerating to about 10% in 2025. Therefore, the S&P 500's future (2025) P/E ratio may be only about 17-18 here. This dynamic implies that stocks may be cheaper than they seem, and we could see increased demand for high-quality stocks in 2024/2025. Thus, the S&P 500 could rise to around 5,200 this year, with more gains to new ATHs in 2025.
For further details see:
Is The S&P 500 Overvalued, Really?