XOM - IWD: A Well-Diversified Value ETF With A Few Weaknesses
2023-06-23 11:06:58 ET
Summary
- iShares Russell 1000 Value ETF invests in large and mid-cap stocks with low price-to-book and low growth.
- It is better diversified across sectors and holdings than its parent index.
- It is close to the Russell 1000 benchmark in return since inception, but it lags in 2023.
- Two popular competitors have done better in the last 10 years.
- Most value funds have two weaknesses, this one is no exception.
This article series aims at evaluating ETFs (exchange-traded funds) regarding past performance and portfolio metrics. Reviews with updated data are posted when necessary.
IWD strategy and portfolio
iShares Russell 1000 Value ETF ( IWD ) started investing operations on 5/22/2000 and tracks the Russell 1000 Value Index. It has 850 holdings, a 12-month trailing yield of 2.23%, and an expense ratio of 0.18%. Distributions are paid quarterly.
As described in the prospectus:
The Underlying Index measures the performance of equity securities of Russell 1000 Index issuers with lower price-to-book ratios, lower sales per share historical growth and lower forecasted growth.
It represents about 49% of the total market value of the Russell 1000. IWD portfolio turnover rate was 17% in the last fiscal year.
The fund invests almost exclusively in U.S. companies (98.4% of asset value). Large and mega-cap companies weigh about 65%, mid-caps about 29%, and small caps about 5%. Hereafter, I will use iShares Russell 1000 ETF ( IWB ) as a benchmark.
IWD is significantly cheaper than IWB regarding the usual valuation ratios, as reported in the next table.
| IWD |
| IWB |
| Price/Earnings TTM |
| 15.56 |
| 20.72 |
| Price/Book |
| 2.11 |
| 3.61 |
| Price/Sales |
| 1.57 |
| 2.28 |
| Price/Cash Flow |
| 10.76 |
| 14.75 |
The top 3 sectors are financials (20.4%), healthcare (16.1%), and industrials (11.2%). Other sectors are below 10%. Compared to the Russell 1000, the fund massively underweights technology and consumer discretionary. It overweights all other sectors, mostly financials, energy, and utilities. As a result, IWD is better balanced across sectors than its parent index.
IWD sector breakdown (Chart: author; data: iShares)
The top 10 holdings, listed in the next table with valuation ratios, represent 18.8% of asset value. The heaviest one, Berkshire Hathaway, weighs 3.26%. The fund is better diversified than the Russell 1000, where the heaviest constituent, Apple Inc. ( AAPL ), weighs 6.87%.
| Ticker |
| Name |
| Weight |
| P/E TTM |
| P/E fwd |
| P/Sales TTM |
| P/Book |
| P/Net Free Cash Flow |
| Yield % |
| Berkshire Hathaway Inc. |
| 3.26 |
| 97.14 |
| 21.80 |
| 2.32 |
| 1.46 |
| 32.00 |
| 0 |
| Meta Platforms, Inc. |
| 2.63 |
| 35.34 |
| 24.03 |
| 6.30 |
| 5.93 |
| 42.10 |
| 0 |
| Johnson & Johnson |
| 2.3 |
| 34.64 |
| 15.55 |
| 4.48 |
| 6.09 |
| 98.75 |
| 2.87 |
| Exxon Mobil Corp. |
| 2.29 |
| 6.99 |
| 10.36 |
| 1.08 |
| 2.13 |
| 9.74 |
| 3.52 |
| JPMorgan Chase & Co. |
| 2.22 |
| 10.30 |
| 9.59 |
| 2.31 |
| 1.51 |
| 9.27 |
| 2.87 |
| Chevron Corp. |
| 1.6 |
| 8.25 |
| 11.06 |
| 1.25 |
| 1.82 |
| 11.21 |
| 3.96 |
| Pfizer Inc. |
| 1.17 |
| 7.63 |
| 11.61 |
| 2.39 |
| 2.20 |
| 14.66 |
| 4.23 |
| Walmart Inc. |
| 1.17 |
| 37.54 |
| 24.97 |
| 0.68 |
| 5.82 |
| 31.49 |
| 1.46 |
| Cisco Systems, Inc. |
| 1.12 |
| 18.36 |
| 13.43 |
| 3.83 |
| 4.97 |
| 19.89 |
| 3.05 |
| Procter & Gamble Co. |
| 1.08 |
| 26.12 |
| 25.60 |
| 4.58 |
| 8.37 |
| 114.89 |
| 2.51 |
Performance
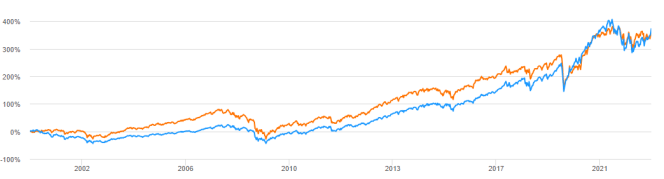
Since 6/1/2000, IWD has underperformed IWB by a short margin of 15 bps in annualized return, which is not significant. Volatility (standard deviation of monthly returns) and Sharpe ratio (risk-adjusted performance) are also close to the benchmark. However, the maximum drawdown is deeper by almost 5 percentage points (see next table).
| Total Return |
| Annual.Return |
| Drawdown |
| Sharpe Ratio |
| Volatility |
| IWD |
| 353.42% |
| 6.78% |
| -60.10% |
| 0.41 |
| 15.42% |
| IWB |
| 368.60% |
| 6.93% |
| -55.38% |
| 0.4 |
| 15.65% |
Data calculated with Portfolio123.
IWD has alternately beaten and lagged its parent index, following the growth and value cycle.
IWD vs. IWB since July 2000 (Seeking Alpha)
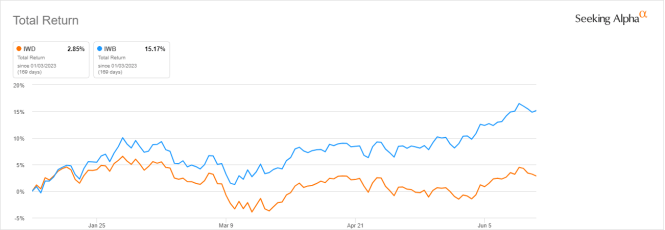
In 2023 to date, IWD is lagging IWB by over 12%:
IWD vs. IWB, year to date (Seeking Alpha)
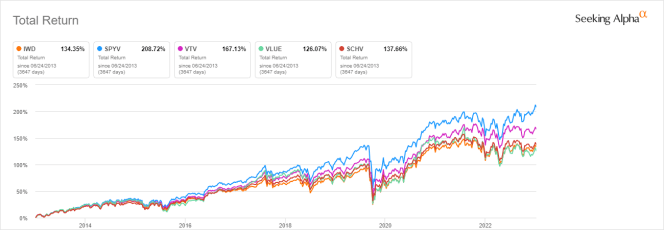
The next chart plots the 10-year total returns of IWD and four large and mid-cap value ETFs by different issuers:
- SPDR Portfolio S&P 500 Value ETF ( SPYV )
- Vanguard Value Index Fund ( VTV )
- iShares MSCI USA Value Factor ETF ( VLUE )
- Schwab U.S. Large-Cap Value ETF ( SCHV )
IWD is significantly behind the S&P 500 Value Index and the Vanguard Value Index.
IWD vs competitors, 10-year total return (Seeking Alpha)
Comparing IWD with my Dashboard List model
The Dashboard List is a list of 60 to 80 stocks in the S&P 1500 index, updated every month based on a simple quantitative methodology. All stocks in the Dashboard List are cheaper than their respective industry median in Price/Earnings, Price/Sales, and Price/Free Cash Flow. An exception in utilities: the Price/Free Cash Flow is not taken into account to avoid some inconsistencies. Then, the 10 eligible companies with the highest Return on Equity in every sector are kept in the list. Some sectors are grouped together: Energy with materials, communication with technology. Real estate is excluded because these valuation metrics don't work well in this sector. I have been updating the Dashboard List every month on Seeking Alpha since December 2015, first in free-access articles, then in Quantitative Risk & Value.
The next table compares the fund's performance since 6/1/2000 with the Dashboard List model, with a tweak: here the Dashboard List is rebalanced annually to make it comparable with a passive index.
| Total Return |
| Annual.Return |
| Drawdown |
| Sharpe Ratio |
| Volatility |
| IWD |
| 353.42% |
| 6.78% |
| -60.10% |
| 0.41 |
| 15.42% |
| Dashboard List (annual) |
| 979.03% |
| 10.87% |
| -56.78% |
| 0.58 |
| 17.31% |
Past performance is not a guarantee of future returns. Calculation with Portfolio123 .
The Dashboard List beats IWD by 4.1% in annualized return. However, the fund's performance is real, and the list is simulated.
Two weaknesses of value indexes
I like the idea of mixing various ratios to rank value stocks. However, I think most value indexes doing so have two weaknesses, and IWD is no exception. The first one is to classify all stocks on the same criteria. It means the valuation ratios are considered comparable across sectors and industries. Obviously, they are not: My monthly dashboard here shows how valuation and quality metrics may vary across sectors.
The second weakness comes from the price/book ratio (P/B), which adds some risk in the strategy. Historical data show that a large group of companies with low P/B has a higher volatility and deeper drawdowns than a same-size group with low price/earnings, price/sales or price/free cash flow. The next table shows the return and risk metrics of the cheapest quarter of the S&P 500 (i.e., 125 stocks) measured in price/book, price/earnings, price/sales, and price/free cash flow. The sets are reconstituted annually between 1/1/2000 and 1/1/2023 with elements in equal weight.
| Annual.Return |
| Drawdown |
| Sharpe Ratio |
| Volatility |
| Cheapest quarter in P/B |
| 8.54% |
| -81.55% |
| 0.35 |
| 37.06% |
| Cheapest quarter in P/E |
| 10.71% |
| -73.62% |
| 0.48 |
| 25.01% |
| Cheapest quarter in P/S |
| 12.82% |
| -76.16% |
| 0.47 |
| 34.83% |
| Cheapest quarter in P/FCF |
| 15.32% |
| -74.77% |
| 0.61 |
| 27.03% |
Data calculated with Portfolio123.
This explains why I use P/FCF and not P/B in the Dashboard List model.
Takeaway
iShares Russell 1000 Value ETF invests in large and mid-cap stocks with lower price-to-book ratios, lower sales growth and lower forecasted growth. The fund is better balanced across sectors and holdings than its parent index Russell 1000. IWD is close to the Russell 1000 in total return since inception, but it is lagging in 2023. The fund has underperformed the S&P 500 Value Index and the Vanguard Value Index in the last 10 years. IWD may be very useful for swing trading, or in a tactical allocation strategy, switching between value and growth styles. However, it has not brought excess return to its parent index over the long term. Independently of the growth/value paradigm, I see two weaknesses in the underlying index: Ranking stocks regardless of their industries and relying too much on the price/book ratio.
For further details see:
IWD: A Well-Diversified Value ETF With A Few Weaknesses