XOM - IXC: Oil Stocks Face Near-Term Risks But I Remain Long
Summary
- Oil stocks remain near all-time highs despite the significant decline in oil prices seen over recent months, which suggest near-term caution towards the sector is warranted.
- While the sector has seen its valuation discount narrow significantly, it remains attractive relative to the broader market.
- The iShares Global Energy ETF has an impressive dividend yield at 4.8%, which is significantly higher than the XLE's 3.7% and the MSCI World's 2.2%.
- In addition to the valuation discount, I am overweight energy majors due to their tendency to perform well during dire macroeconomic and political periods such as stagflation and war.
The outperformance of global oil and gas stocks over the past few years has been incredible, and largely justified by rising oil prices, but the rally now appears to have become overextended relative to the price of the commodity, at least in the short term. The sector's valuation discount versus the broader market has closed significantly but remains intact. I remain overweight the iShares Global Energy ETF ( IXC ) due to this valuation discount and the additional benefits afforded by energy stocks. (See here for previous article on IXC).
The IXC ETF
IXC tracks the performance of the S&P Global Energy Sector index and charges an expense fee of 0.4%, higher than its rival ETF, the [[XLE]], which tracks the Energy Select Sector SPDR Fund. In terms of country exposure, XLE is 100% focused on the U.S., while IXC has 62% of its assets in U.S. stocks and the rest spread across Canada, Europe, and the rest of the world. As a result, IXC is much more diversified, with the top 10 holdings accounting for 61% of the index versus 77% in the case of XLE. The combined weighting of Exxon ( XOM ) and Chevron ( CVX ) in IXC is 29% versus 42% in XLE. The outperformance of XOM over recent months has helped the XLE outperform the IXC, but the valuation differential is heavily in the latter's favor. The IXC also has a higher dividend yield at 4.8%, which is significantly higher than the XLE's 3.7% and the MSCI World's 2.2%.
Decline In Crude Oil Prices Is A Near-Term Risk
The IXC tends to follow the price of crude oil extremely closely, but over the past 6-12 months, the IXC has remained near its highs even as front-month Brent crude oil has fallen by almost 40%. The chart below shows the clear disconnect that has taken place over this period.
IXC Vs Front-Month Brent Crude Oil (Bloomberg)
In part this period of energy sector outperformance versus oil prices reflects the fact that oil and gas companies lock in long-term oil prices and so we should compare oil prices to long-dated future oil prices. As shown below, Brent crude oil for delivery in 2 years’ time has fallen less significantly, although the IXC's outperformance is still notable.
IXC Vs Brent Crude Oil For Delivery In 2025 (Bloomberg)
Valuation Discount Has Narrowed But Remains Intact
Such periods of IXC outperformance in the past have been associated with periods of strength in global stocks, as investors bid up all stock valuations simultaneously. This time, however, the outperformance of energy stocks relative to oil prices has occurred during a period of global equity market weakness. As a result, after trading at deeply undervalued levels for most of the past three years, the S&P Global Energy Sector's discount to the broader market has closed significantly.
This can be seen in the chart below, which plots the S&P Global Energy Sector's market cap relative to the MSCI World against the price of oil relative to US nominal GDP. The idea being that if oil prices rise relative to the size of the economy, oil stocks should outperform. The correlation over the past 20 years has been impressive, and the discount has fallen from around 50% in 2021 to less than 10% at present.
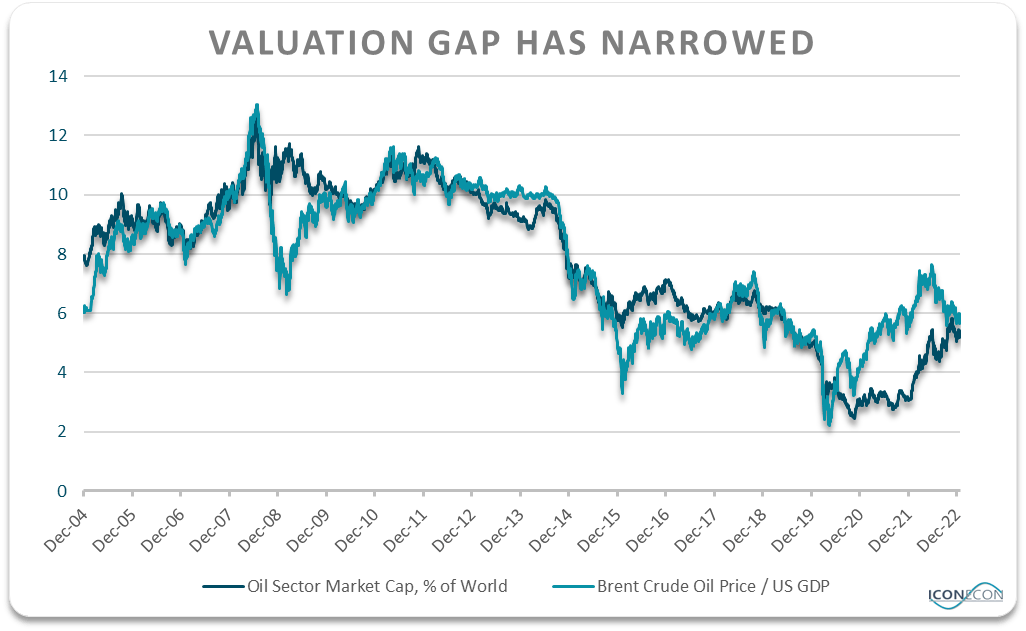
Current and forward P/E multiples paint a much more flattering picture of the energy sector’s valuation discount. The trailing and forward PE ratios of the S&P Global Energy Sector sit at 8.1x and 7.2x, versus 17.0x and 15.4x for the MSCI World. I believe that analysts are far too optimistic with their earnings expectations for the energy sector this year, which are much more likely to contract than to grow. Nonetheless, a significant valuation discount remains.
Other Reasons To Be Long Energy Majors
In addition to the valuation discount, I am overweight energy majors due to their tendency to perform well during dire macroeconomic and political periods such as stagflation and war. The price inelasticity of oil means that it takes a sharp rise in oil prices to bring about a fall in demand. In 2022, global oil consumption posted new post-Covid highs despite crude oil prices being almost 50% higher. I also believe that analysts are dramatically overestimating the negative impact of oil demand from the shift away from the use of fossil fuels in domestic use. Global oil consumption is within a whisker of its all-time highs despite China only just reopening to international travel.
For further details see:
IXC: Oil Stocks Face Near-Term Risks But I Remain Long