CA - Kinross Gold: Expecting Solid Production In 2023
2023-05-22 06:49:08 ET
Summary
- For Kinross Gold's first quarter of 2023, revenues were $929.3 million, with a net income of $90.2 million or $0.07 per share.
- Kinross Gold equivalent produced 466,022 attributable GEO in 1Q23 compared with 505,748 GEO in 1Q22.
- I suggest buying KGC between $5.10 and $5 with possible lower support at $4.85.
Part I - Introduction
Toronto-based Kinross Gold Corp. ( KGC ) released its first quarter 2023 results on May 9, 2023.
Note: I have followed KGC quarterly since 2015. This new article is a quarterly update of my article published on December 12, 2022.
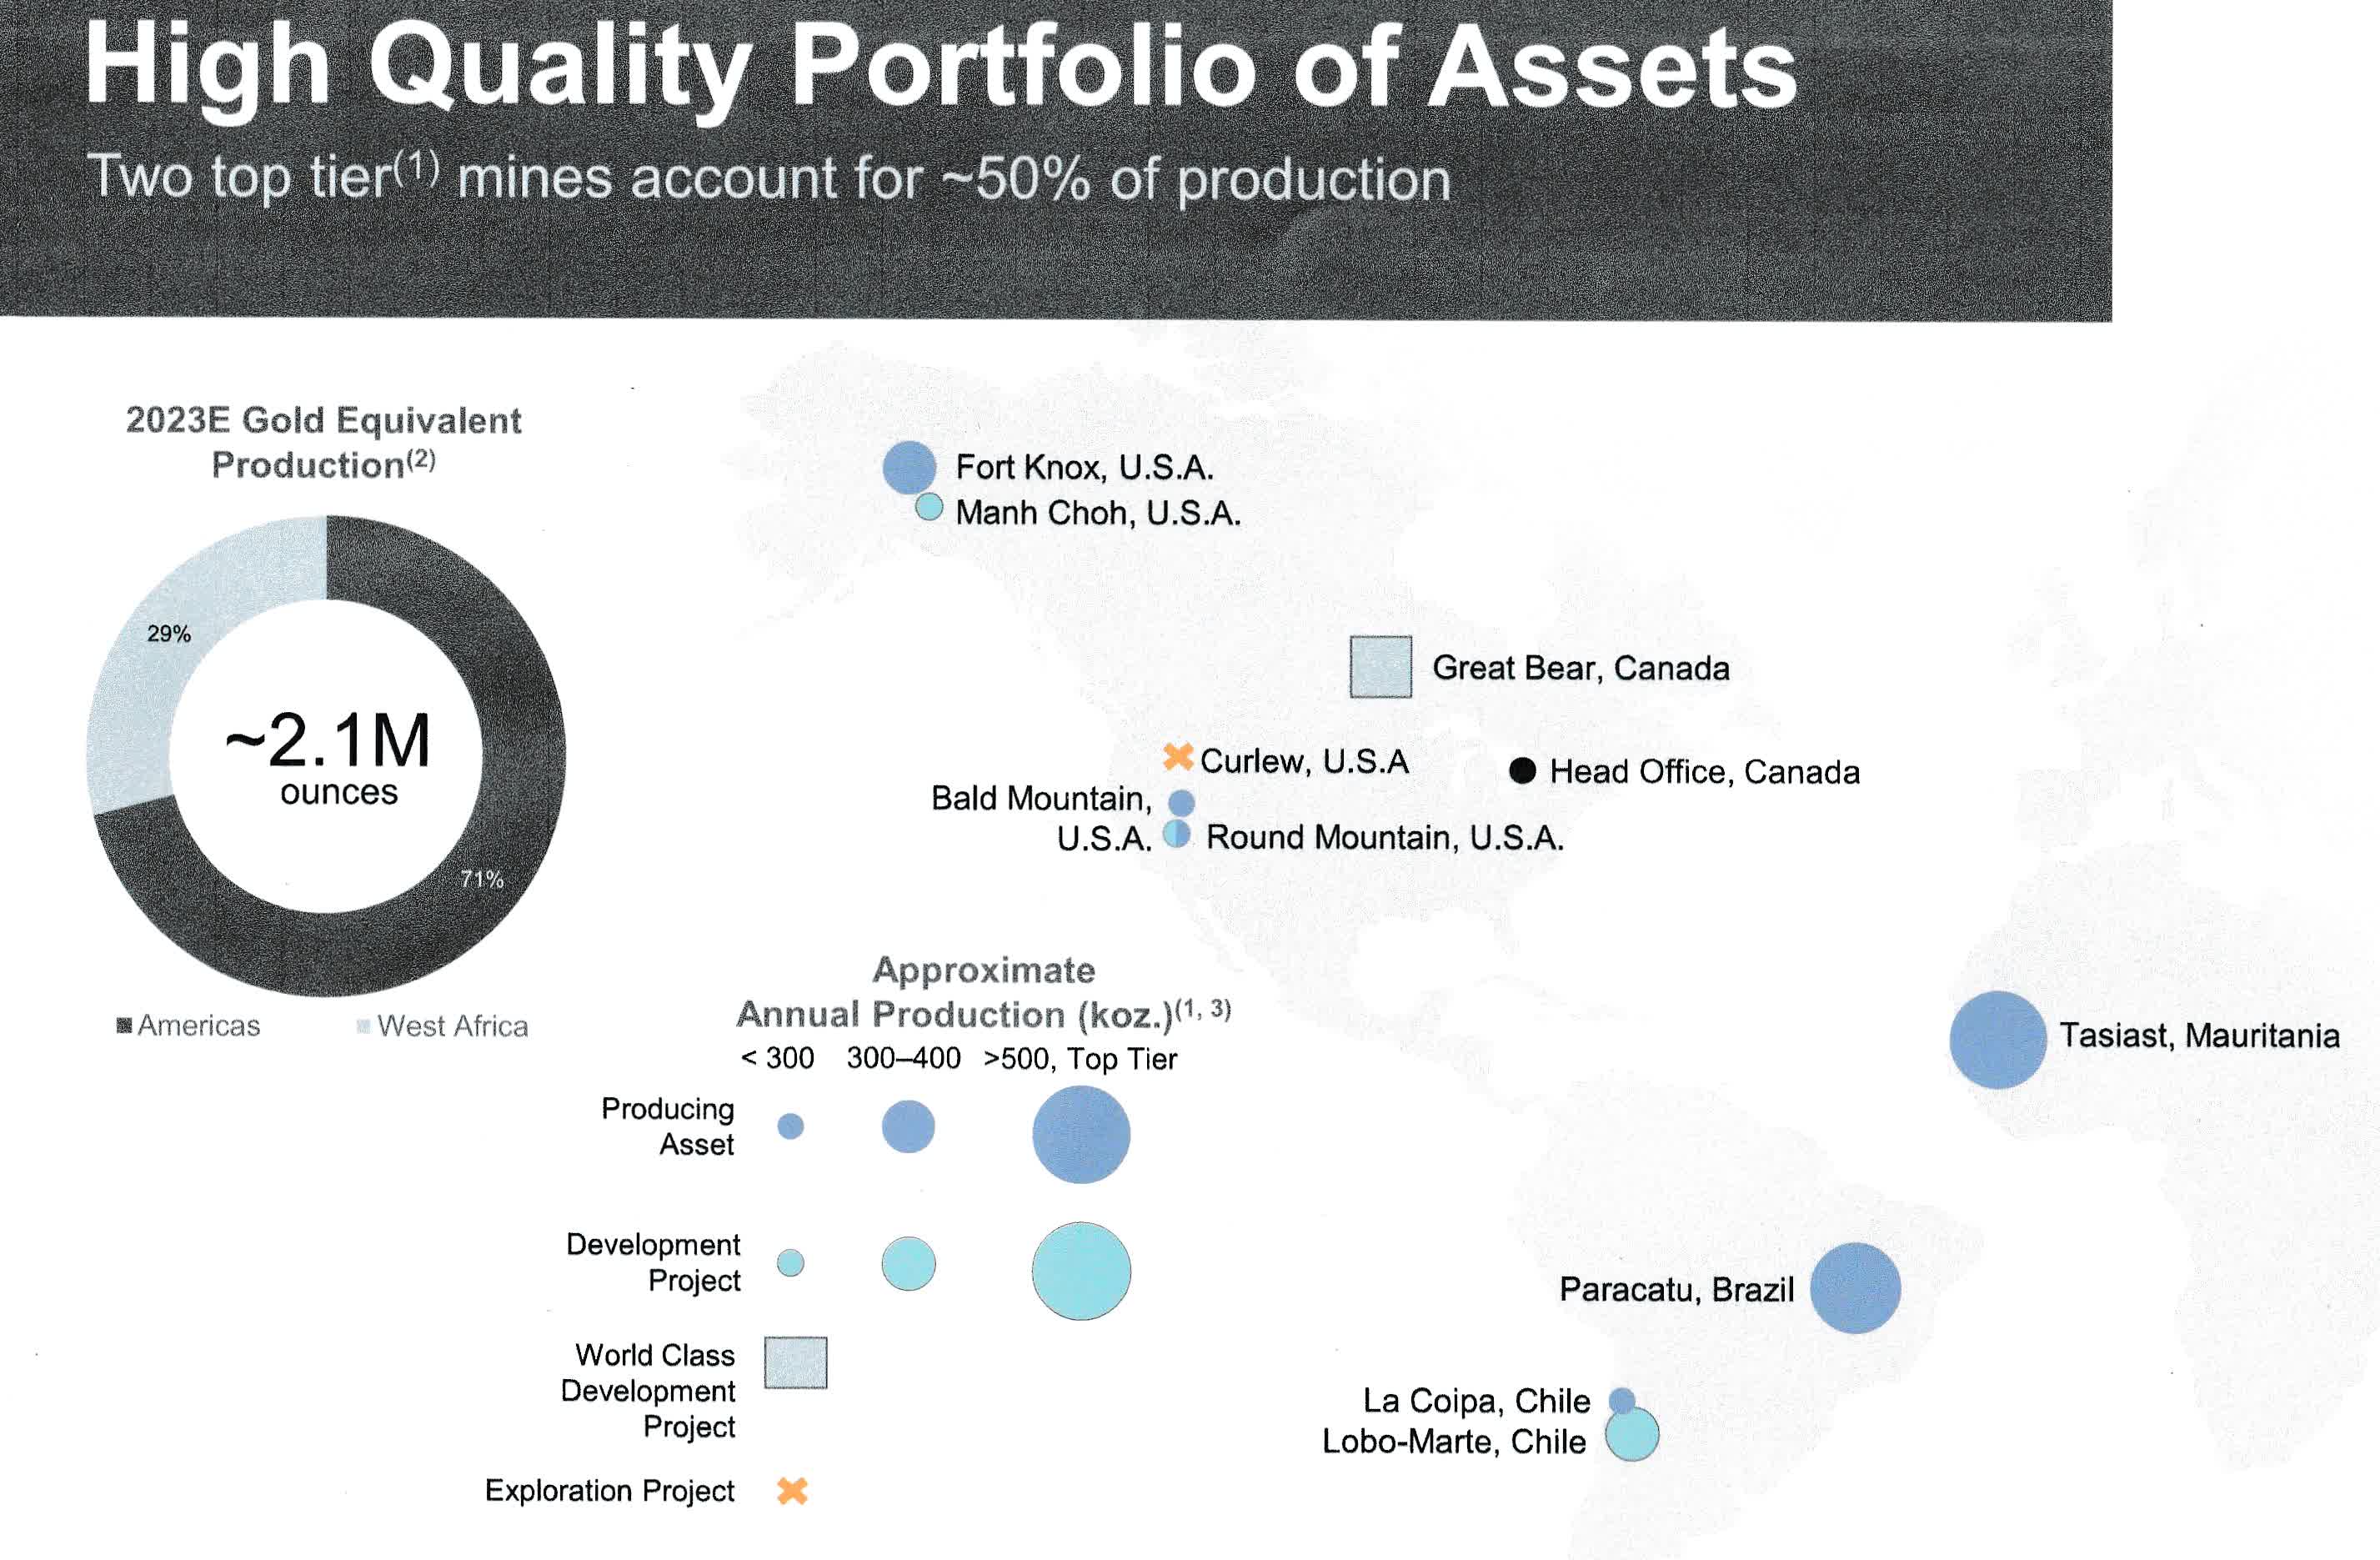
KGC Map Assets Presentation (KGC May Presentation)
Important Reminder: On June 16, 2022, Kinross Gold completed the sale of 100% of its Russian assets to the Highland Gold Mining group of companies for total cash consideration of $340 million.
On February 22, 2022, KGC acquired the Great Bear Project in Ontario, Canada.
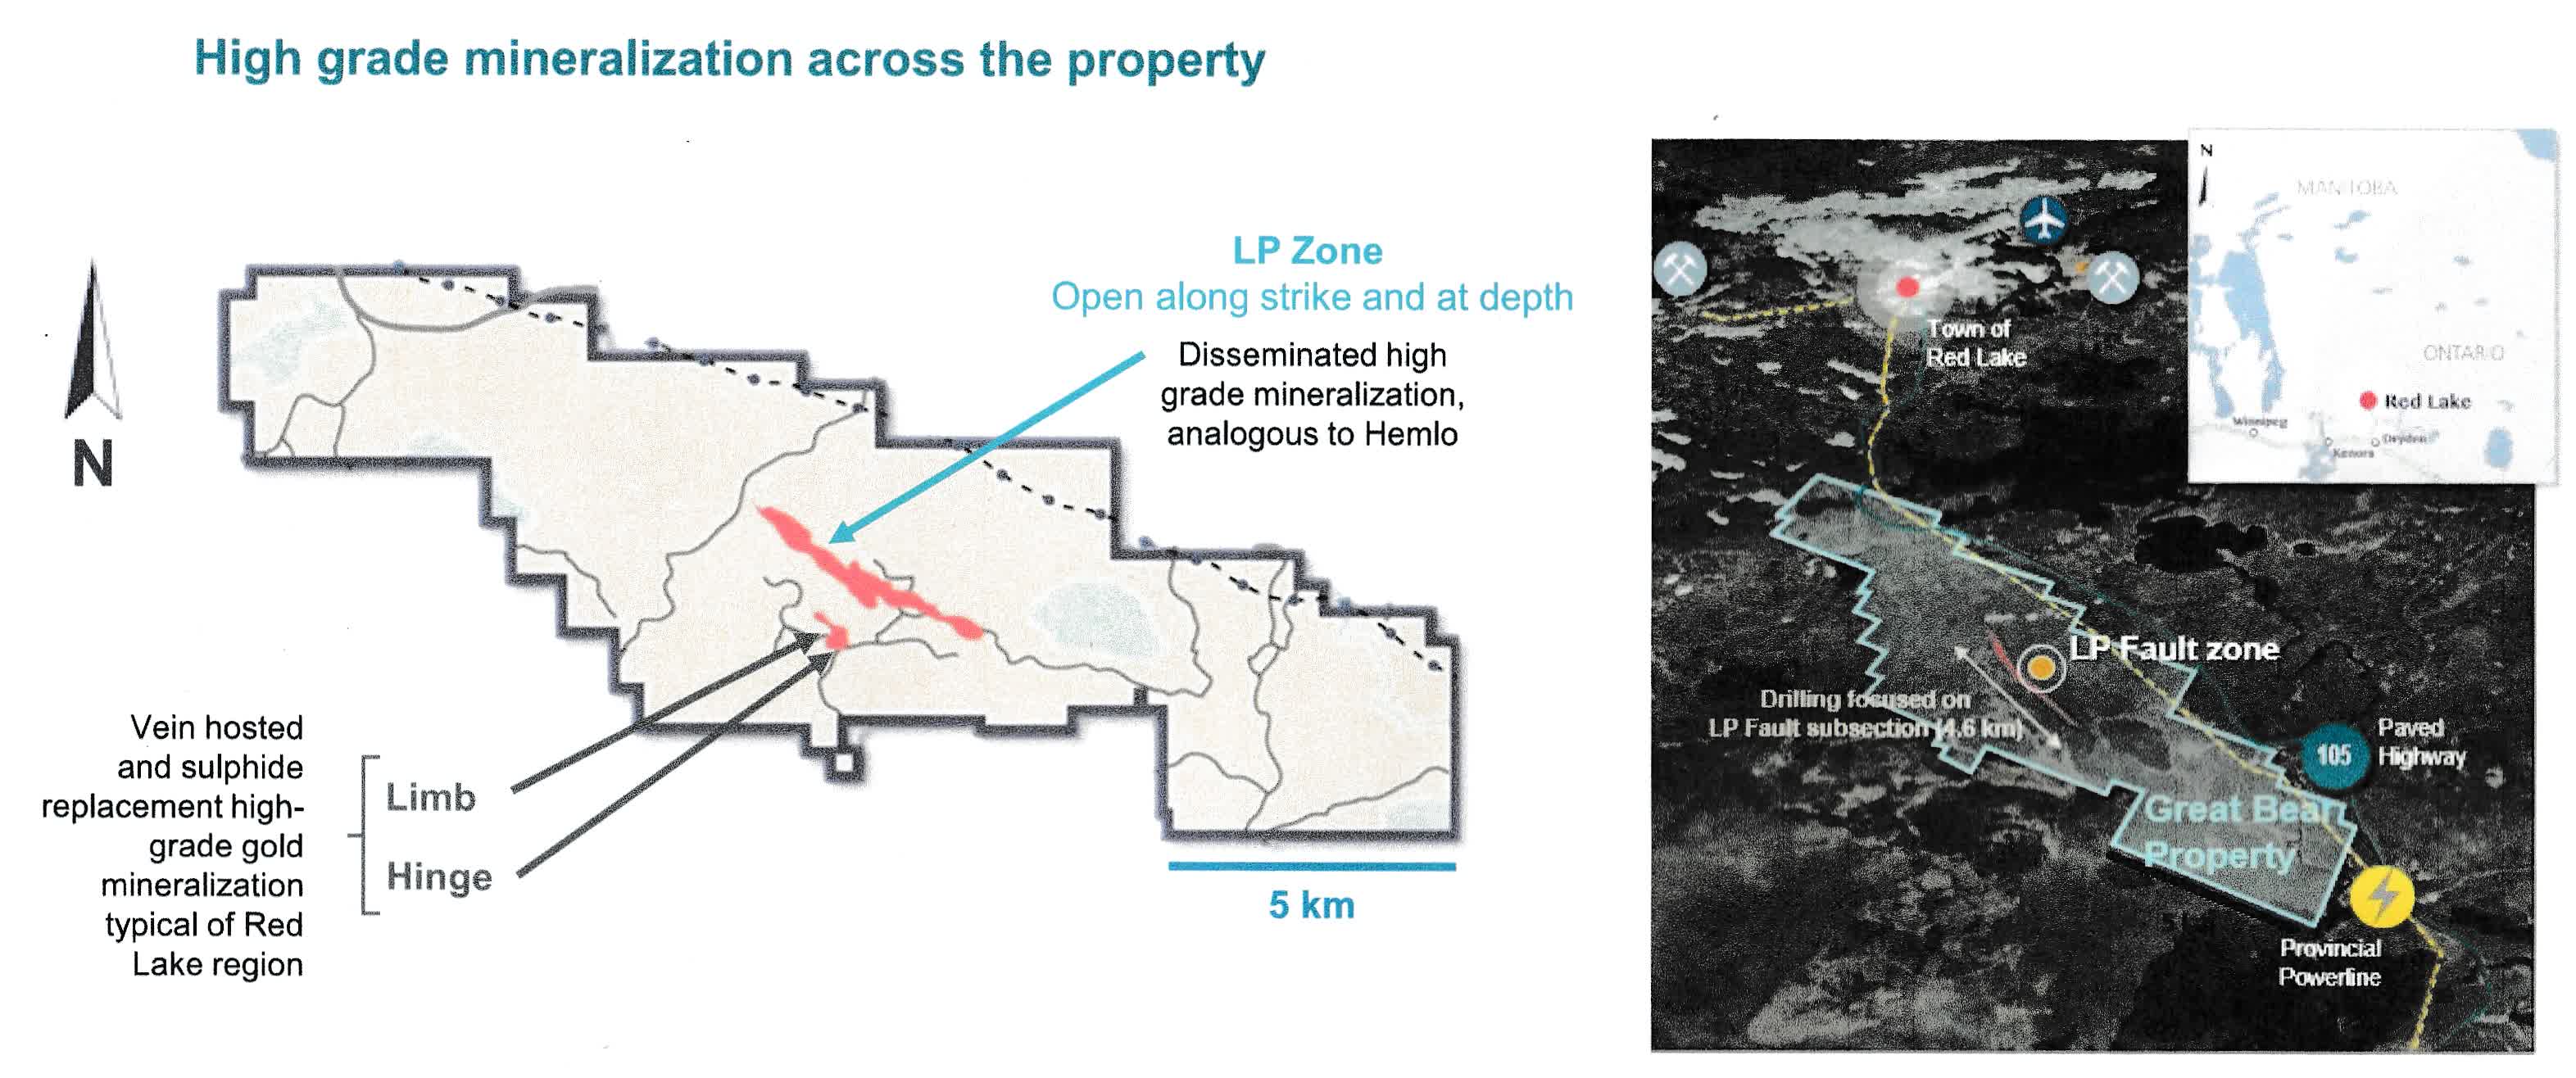
KGC Great Bear Project in Ontario (KGC Presentation)
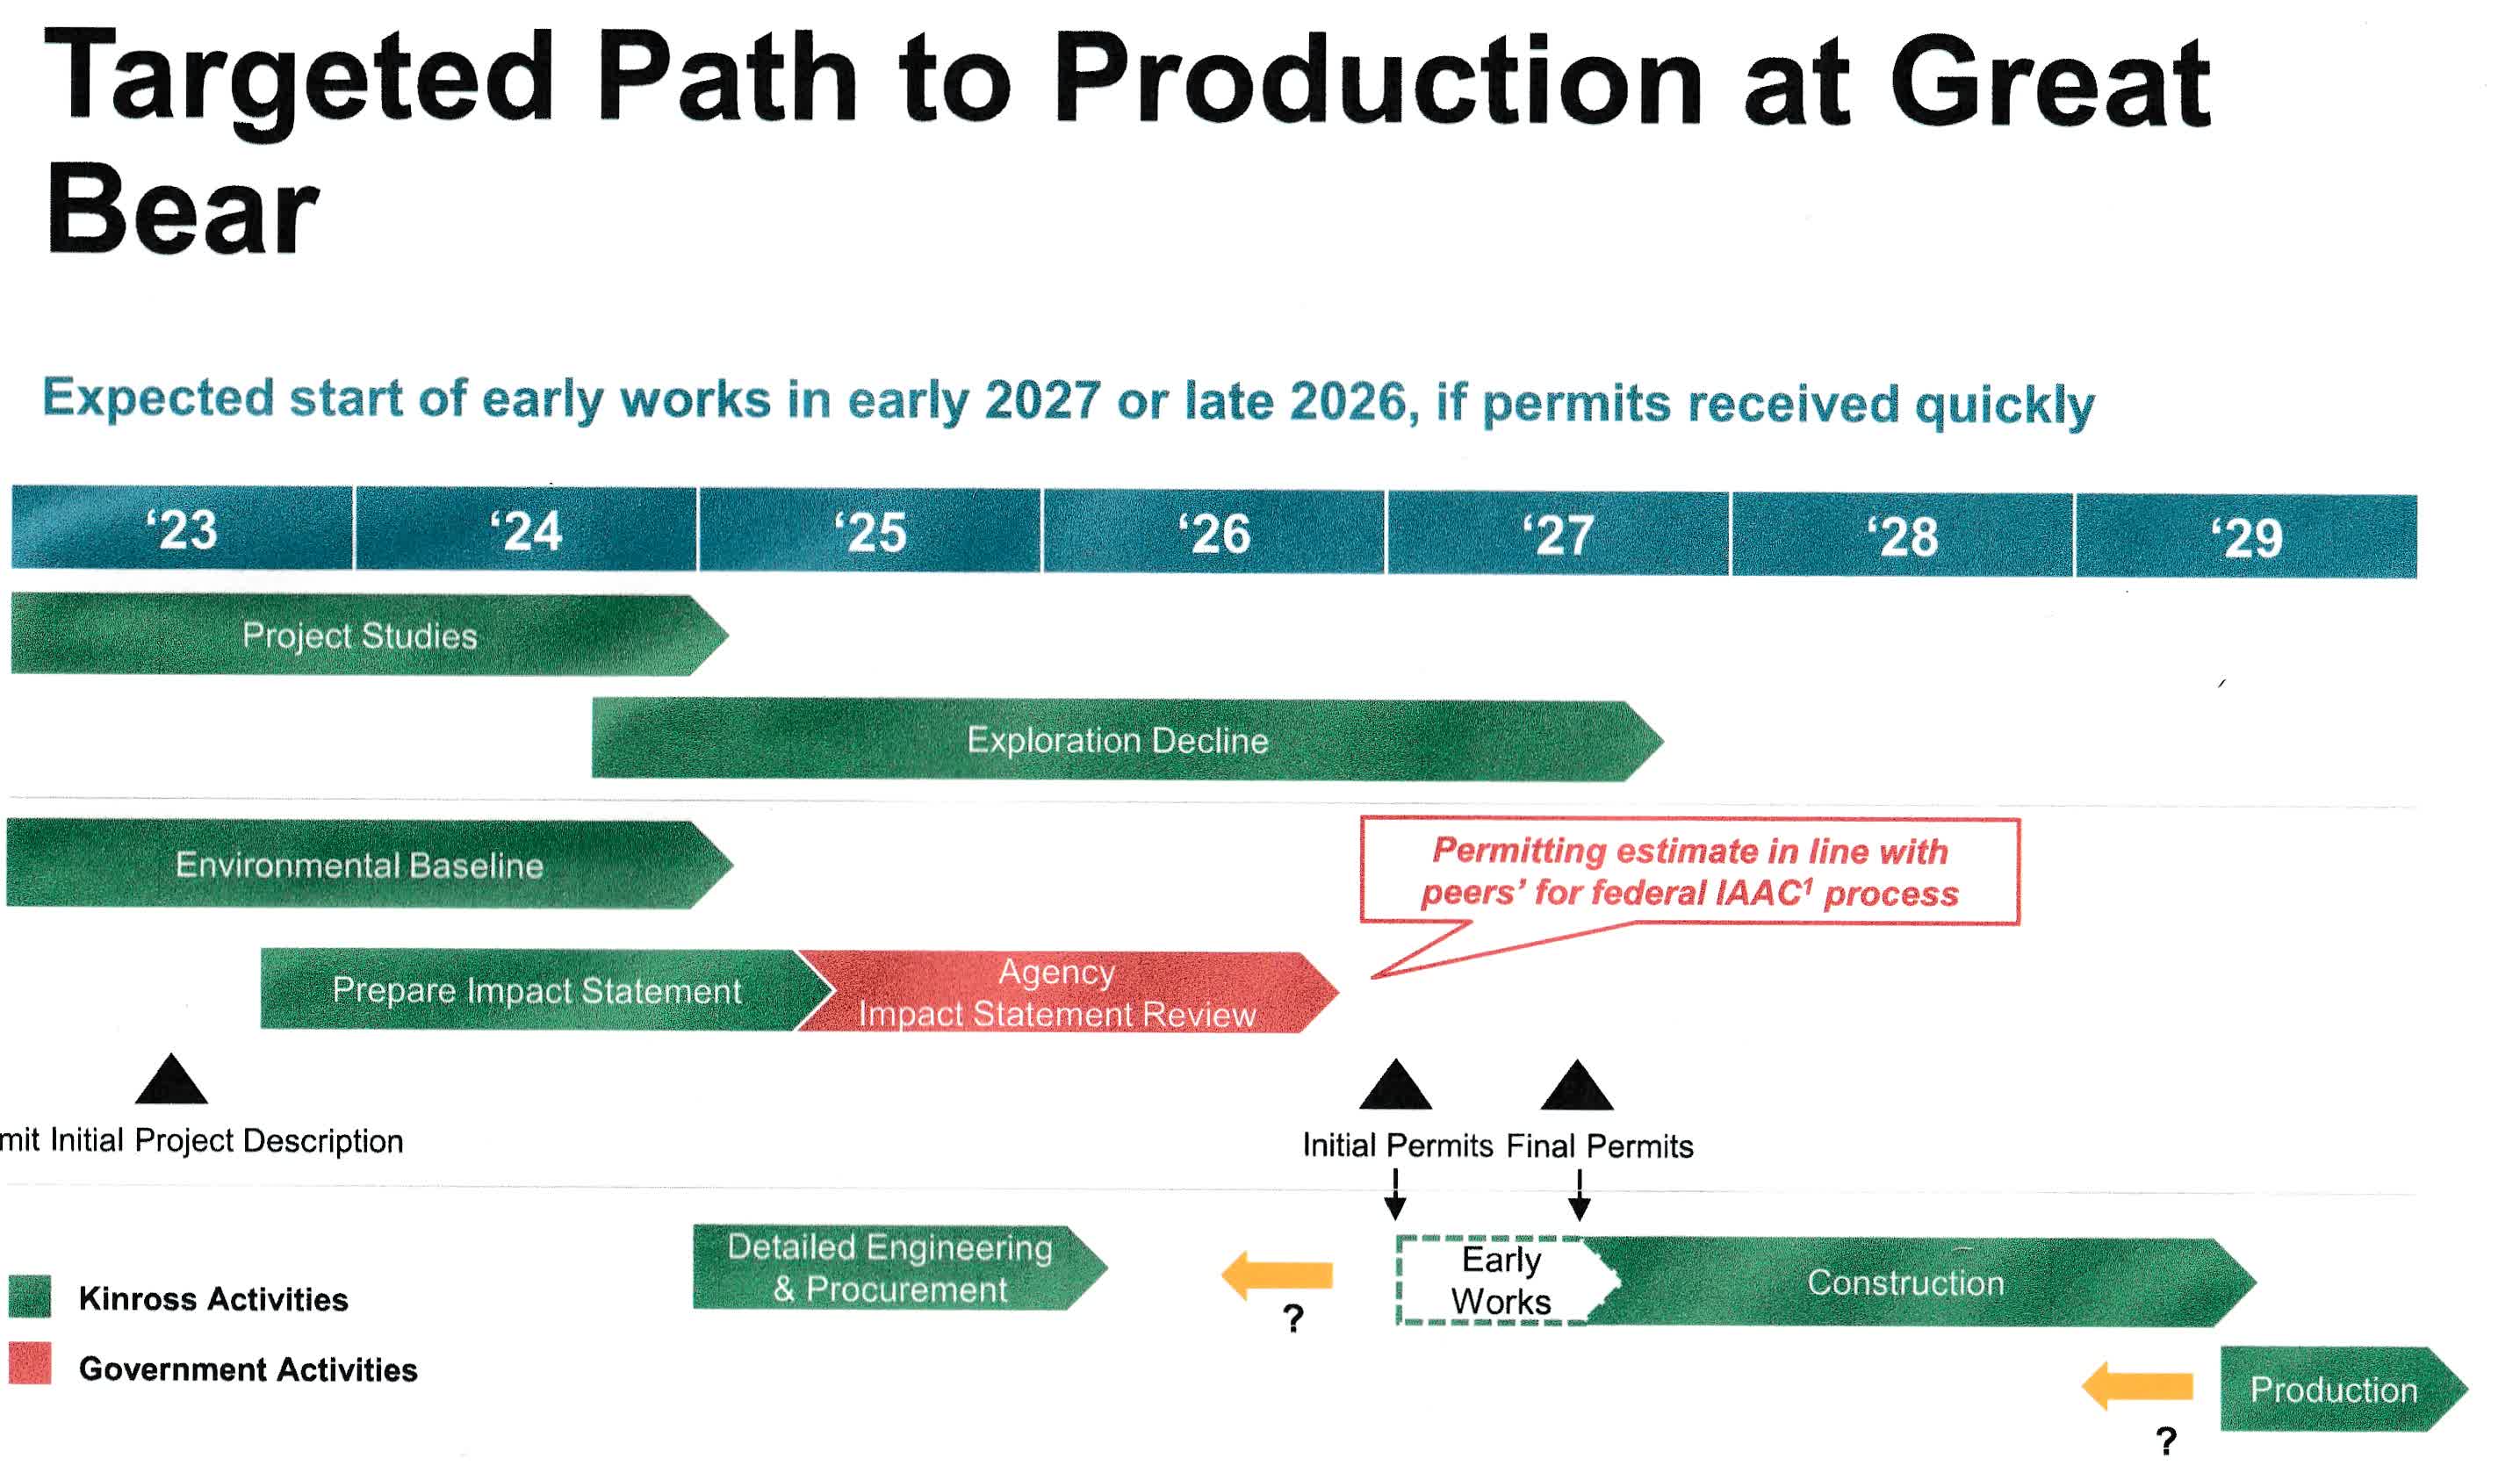
It is an excellent project with expected production in 2029.
KGC Great Bear Schedule (KGC Presentation)
1 - 1Q23 Result Snapshot
For the first quarter of 2023 , revenues were $929.3 million, with a net income of $90.2 million, or $0.07 per diluted share. The Adjusted net earnings were $87.6 million or $0.07. The company now expects to produce about 2.1 Moz in 2023.
Production in 1Q23 was 466,022 gold equivalent ounces (Au eq. oz.), a 23% year-over-year increase, and sales of 490,330 Au eq. Oz. The gold price realized was $1,894 per ounce sold, and AISC was $1,321 per ounce.
Cash and cash equivalents were $471.0 million, and total liquidity was approximately $1.7 billion at March 31, 2023.
Kinross' Board of Directors declared a quarterly dividend of $0.03 per common share payable on June 15, 2023, to shareholders of record at the close of business on June 1, 2023.
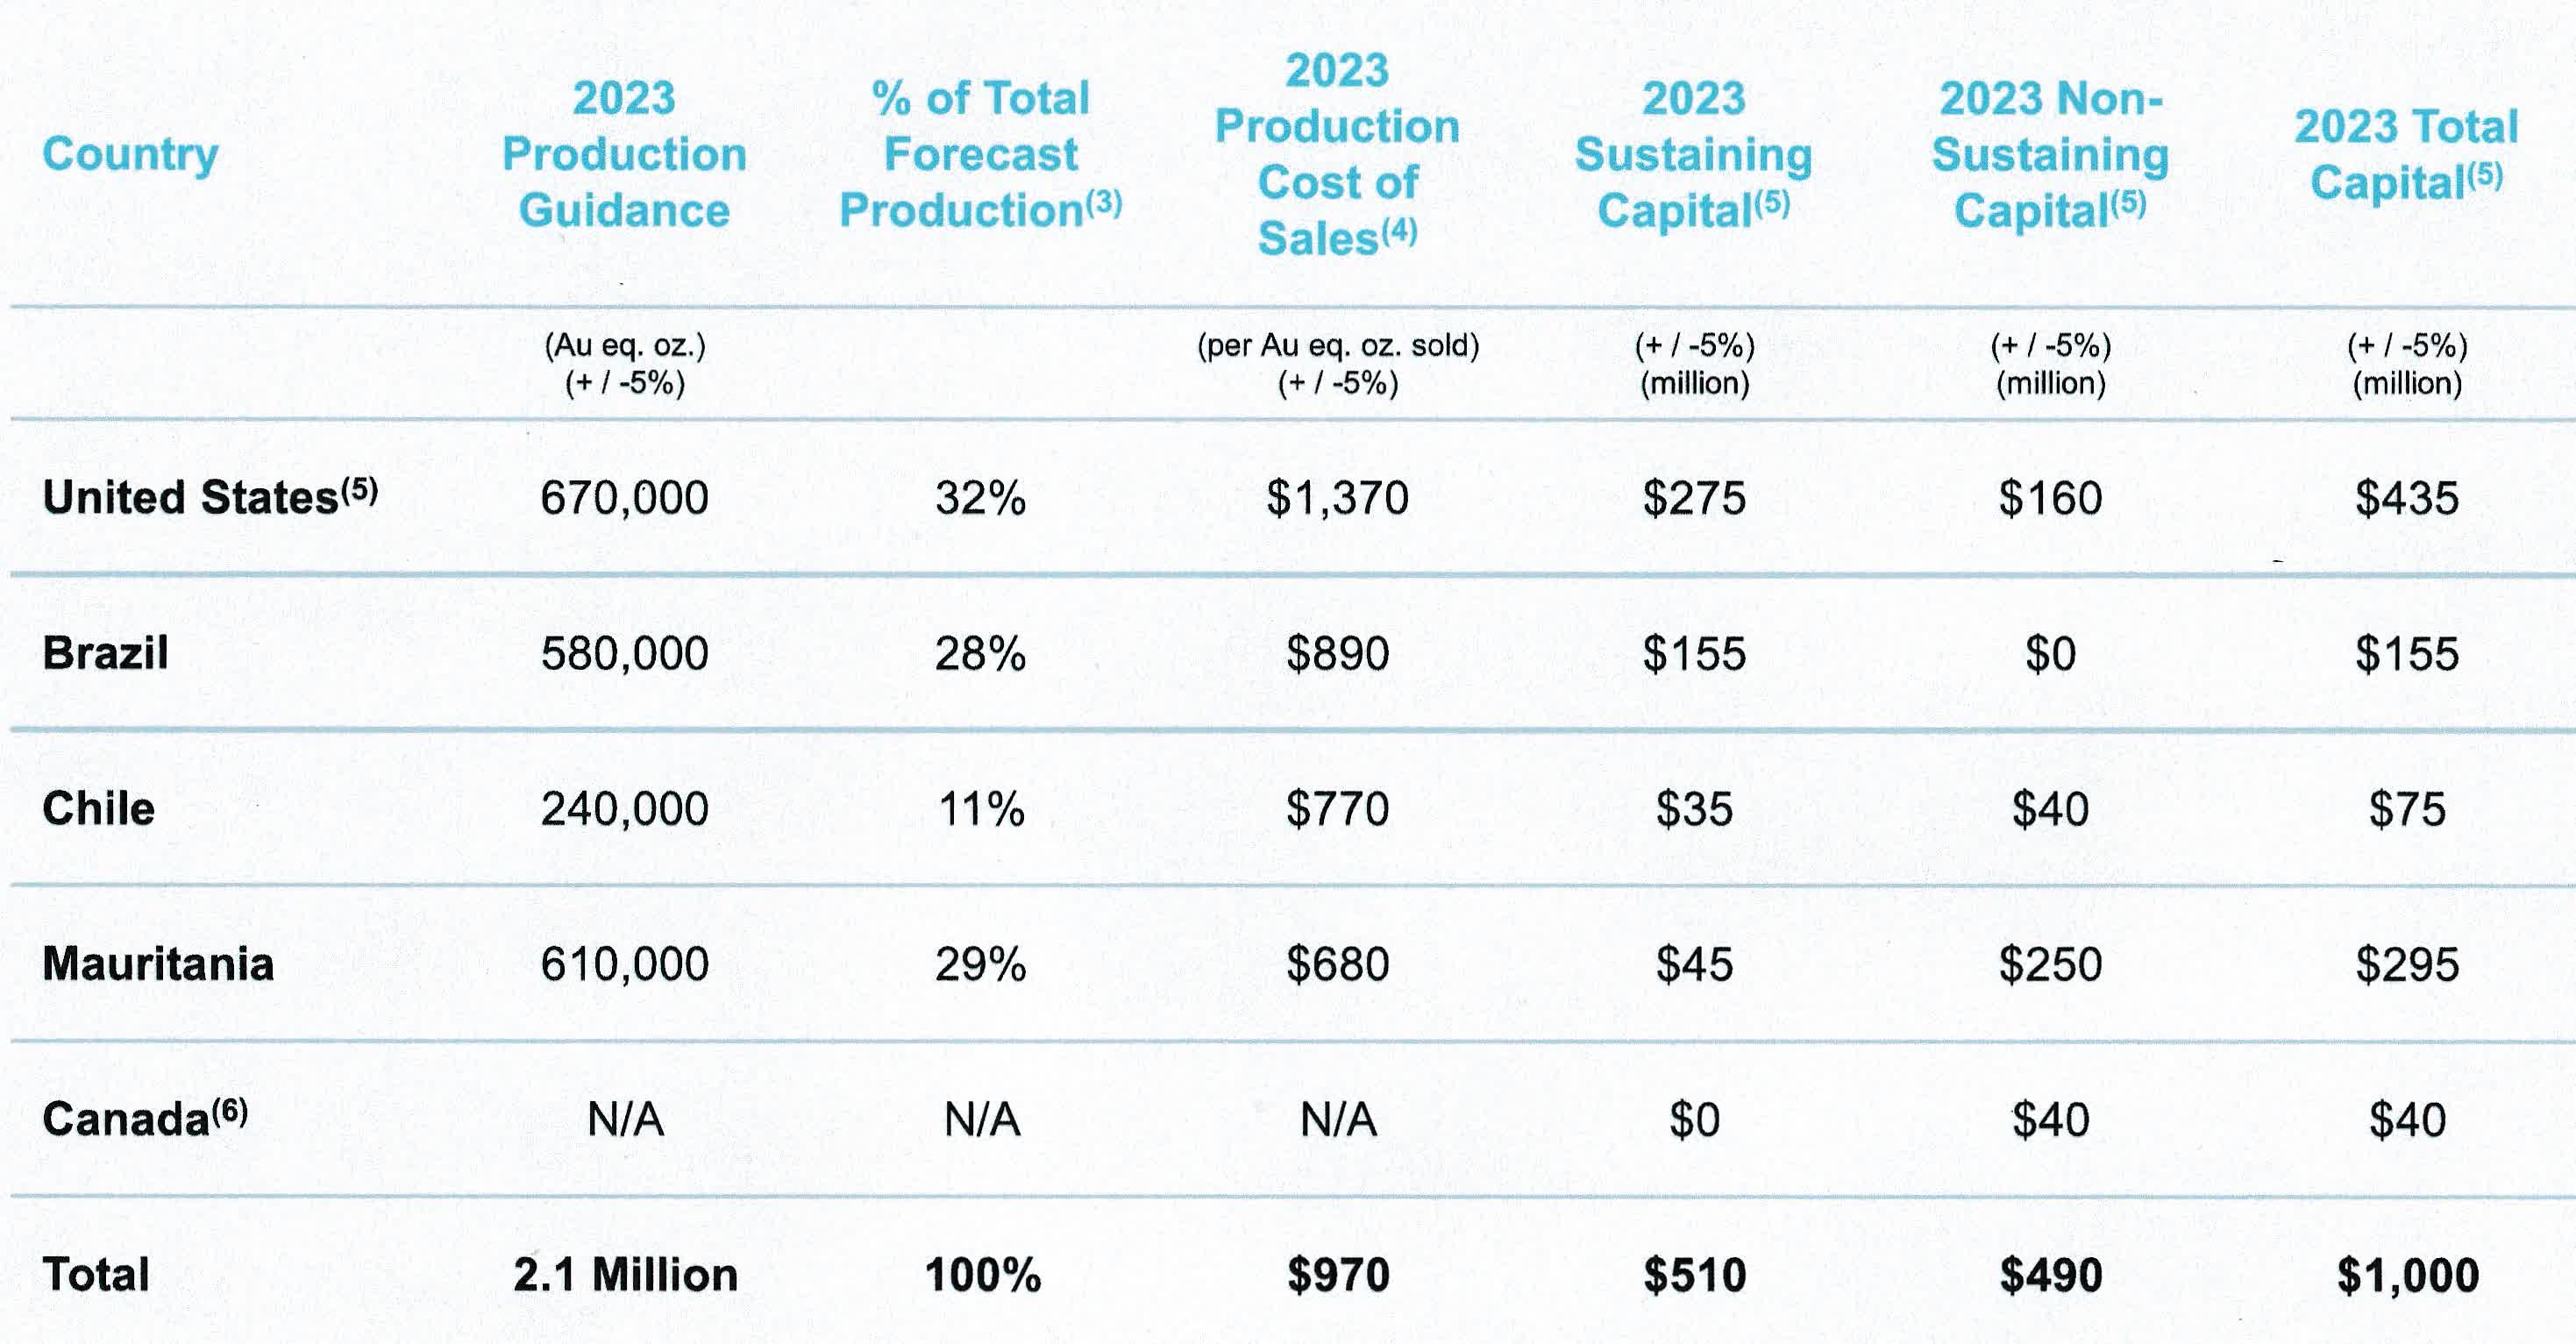
The Company expects its 2023 production to be approximately 2.1 million Au eq. Oz.
KGC 2023 Guidance (KGC Presentation)
J. Paul Rollinson, President and CEO, said in the conference call :
Our first quarter performance was on plan with all our operations performing well and production accounting for approximately 22% of our full year guidance. Worthy of note is that Tasiast, Paracatu, and La Coipa contributed approximately two-thirds of our production, with strong margins and cash flow, and all remain on track to achieve their full year targets. Following our strong first quarter results, we remain on track to achieve our 2.1million ounce production guidance for this year.
2 - Stock Performance
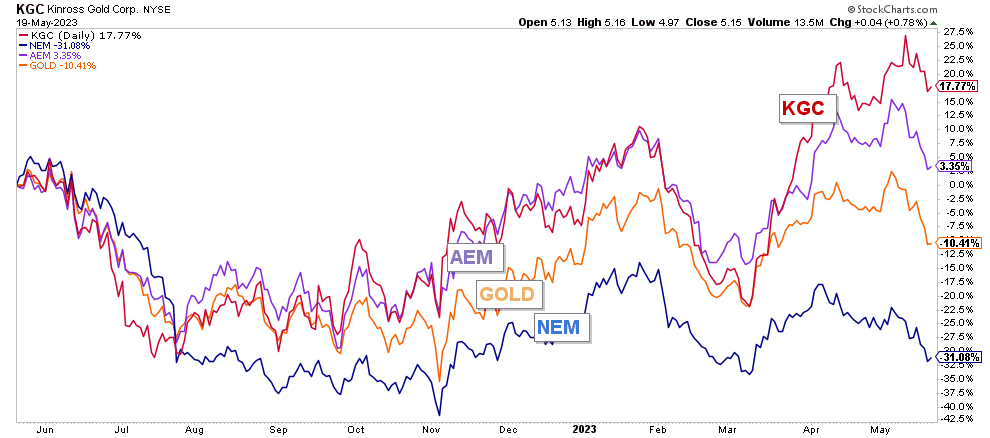
Kinross has outperformed Barrick Gold ( GOLD ), Newmont Corp. ( NEM ), and Agnico Eagle ( AEM ) on a one-year basis. KGC is now up 18% on a one-year basis.
KGC Stock performance (Fun Trading StockCharts)
Part II - Kinross Gold - Financials History 1Q23 - The Raw Numbers
| Kinross Gold |
| 1Q22 |
| 2Q22 |
| 3Q22 |
| 4Q22 |
| 1Q23 |
| Total Revenues in $ Million |
| 768.0 |
| 821.5 |
| 856.5 |
| 1,076.2 |
| 929.3 |
| Net Income in $ Million |
| -523.8 |
| -40.3 |
| 64.9 |
| -106.0 |
| 90.2 |
| EBITDA $ Million |
| 275.7 |
| 241.0 |
| 301.4 |
| 156.0 |
| 369.6 |
| EPS Diluted in $/share |
| -0.41 |
| -0.03 |
| 0.05 |
| -0.08 |
| 0.07 |
| Operating Cash Flow in $ Million |
| 196.6 |
| 207.9 |
| 171.6 |
| 474.3 |
| 259.0 |
| Capital Expenditure in $ Million |
| 117.3 |
| 155.0 |
| 217.8 |
| 323.8 |
| 259.5 |
| Free Cash Flow in $ Million |
| 79.3 |
| 52.9 |
| -46.2 |
| 150.5 |
| -0.5 |
| Total Cash $ Million |
| 454.2 |
| 719.1 |
| 488.4 |
| 418.1 |
| 471.0 |
| Long-Term Debt in $ Million |
| 2,729 |
| 2,610 |
| 2,512 |
| 2,593 |
| 2,694 |
| Shares Outstanding (diluted) in Million |
| 1,278 |
| 1,299 |
| 1,300 |
| 1,258 |
| 1,225 |
| Quarterly Dividend $/share |
| 0.03 |
| 0.03 |
| 0.03 |
| 0.03 |
| 0.03 |
Data Source: Company release and Fun Trading.
Note: Historical data from 2015 are available for subscribers only.
1 - Gold Production Details For The First Quarter 2023
1.1 Total attributable gold equivalent production
KGC Quarterly Gold Equivalent Production History (Fun Trading)
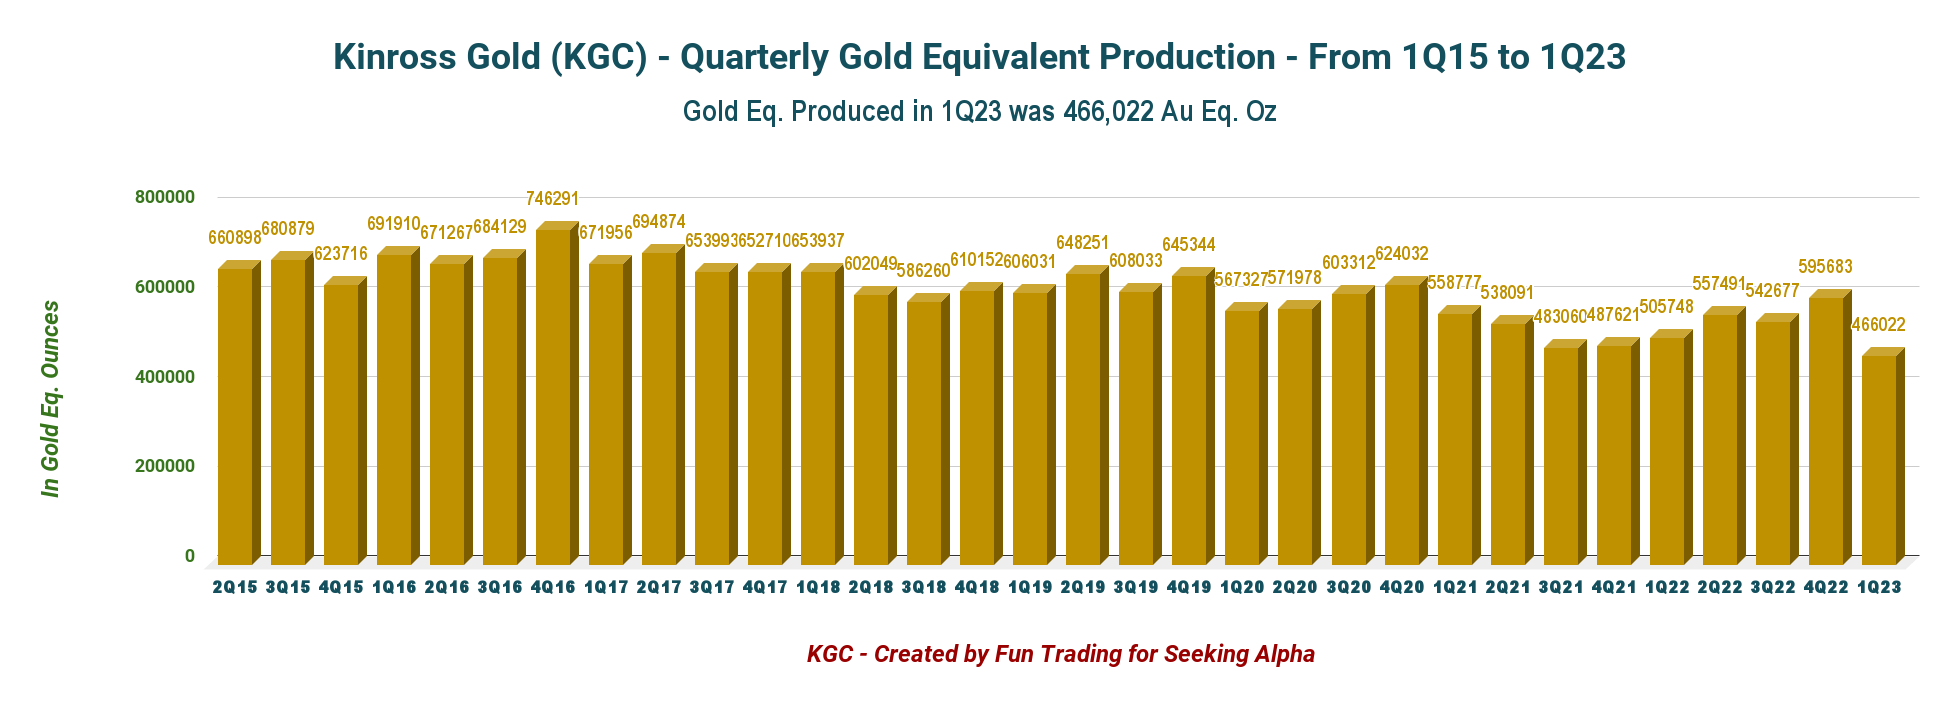
Kinross Gold equivalent produced 466,022 attributable GEO in 1Q23 compared with 505,748 GEO in 1Q22. Kinross Gold sold 490,330 GEOs in 1Q23.
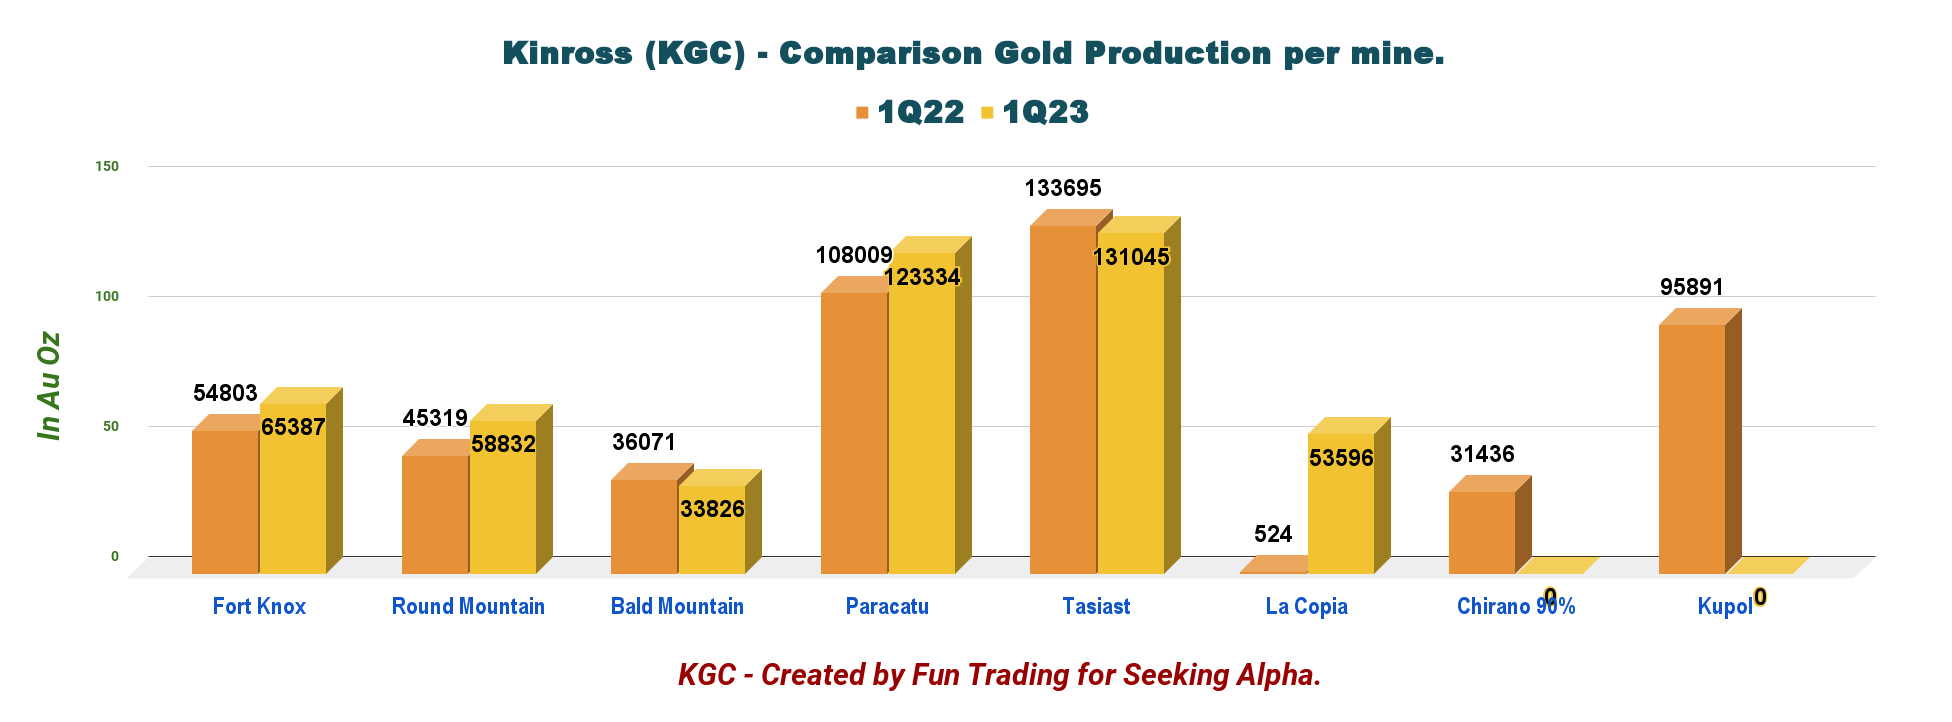
KGC 1Q22 versus 1Q23 Production per mine (Fun Trading)
- Tasiast achieved two record-production months in January and March, driven by record grades, and successfully completed a planned shutdown related to the Tasiast 24k expansion project in February.
- Paracatu mine had an excellent production.
- La Coipa reached record grades and recoveries since restarting operations last year and generated strong cash flow.
KGC 1Q22 Gold Production per mine (Fun Trading) KGC AISC per GEO and Gold Price Realized History (Fun Trading)
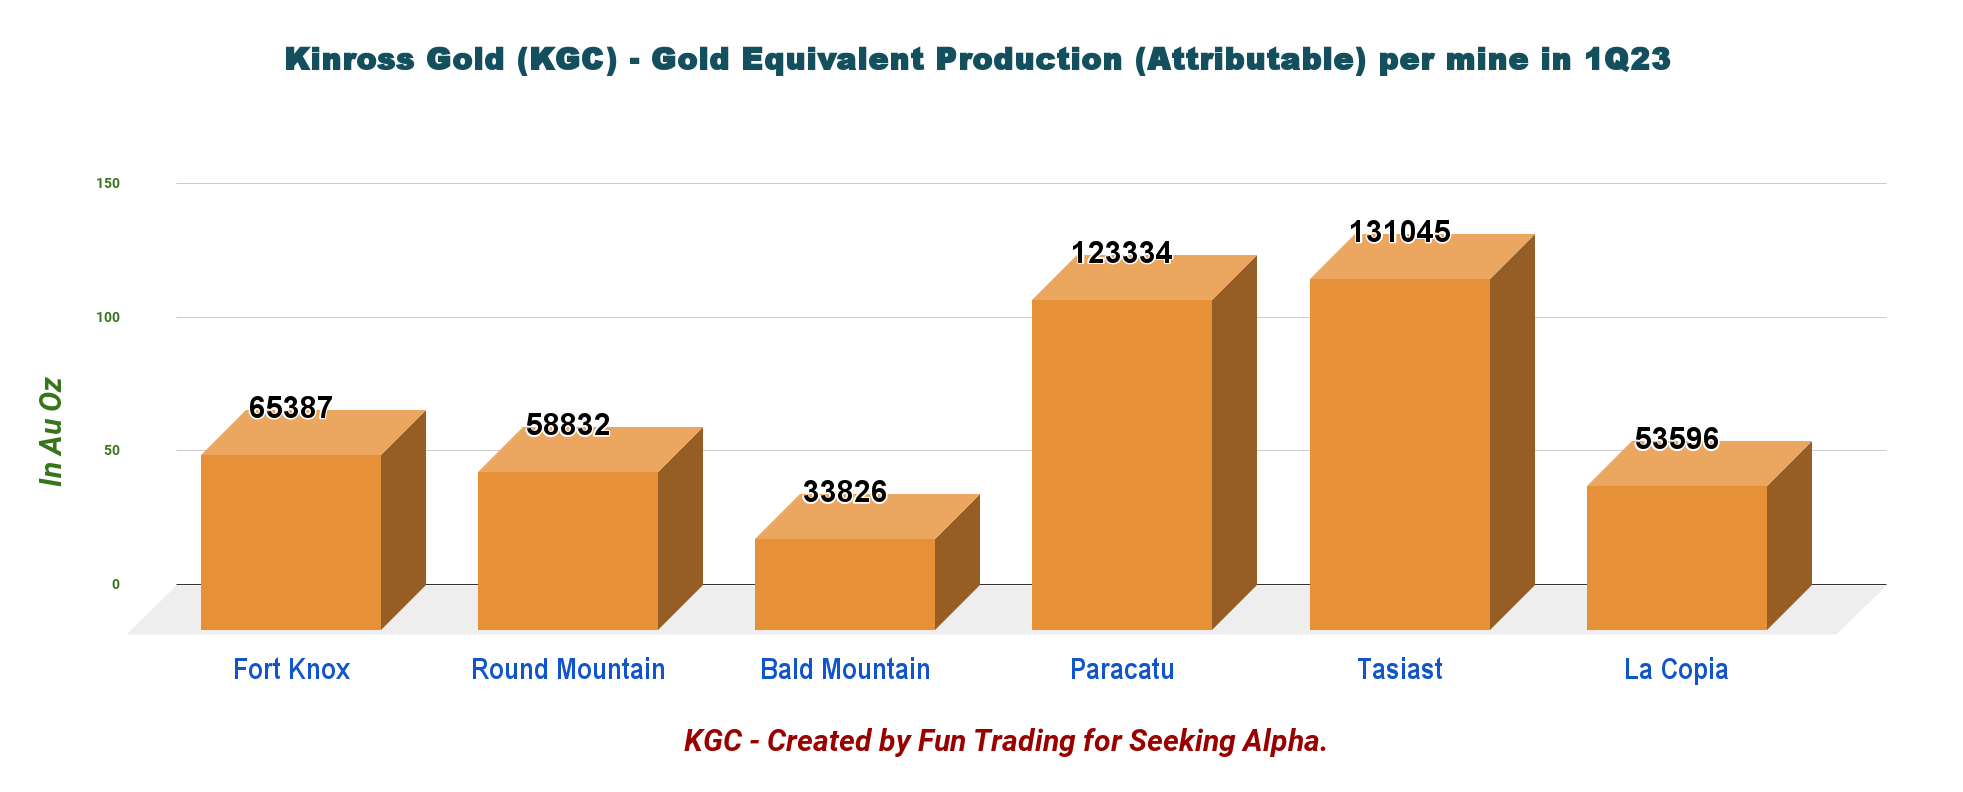
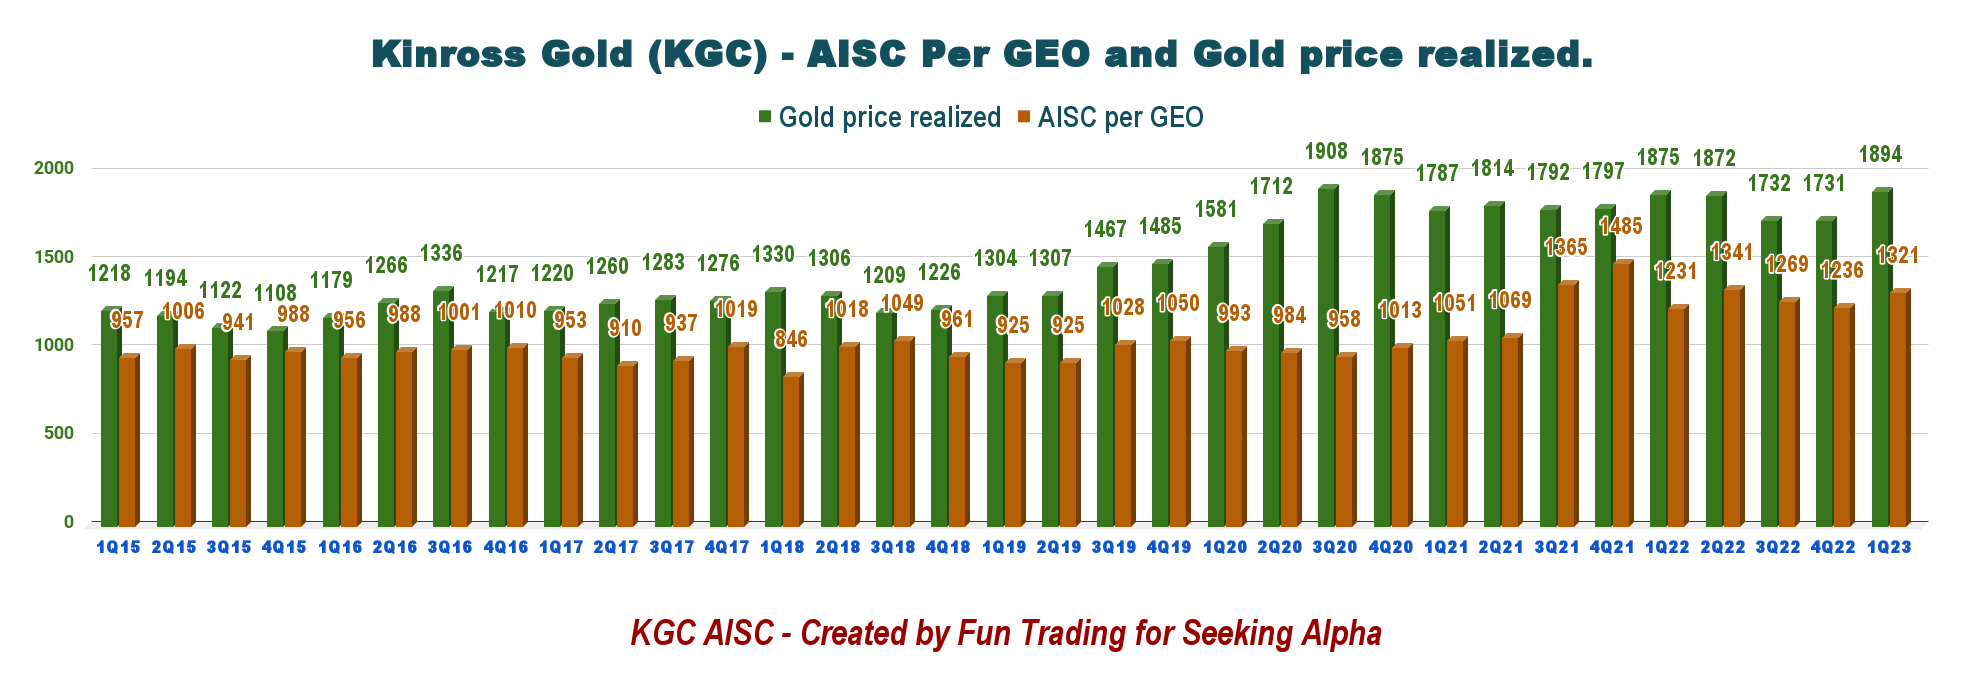
1.2 - Important Projects ongoing
1.2.1 Tasiast 24K
The Tasiast 24k project remains on budget and is scheduled to reach 24K tonnes per day throughput in mid-2023. On track to meet FY2023 production guidance of ~610koz .
CEO Paul Rollison said in the conference call:
Beginning with the Tasiast 24K expansion, in February, we successfully completed the plant shut down for tie-ins related to the front end of the plant. We have another shutdown scheduled in June, to continue the tie-ins around the back end of the plant. The project remains on schedule and is progressing well.
1.2.2 - Great Bear Project In Red Lake, Canada.
The exploration program at Great Bear in Red Lake, Ontario, continues to make excellent progress.
CEO Paul Rollison said in the conference call:
At Great Bear we completed almost 40,000 meters of drilling largely focused on exploring and ultimately expanding our underground resource. As predicted, we continue to hit high grade mineralization with large widths in several areas to a depth of 1.3 kilometers, confirming our thesis that this orebody continues well below the open pit.
Studies, permitting plans and project staffing initiatives are progressing well. And we remain excited about unlocking the tremendous potential this project offers over the coming quarters.
1.2.3 - Manh Choh got the green light
On July 27, 2022, the Company, as the joint venture operator, announced that it would proceed with developing the 70%-owned Manh Choh project in Alaska.
The project is expected to increase the Company's production profile in Alaska by approximately 640K attributable to Au eq. Oz. over the life of mine at lower costs.
Initial production from Manh Choh is expected in the second half of 2024.
2 - Kinross Gold: Financial Analysis
2.1 - Revenues were $929.3 million in 1Q23
KGC Quarterly Revenue History (Fun Trading)
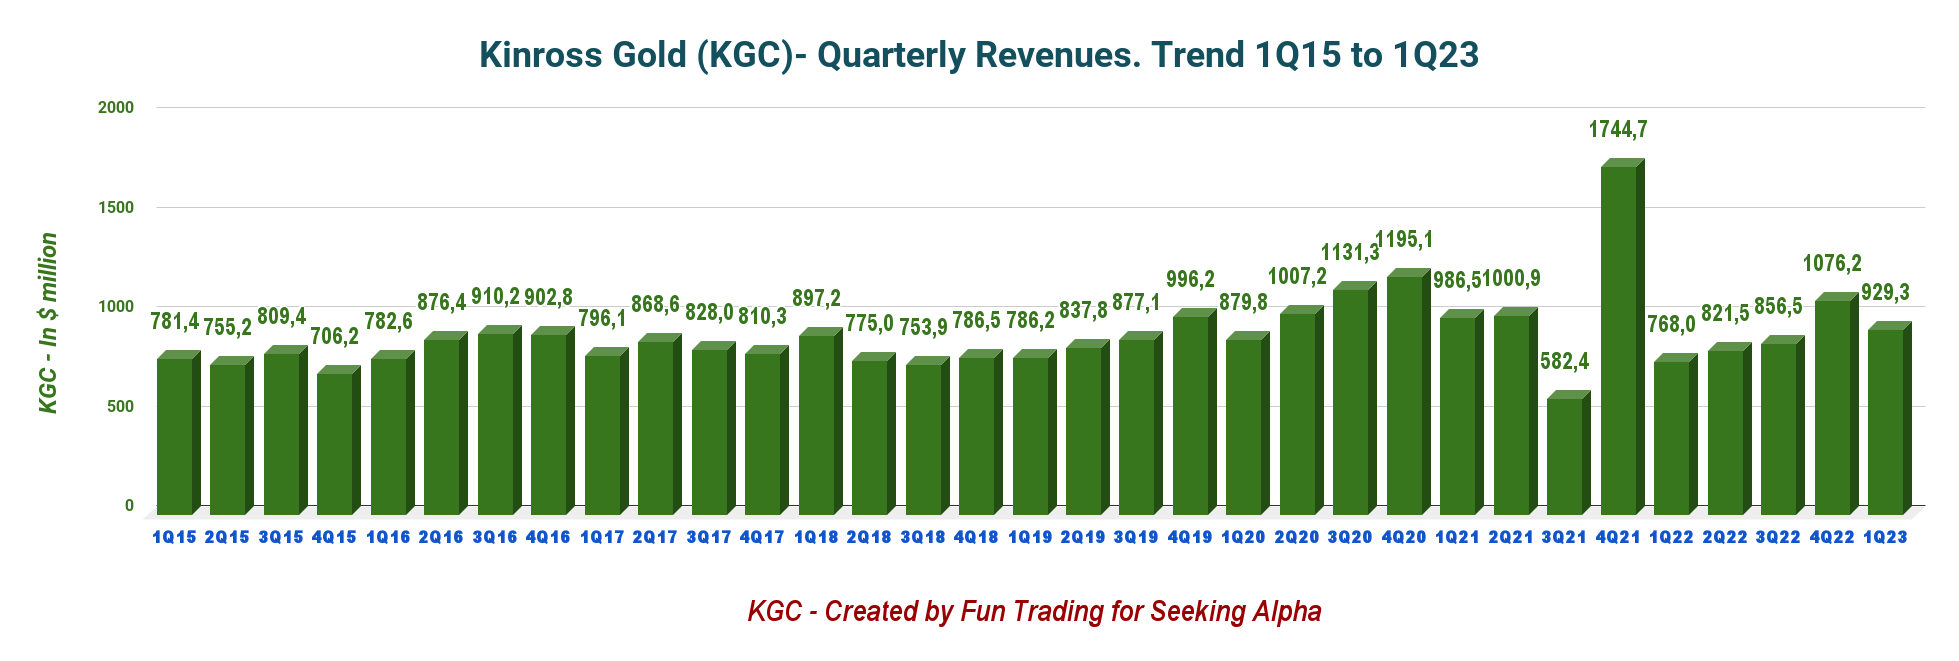
Note: Previous quarters were restated.
KGC posted an income of $90.2 million or $0.07 per diluted share in the first quarter of 2023, compared to a loss of $523.8 million or $0.41 per diluted share in the same quarter last year.
The adjusted net earnings were $87.6 million or $0.07 per share for 1Q23.
Revenues from continuing operations in 1Q23 were up 32.6% year-over-year to $929.3 million.
The production cost of sales from continuing operations per Au eq. Oz. sold increased to $987 this quarter.
2.2 - Free Cash Flow was a loss of $0.5 million in 1Q23
KGC Quarterly Free Cash Flow History (Fun Trading)
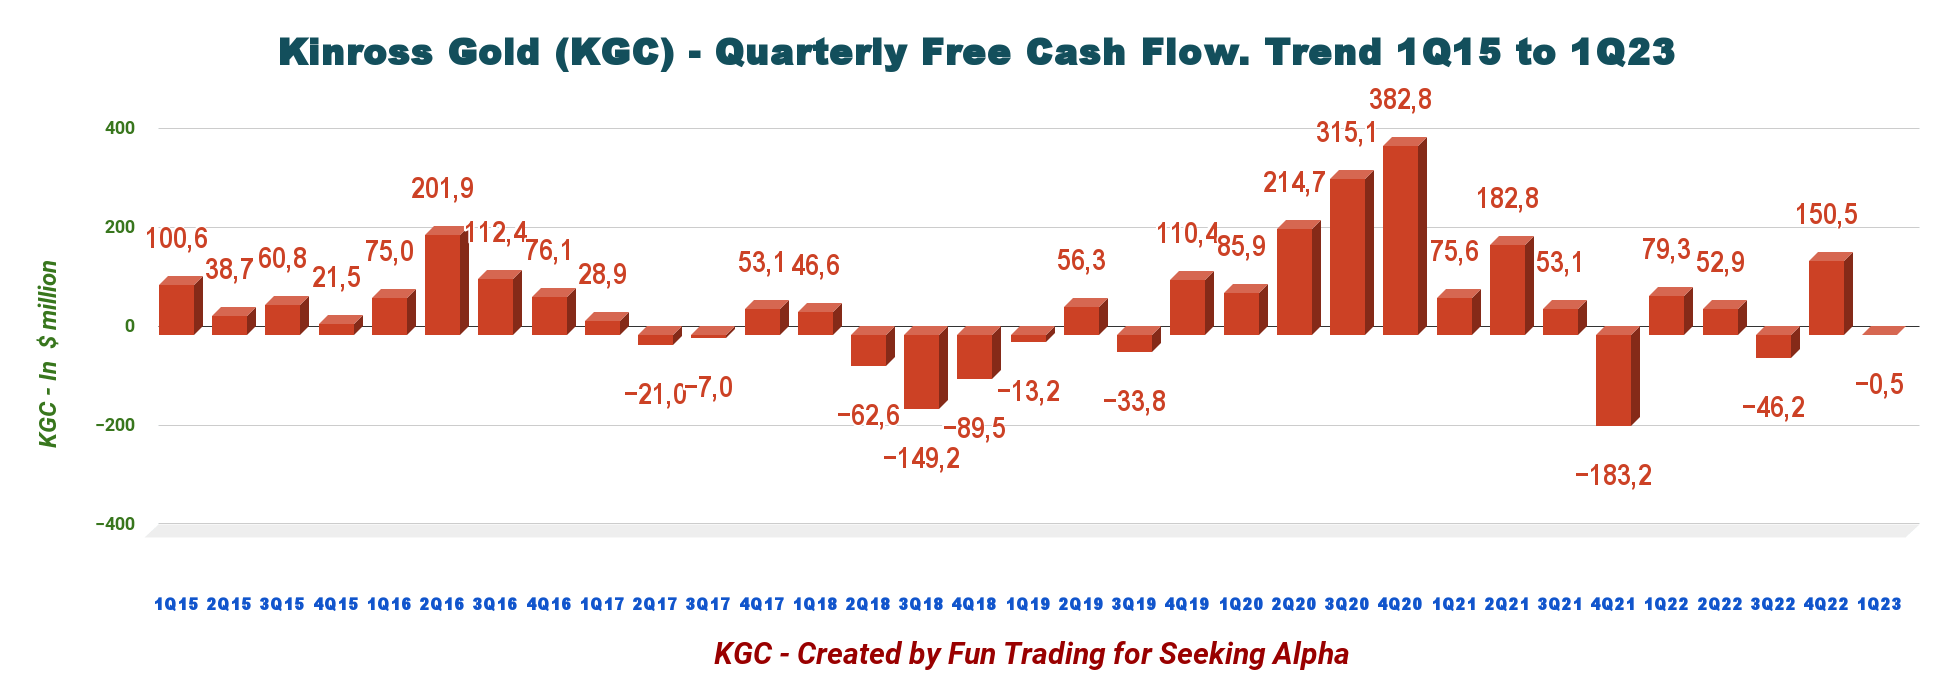
Note: Generic free cash flow is the cash from operations minus CapEx.
Trailing 12-month free cash flow is a loss of $156.7 million . The Company had a free cash flow loss of $0.5 million in 1Q23 .
The Company pays a quarterly dividend of $0.03 per share or a yield of 2.33%.
2.3 - Net debt and liquidity
The net debt dropped sequentially to $2,694.2 million in 1Q23, down slightly from 1Q22 ($2,728.8 million).
The Company had cash and cash equivalents of $471.0 million, with total liquidity of approximately $1.7 billion, on March 31, 2023.
KGC Quarterly Cash versus Debt History (Fun Trading) KGC Debt Profile (KGC Presentation)
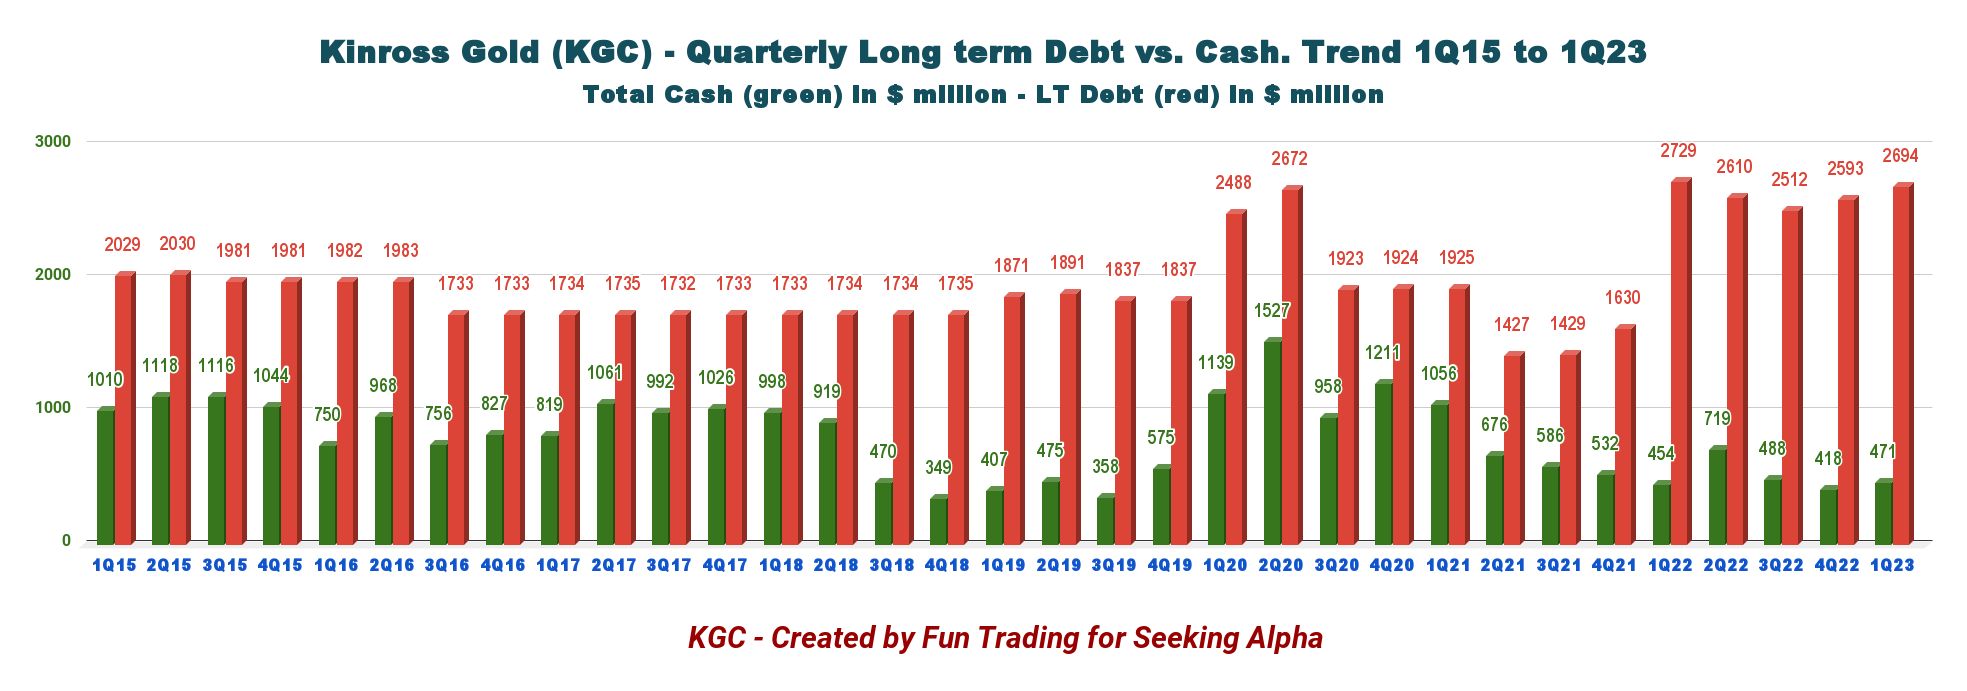
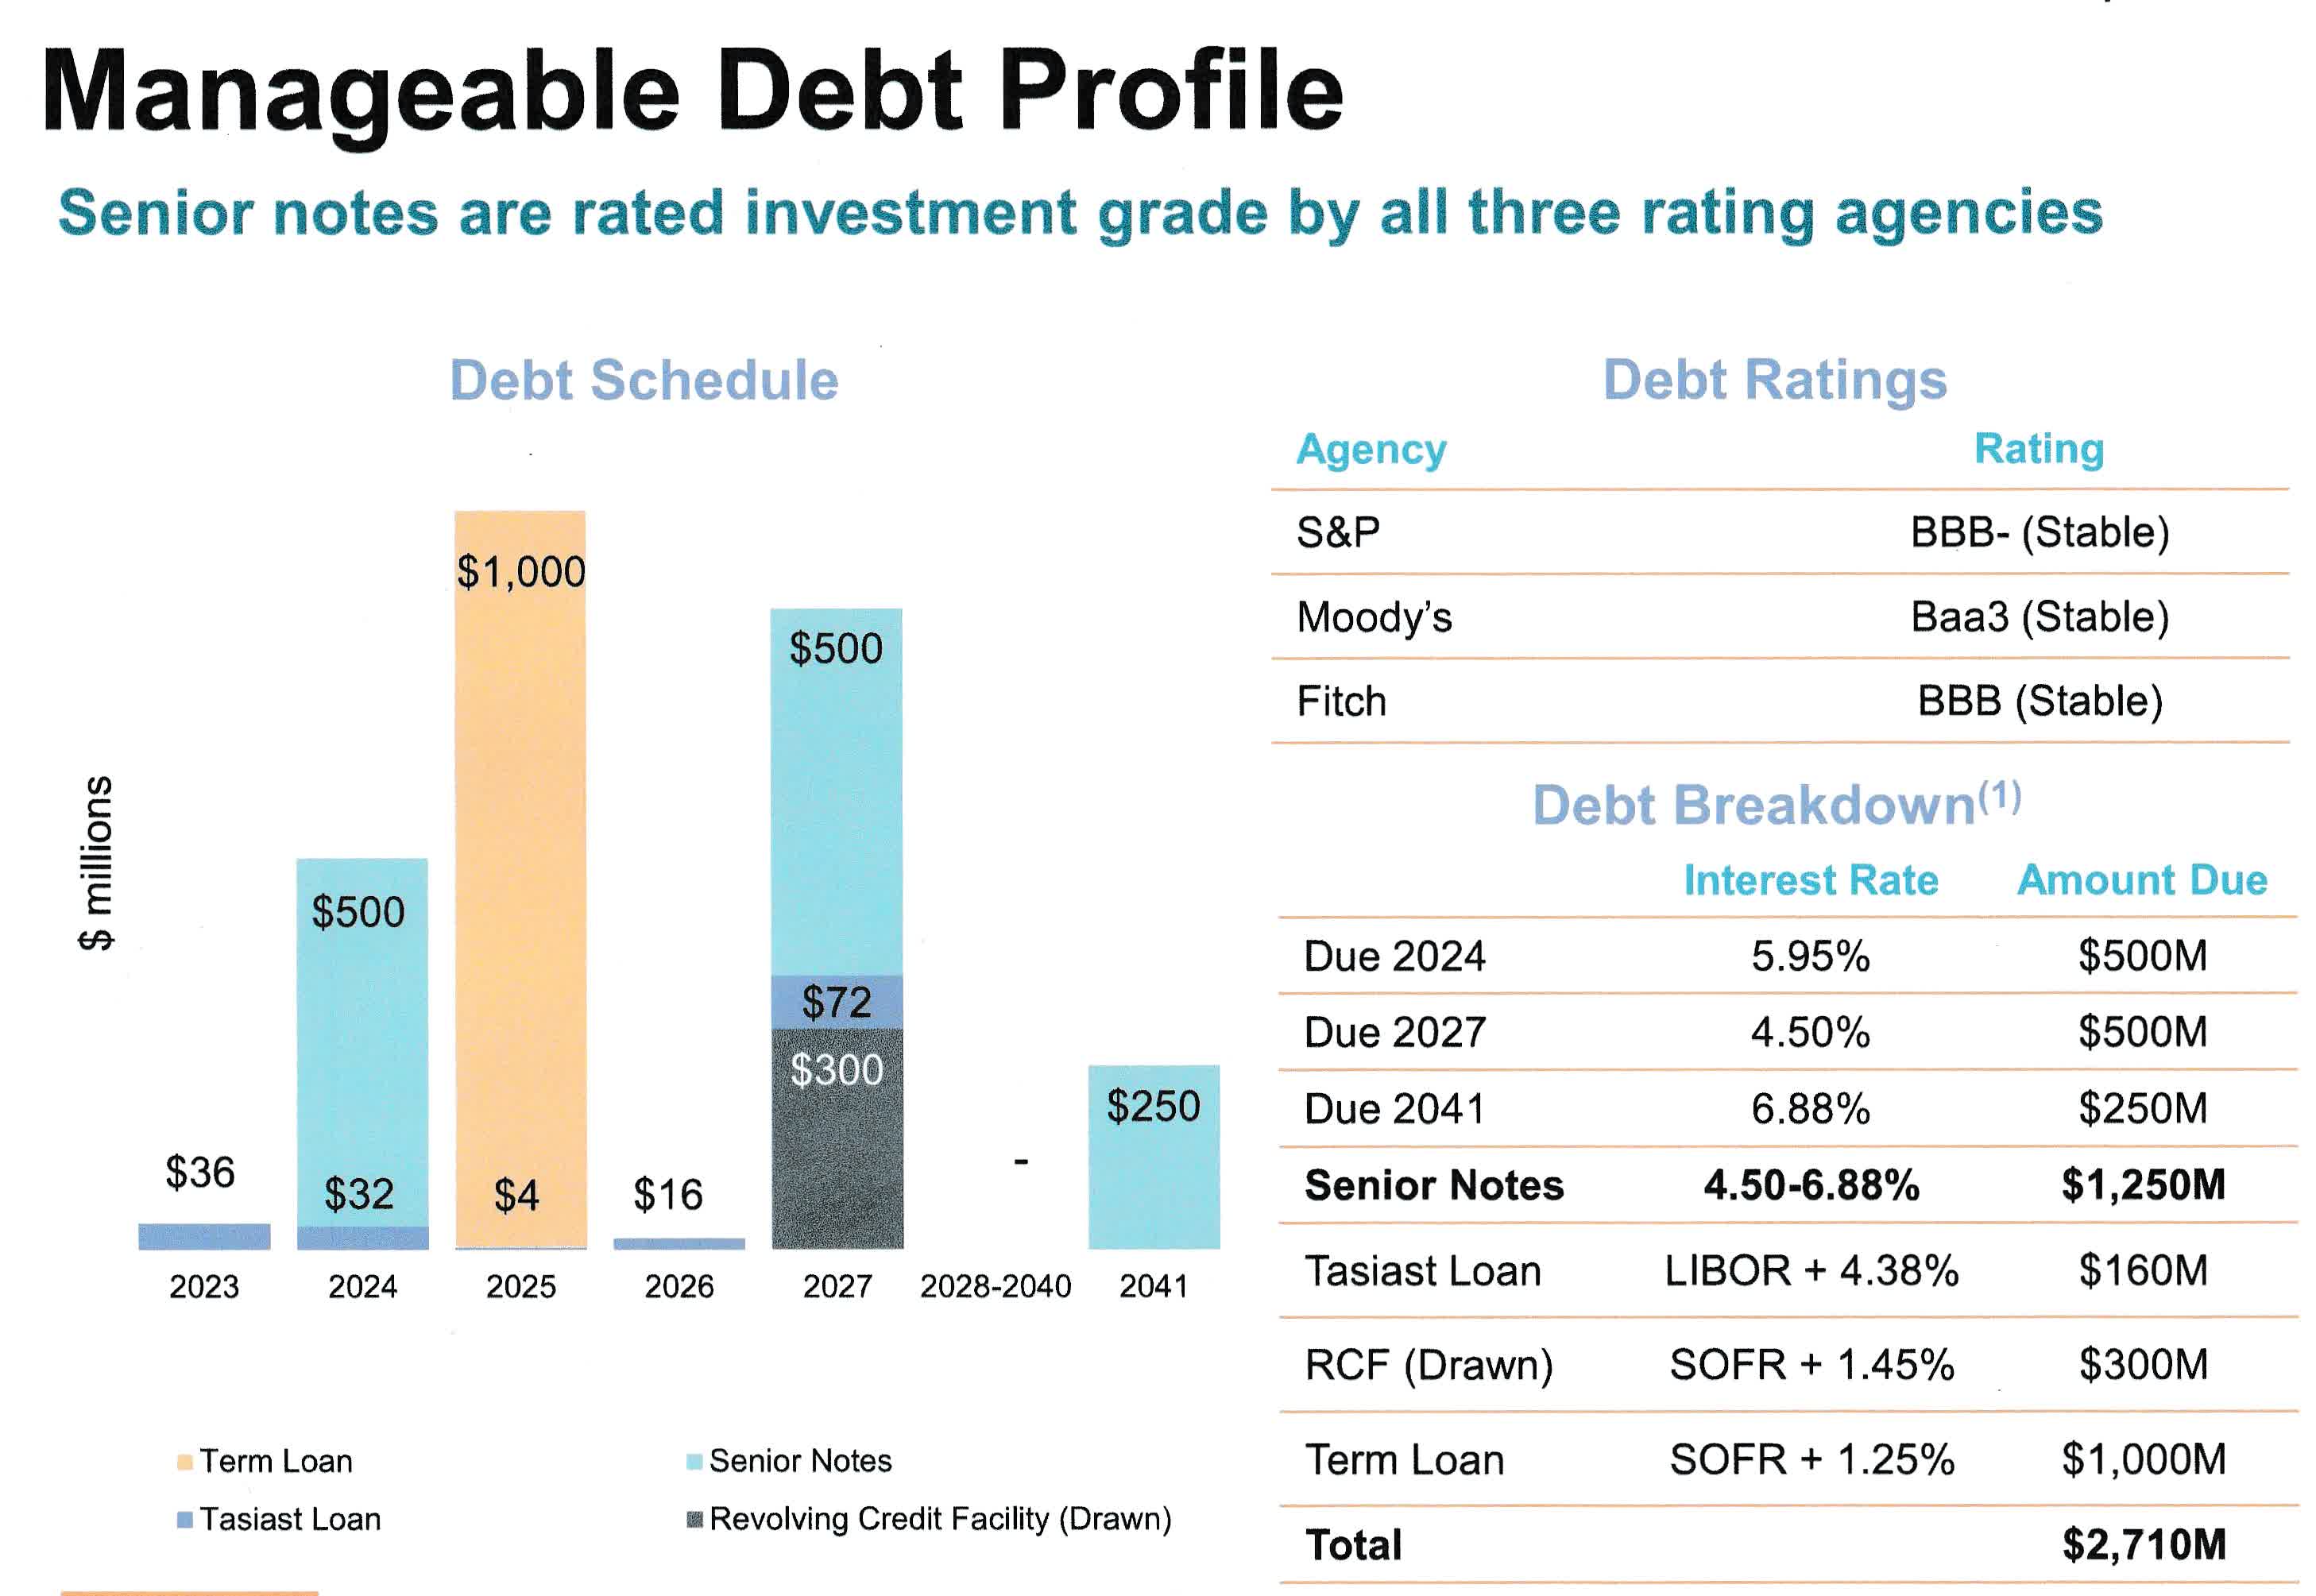
On March 31, 2023, the liquidity position was $1.7 billion.
Part III - Technical Analysis and Commentary
KGC TA Chart short-term (Fun Trading StockCharts)
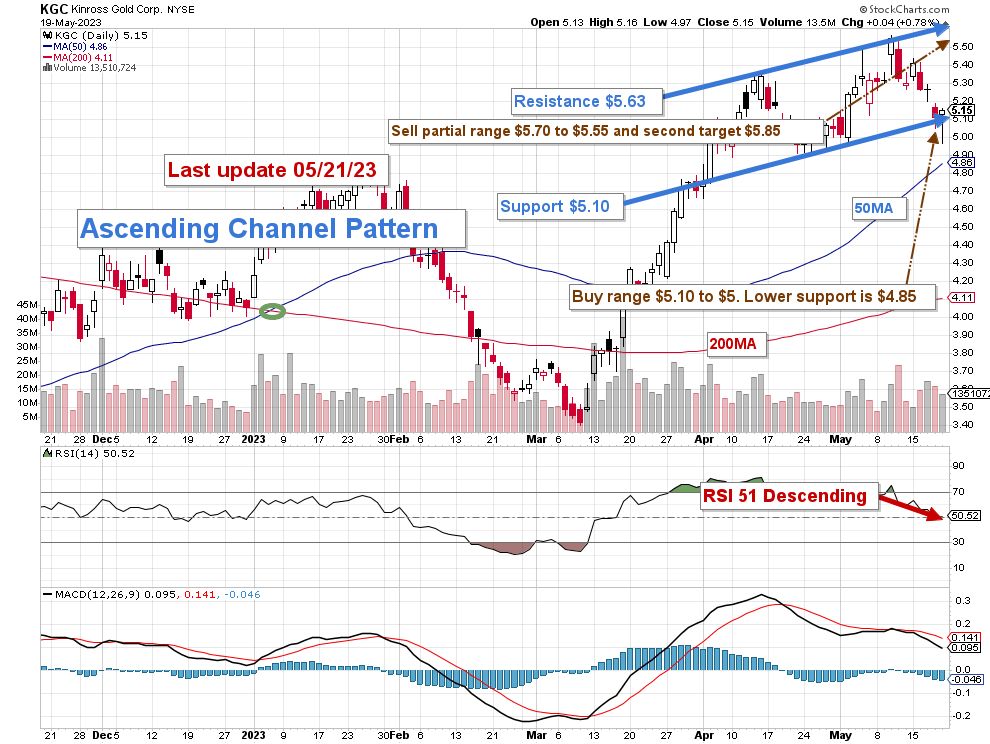
Note: the chart is adjusted for the dividend.
KGC forms an ascending channel pattern with resistance at $5.63 and support at $5.10.
Ascending channel patterns or rising channels are short-term bullish in that a stock moves higher within an ascending channel, but these patterns often form within longer-term downtrends as continuation patterns. The ascending channel pattern is often followed by lower prices, but only after a downside penetration of the lower trend line.
I recommend trading short-term LIFO at about 50% and keeping a core long-term position for a final target of $7. I encourage this basic strategy in my marketplace, "The Gold and Oil Corner."
I suggest selling about 50% of your position between $5.55 and $5.70 with possible upper resistance at $5.85 and buying KGC between $5.10 and $5 with possible lower support at $4.85.
Trading LIFO lets you keep your old position, which is generally underwater in the KGC case, and trade your most recent position for gain without selling your long position at an unnecessary loss. Repeating this exercise can provide a solid income that helps you de-risk your long-term position.
Warning: The TA chart must be updated frequently to be relevant. It is what I am doing in my stock tracker. The chart above has a possible validity of about a week. Remember, the TA chart is a tool only to help you adopt the right strategy. It is not a way to foresee the future. No one and nothing can.
For further details see:
Kinross Gold: Expecting Solid Production In 2023