CA - Kinross Gold: Impressive Results This Quarter
2023-11-21 15:00:00 ET
Summary
- Kinross Gold Corporation's 3Q23 results show increased production and revenue compared to the previous year.
- The company is on track to meet its 2023 production guidance and has a solid balance sheet.
- Kinross Gold has outperformed competitors, with a 25% increase in one year.
Introduction
Toronto-based Kinross Gold Corporation (NYSE: KGC ) released its third quarter 2023 results on November 8, 2023. I have regularly followed KGC quarterly since 2015. This new article is a quarterly update of my article published on September 13, 2023.
I believe Kinross Gold currently satisfies all requirements for "merger potential," and before digging into the balance sheet details, I would like to comment on this speculative idea.
As stated in the previous quarter, the company could receive an offer by 2024. However, it is just an assumption on my part, and I caution the reader that we can't take it at face value.
Taking into account the way the gold market has consolidated in recent years, this possible outcome is gaining more credibility. Several noteworthy purchases jumped to mind. A few of the deals that have been completed or are soon to be completed are Agnico Eagle and Pan American Silver purchasing Yamana Gold's assets, Agnico Eagle joining forces with Kirkland Lake Gold, and Newmont purchasing Newcrest.
Kinross Gold has the right profile and is an ideal candidate due to its size and asset locations, as well as the potential growth associated with its two advanced projects with near-term production potential.
The only problem I can think of right now is that the Tasiast mine is situated in Mauritania, West Africa, which isn't thought to be a safe place for the mining sector.
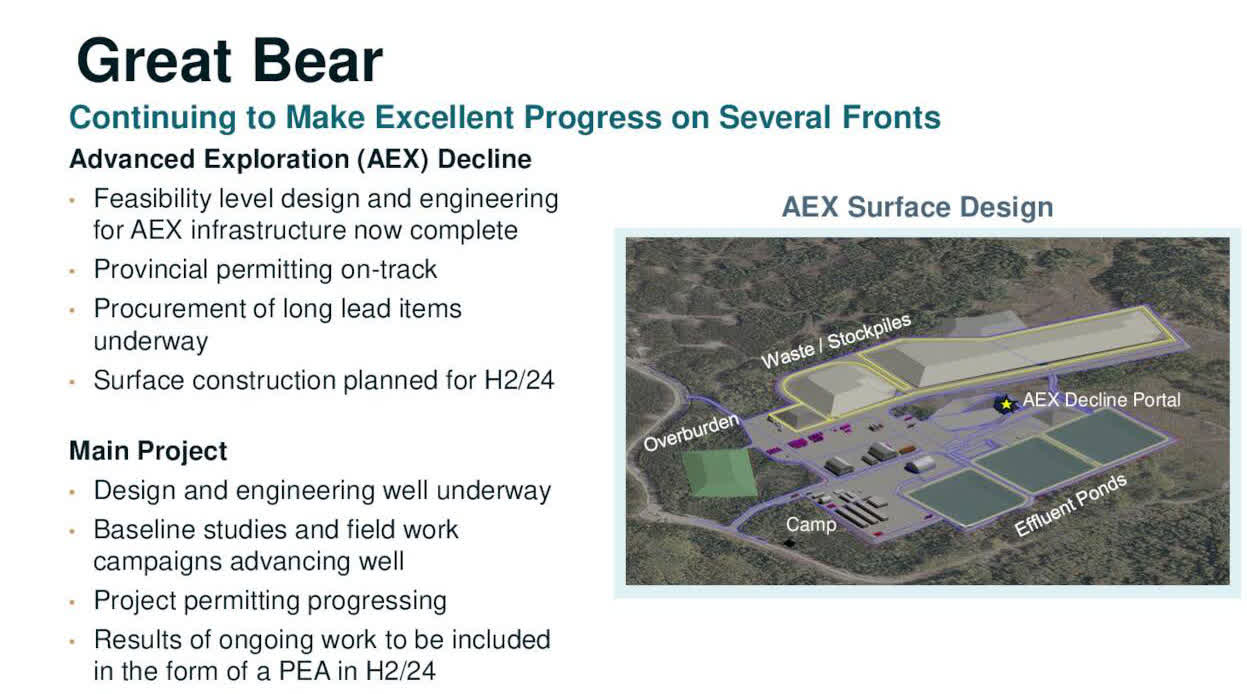
The Great Bear in Canada is expected to be completed in 2029, and the smaller Manh Choh project in Alaska (of which Kinross is the operator) is scheduled to begin production in the second half of 2024. The company indicated that the Fort Knox mill, which has been adapted to process the new ore, will process the Manh Choh ore.
KGC Great Bear Project (KGC Presentation)
Therefore, it could be a good idea to accumulate KGC on weakness based on this eventual outcome.
2: 3Q23 Results Snapshot and Commentary
2.1: Revenue
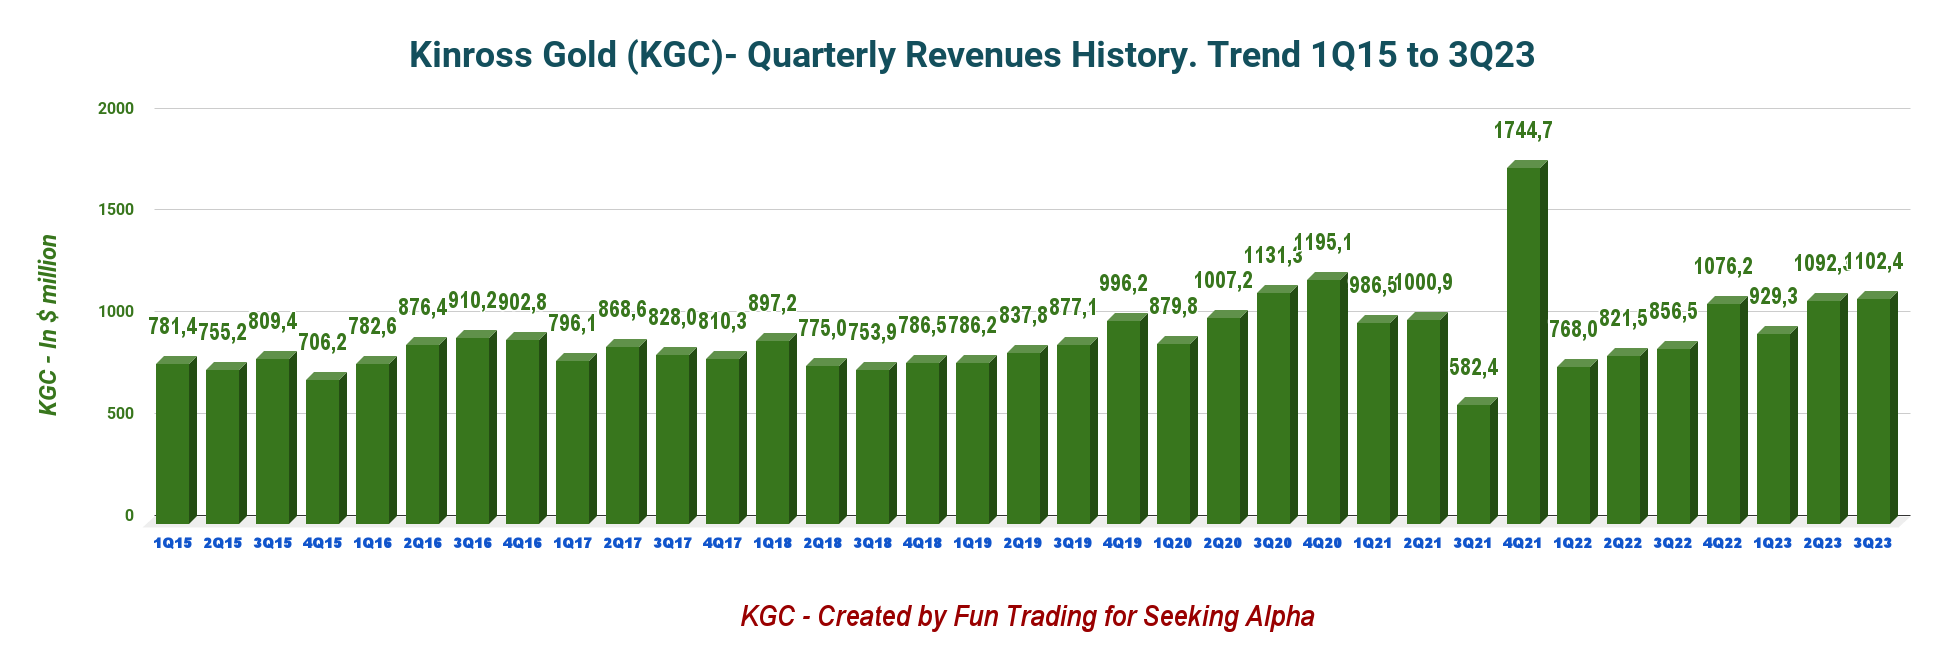
Revenues for 2023's third quarter came in at $1,102.4 million compared with $856.5 million during 3Q22, and net income came in at $109.7 million, or $0.09 per diluted share. The adjusted net earnings were $144.6 million, or $0.12 per share. The results exceeded analysts' expectations.
KGC Quarterly Revenue History (Fun Trading)
Revenues rose an impressive 28.7% year over year and were up nearly 1% QoQ. The increase is due to higher average realized gold prices and higher sales of gold equivalent ounces. As previously mentioned, Tasiast and Paracatu, the company's largest two mines, achieved record performance levels.
Operating cash flow from ongoing activities increased from $171.6 million to $406.8 million in the third quarter of 2023. While this represents great progress, it was slightly countered by an increase in capital expenditures from $217.8 million to $326.9 million in the prior year.
2.2: Production
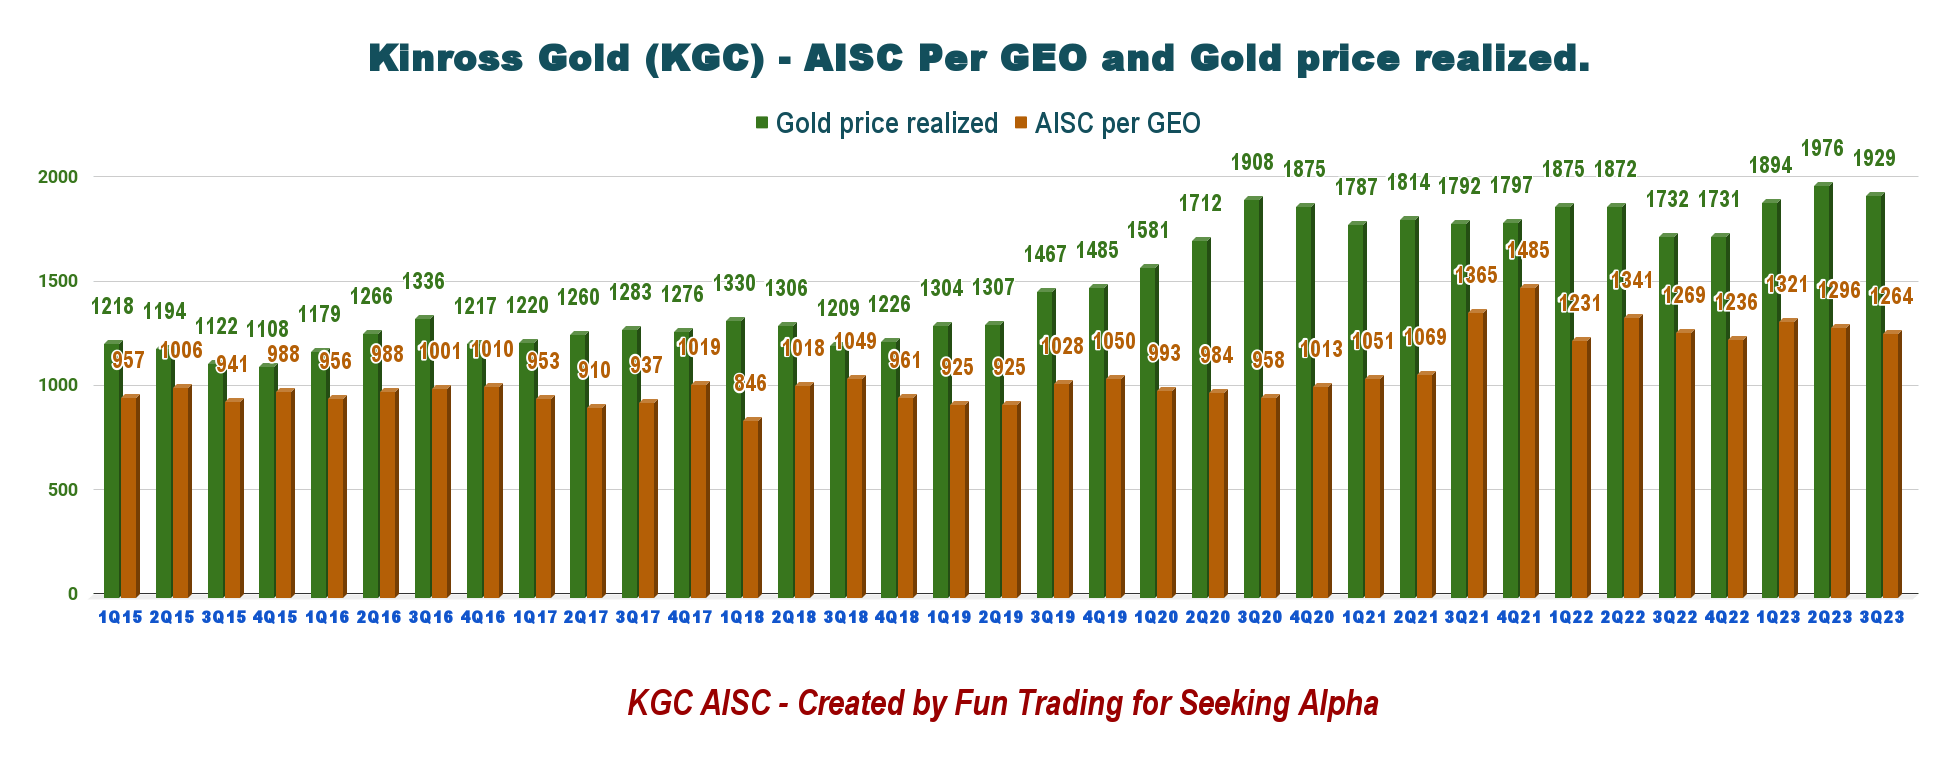
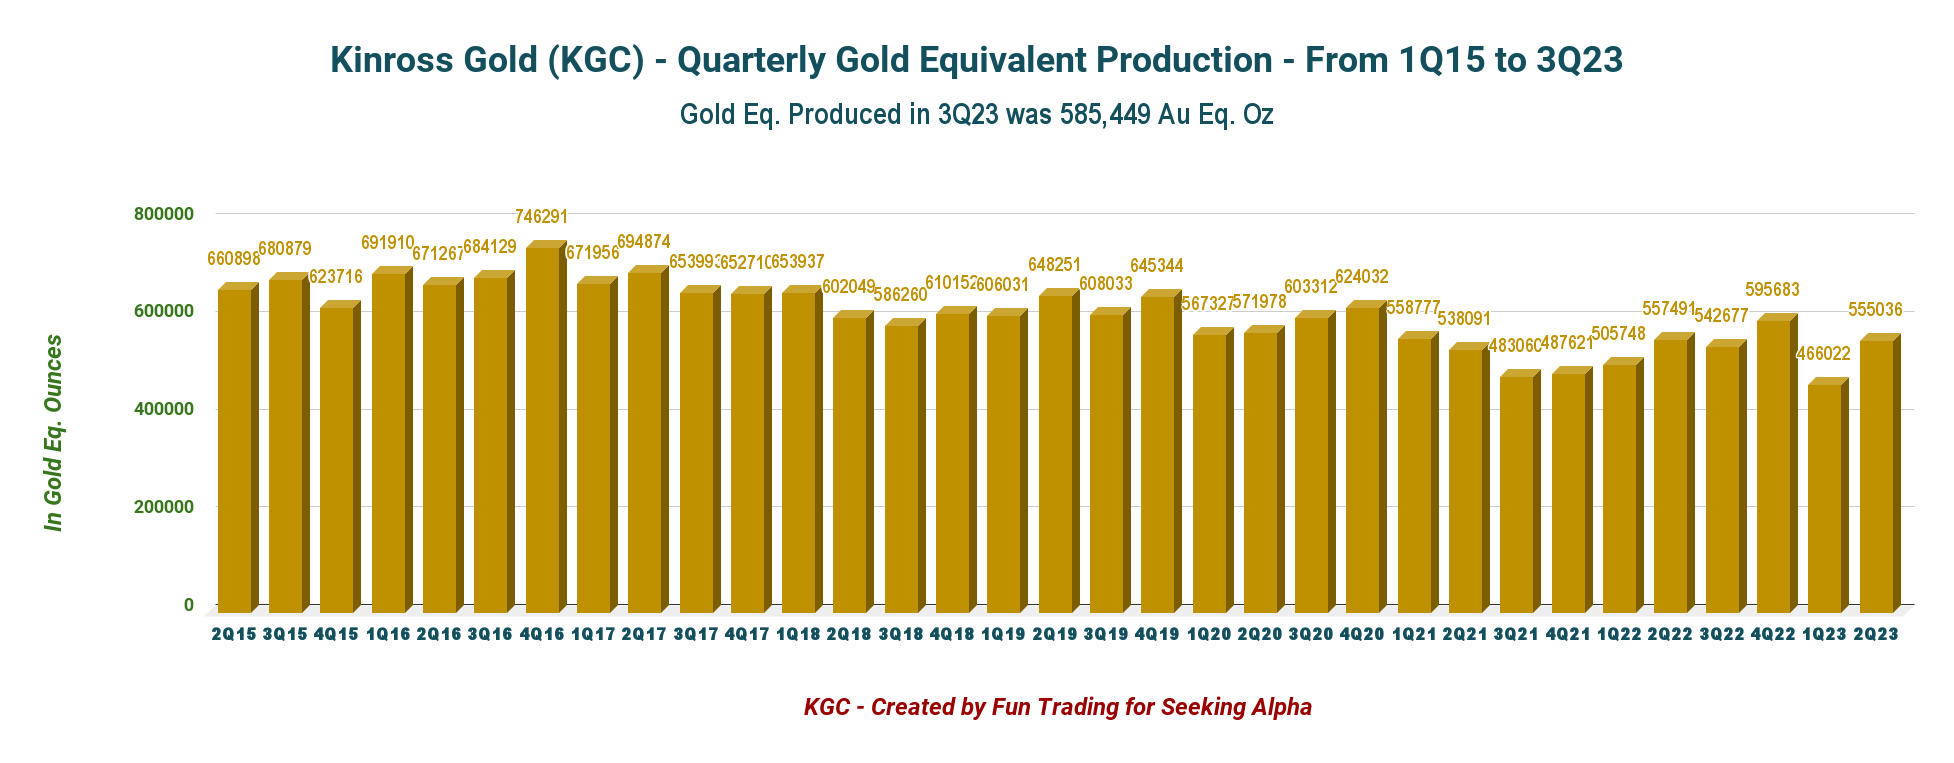
With sales of 571,248 Au eq. oz. and production of 585,449 gold equivalent ounces in 3Q23, there was an 11% increase from the previous year.
The realized price for gold was $1,929 GEO sold, while the AISC was $1,264. The AISC decreased slightly sequentially, as shown in the chart below. It was due to an increase in GEO production this quarter.
KGC Quarterly Gold Price and AISC History (Fun Trading)
The main reasons for the 11% increase in production from the previous year were improved mill grades, recovery, and throughput at Tasiast; increased production at La Coipa because of the operation ramp-up in 2022; and increased production at Paracatu due to improved throughput and timing of processed ounces.
KGC Quarterly Production History (Fun Trading)
The six producing mines that the company owns to produce gold equivalents are listed below:
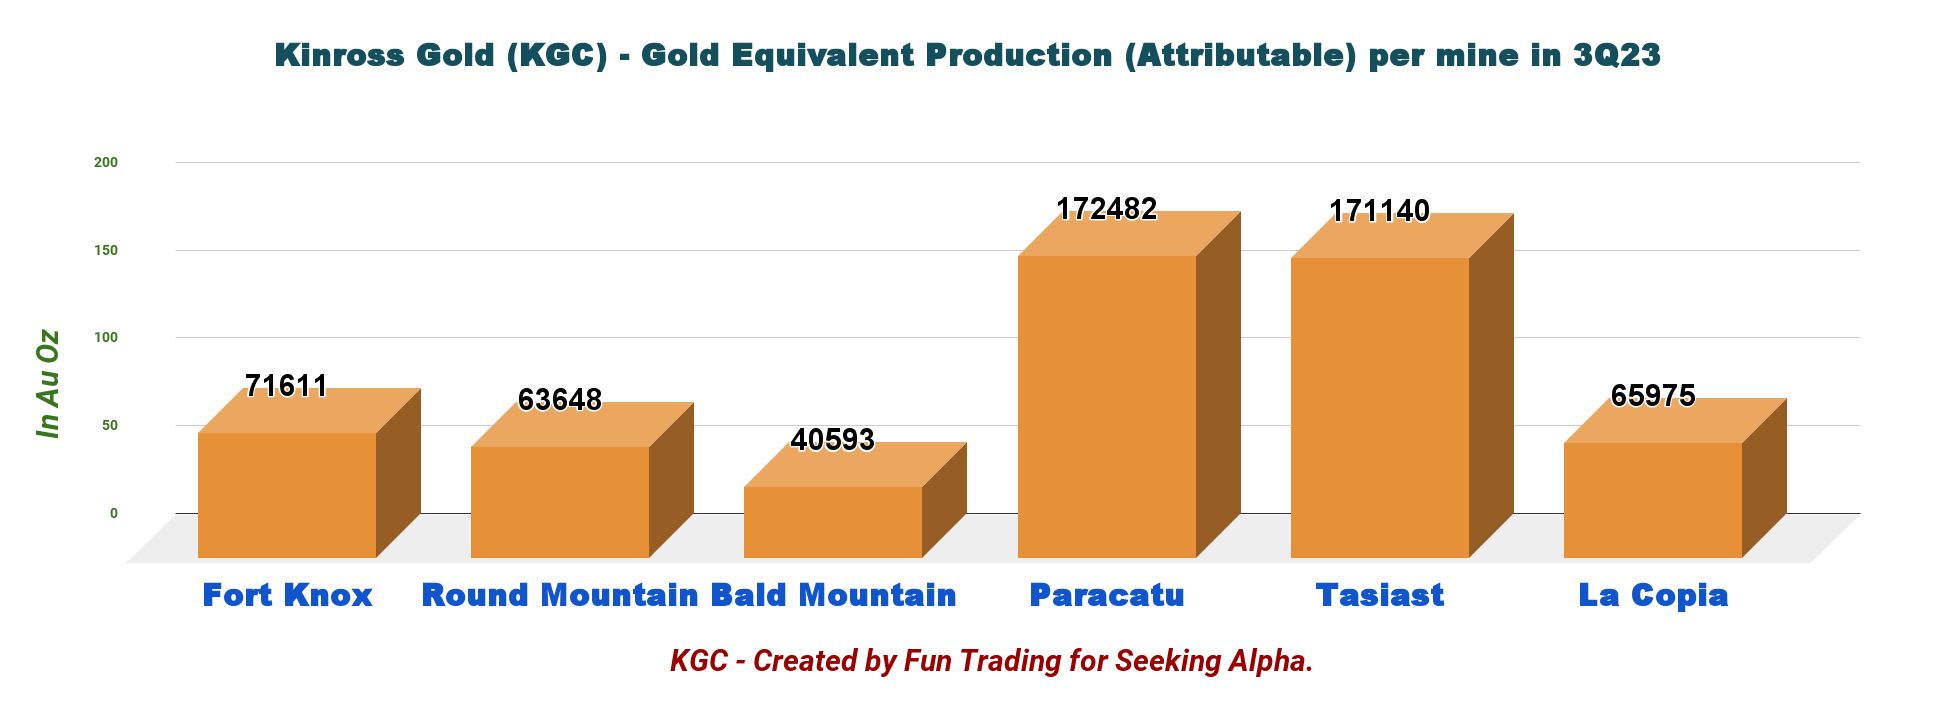
KGC 3Q23 Production per Mine (Fun Trading)
Production rose significantly year over year, mostly as a result of increases in Paracatu , La Copia , and Tasiast . However, production at Bald Mountain dropped 37.9% year over year, as shown below. According to the press statement from the company, Kinross has approved the improved Phase S open pit at Round Mountain , which is expected to increase life-of-mine output by about 750K Au equivalent ounces and extend production until the end of the decade.
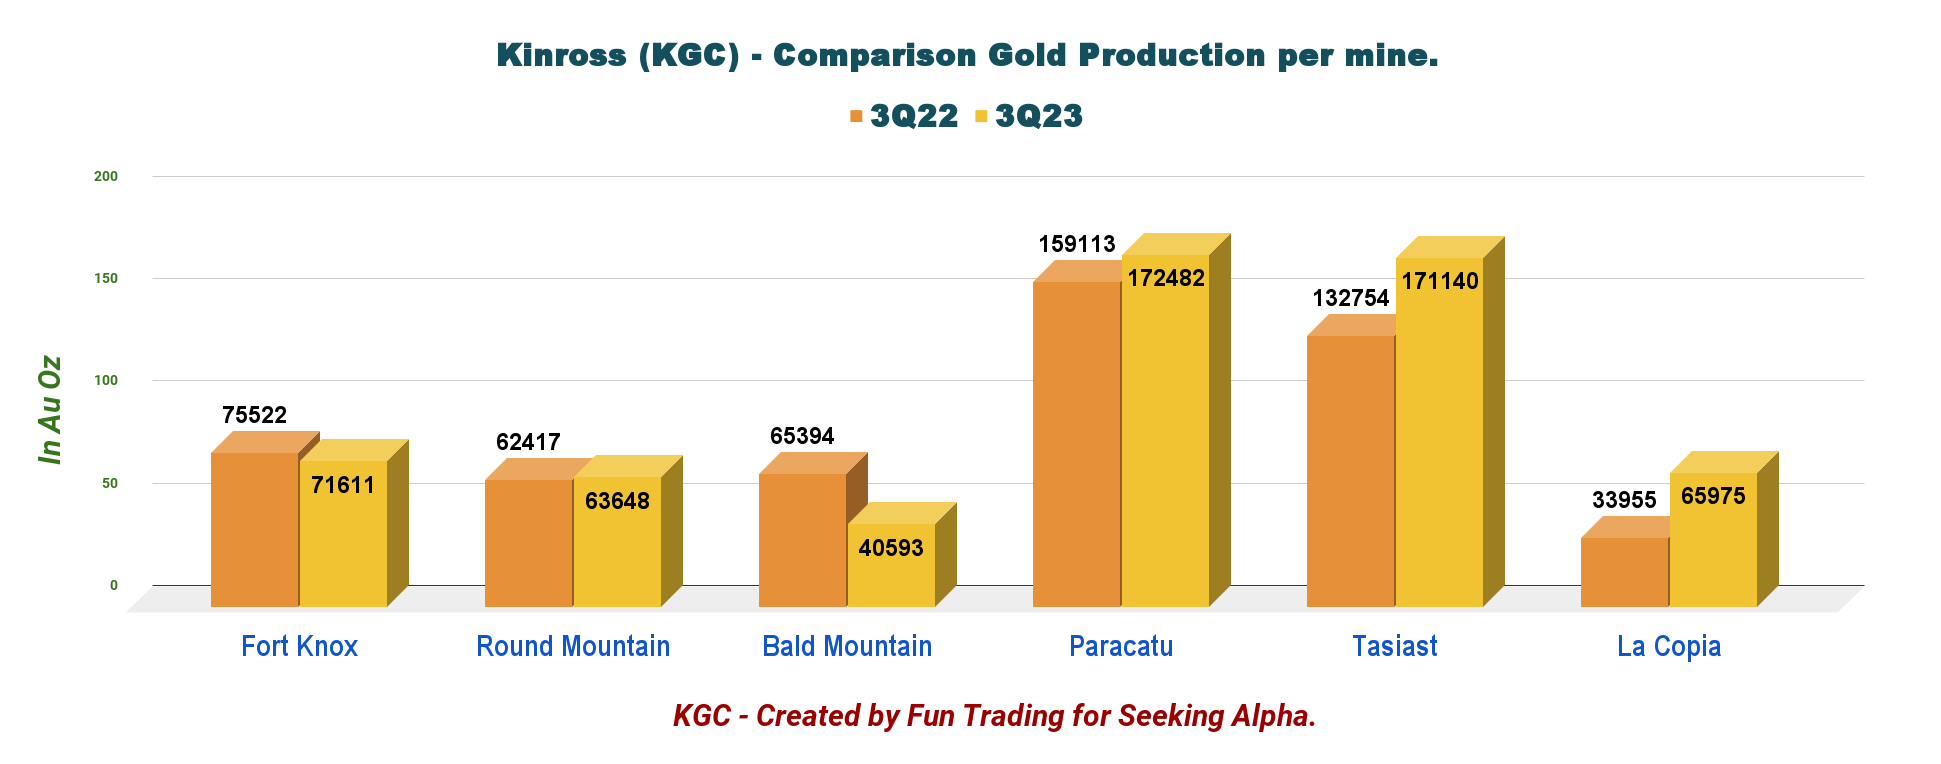
KGC Production per Mine 3Q22 versus 3Q23 (Fun Trading)
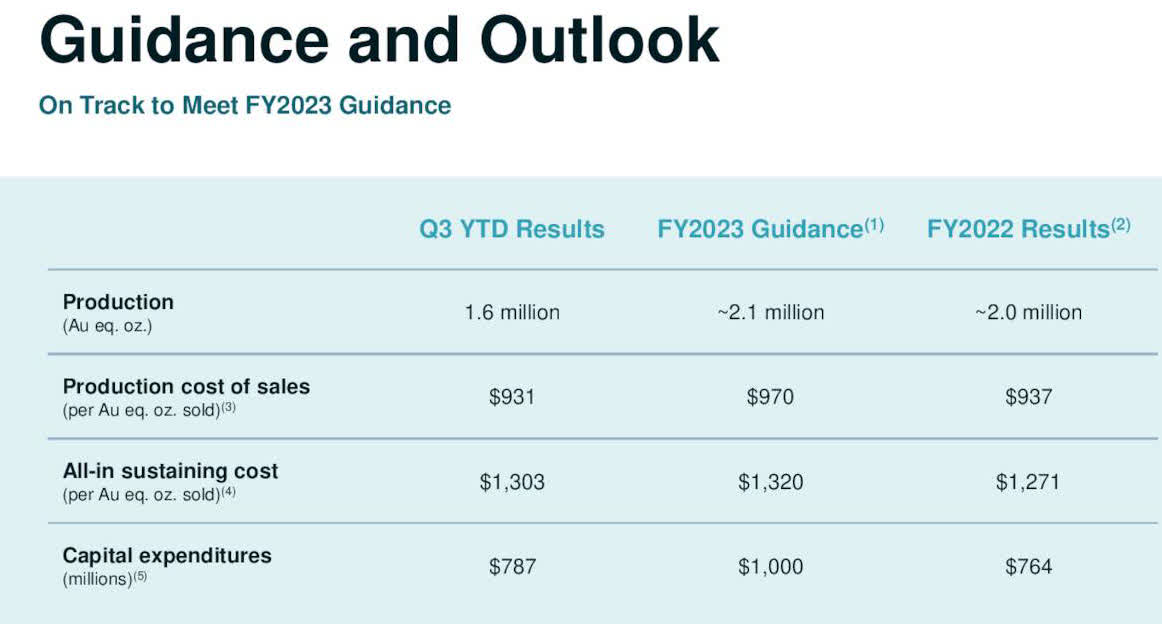
2.3: 2023 Guidance
With an all-in sustaining cost forecast of $1,320 per ounce, the company is on track to meet its 2023 production guidance range of 2.1 million GEOs.
Kinross is operating within the lower end of its guidance range for production cost of sales, which is $970 per GEO , and the upper end of its guidance range for attributable capital expenditure. Kinross will continue to produce 2.1 million and 2.0 million GEOs annually in 2024 and 2025.
KGC 2023 Guidance (KGC Presentation November)
2.4: Debt situation
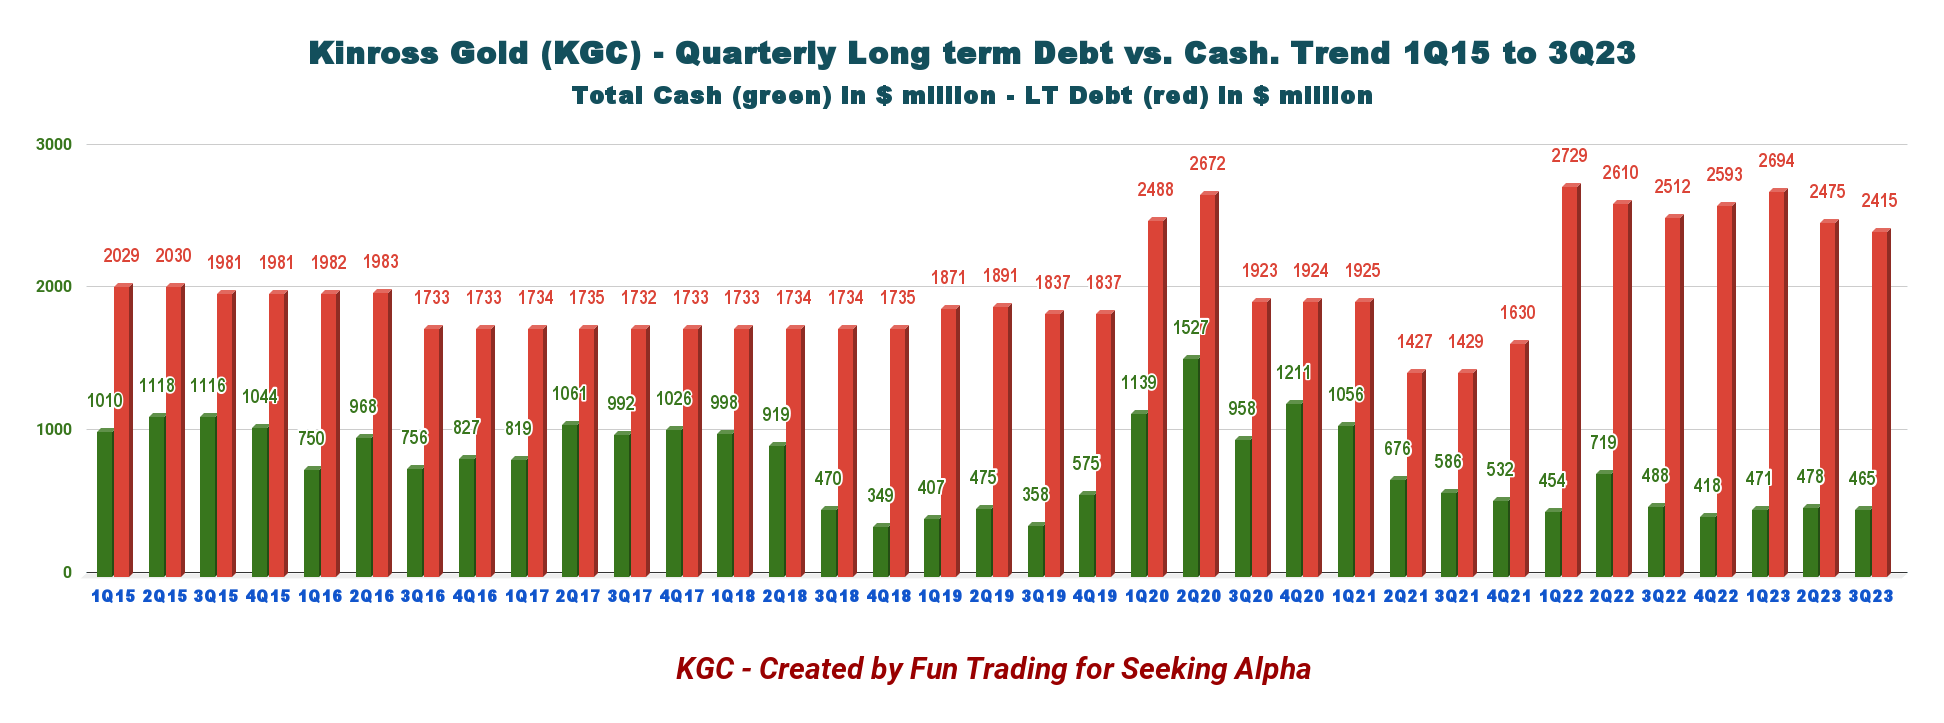
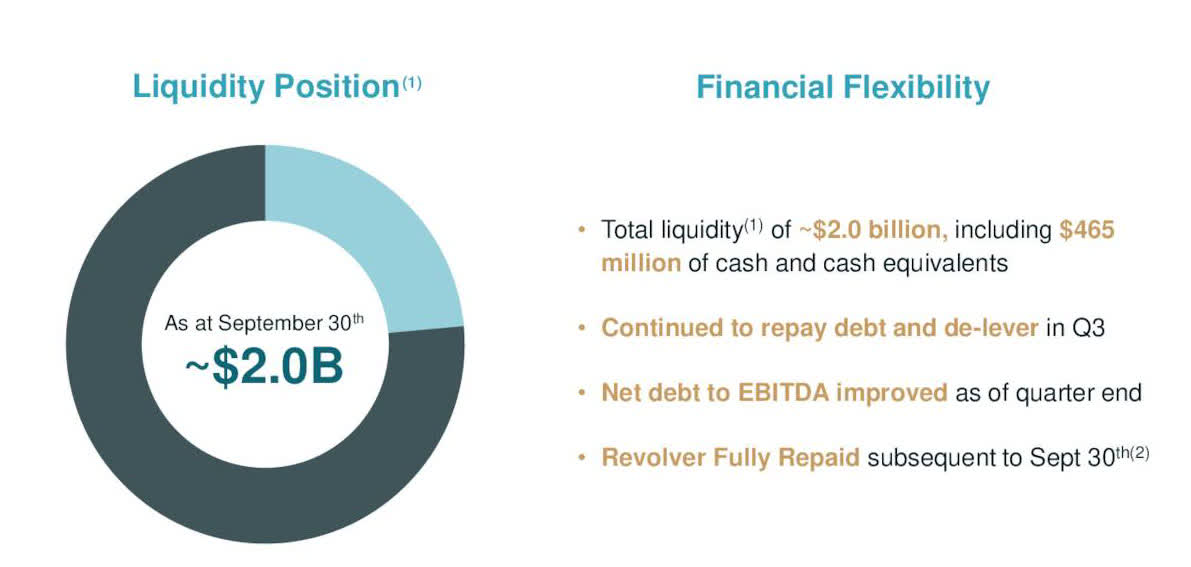
As of September 30, 2023, cash and cash equivalents were down slightly to $464.49 million . The debt was $2,415.3 million in 3Q23.
KGC Cash versus Debt History (Fun Trading)
As of September 30, 2023, the company had about $1.5 billion in available credit and approximately $2.0 billion in overall liquidity , up from $1.9 billion on June 30, 2023.
There was $464.9 million in cash on hand and $2,415.3 million in total debt, including current debts. Although I still think the debt is high, the company has made some headway in bringing it down. In 2024, hopefully, this effort will be fruitful. The actual net debt-to-EBITA ratio is 31.1% and looks elevated.
Note: The $500 million 5.95% senior notes due March 15, 2024, were redeemed with the net proceeds from the issuance of $500 million 6.25% senior notes due in 2033 by the company in 3Q23. During the quarter, the company also paid back $50.0 million of the outstanding debt on the revolving credit facility. The remaining $50.0 million was repaid in October 2023.
KGC Balance Sheet (KGC Presentation)
2.5: Free cash flow
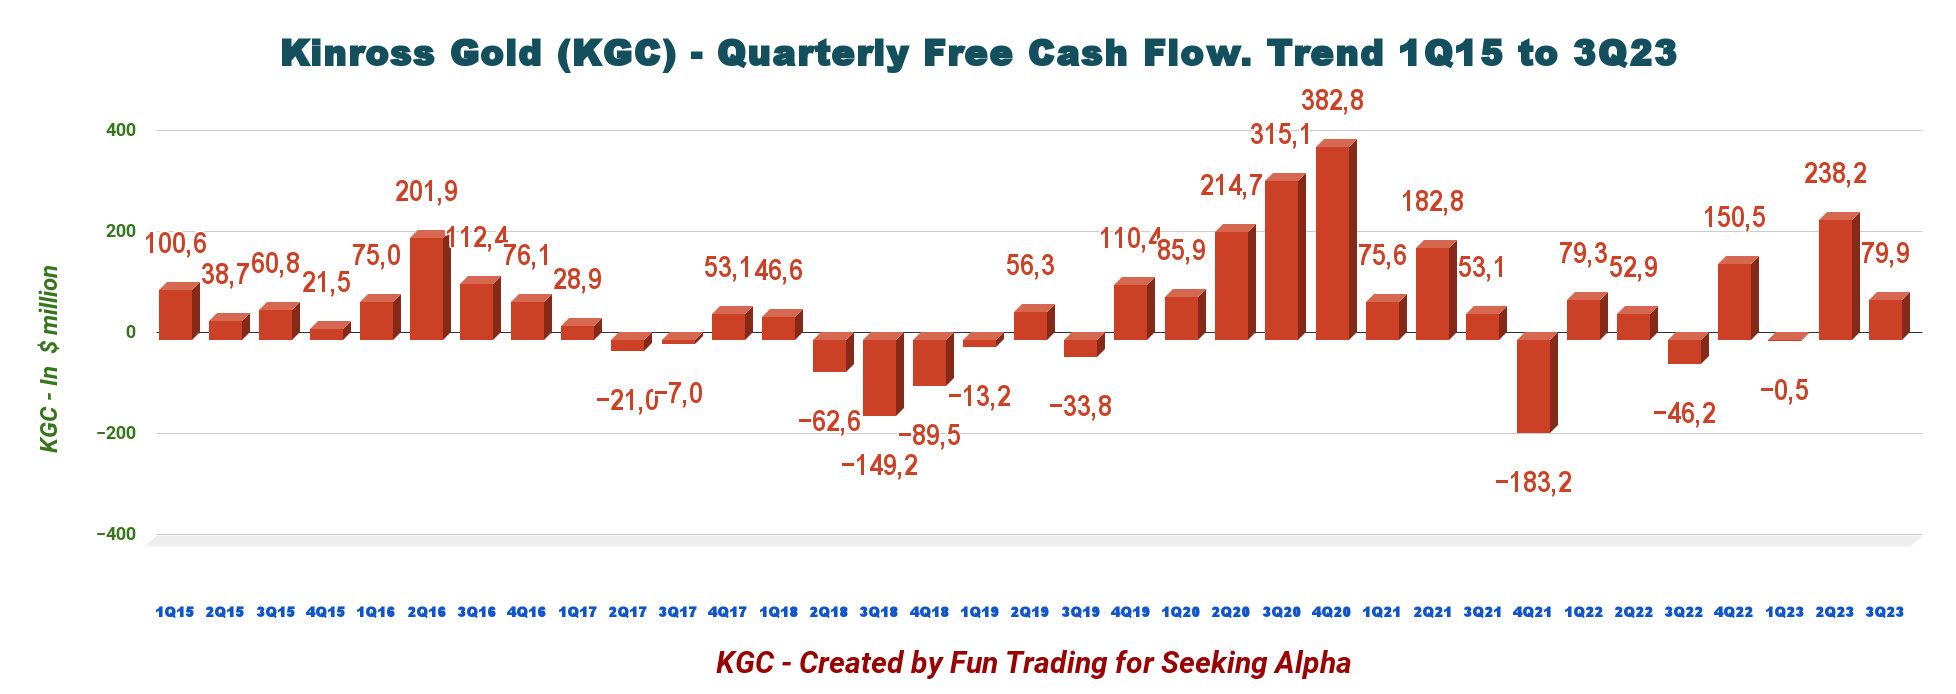
Lastly, Kinross reported $122.9 million in free cash flow. Nevertheless, I don't think the company's method of calculating free cash flow is the most accurate one.
CapEx subtracted from operating cash flow is the generic free cash flow that I use. As a result, 3Q23's generic free cash flow is $79.9 million , resulting in a $468.1 million 12-month free cash flow ("ttm"). As I have explained earlier, free cash flow was down significantly this quarter because of an increase in capital expenses.
KGC Quarterly Free Cash Flow History (Fun Trading)
For 3Q23, the Board of Directors of Kinross declared a quarterly dividend of $0.03 per share, unchanged from the previous quarter.
J. Paul Rollinson, President and CEO, said in the conference call:
Our operations continue to deliver strong performance in the third quarter, and we remained well positioned to meet our full-year guidance. Our focus on delivering on our targets continues to drive strong results. By the end of Q3, we had produced just over three quarters of our full-year production at cost, and are tracking in the lower half of our guidance range. Our business is performing well, and we generated strong cashflow.
3: Stock Performance
On a one-year basis, Kinross has outperformed Agnico Eagle ( AEM ), Newmont Corp. ( NEM ), and Barrick Gold ( GOLD ). KGC has now increased by 25% in one year.
4: Kinross Gold: Financial History 3Q23: The Raw Numbers
| Kinross Gold |
| 3Q22 |
| 4Q22 |
| 1Q23 |
| 2Q23 |
| 3Q23 |
| Total Revenues in Millions |
| 856.5 |
| 1,076.2 |
| 929.3 |
| 1,092.3 |
| 1,102.4 |
| Net Income in Millions |
| 64.9 |
| -106.0 |
| 90.2 |
| 151.0 |
| 109.7 |
| EBITDA $ Million |
| 301.4 |
| 156.0 |
| 369.6 |
| 466.6 |
| 495.4 |
| EPS Diluted in $/share |
| 0.05 |
| -0.08 |
| 0.07 |
| 0.12 |
| 0.09 |
| Operating Cash Flow in Millions |
| 171.6 |
| 474.3 |
| 259.0 |
| 528.6 |
| 406.8 |
| Capital Expenditure in Millions |
| 217.8 |
| 323.8 |
| 259.5 |
| 290.4 |
| 326.9 |
| Free Cash Flow in the Million |
| -46.2 |
| 150.5 |
| -0.50 |
| 238.20 |
| 79.9 |
| Total Cash: $ Million |
| 488.4 |
| 418.1 |
| 471.0 |
| 478.4 |
| 464.9 |
| Long-Term Debt in Millions |
| 2,512 |
| 2,593 |
| 2,694 |
| 2,475 |
| 2,415 |
| Shares Outstanding (diluted) in Million |
| 1,300 |
| 1,258 |
| 1,225 |
| 1,238 |
| 1,238 |
| Quarterly Dividend:: $/share |
| 0.03 |
| 0.03 |
| 0.03 |
| 0.03 |
| 0.03 |
Data Source: Company release and Fun Trading
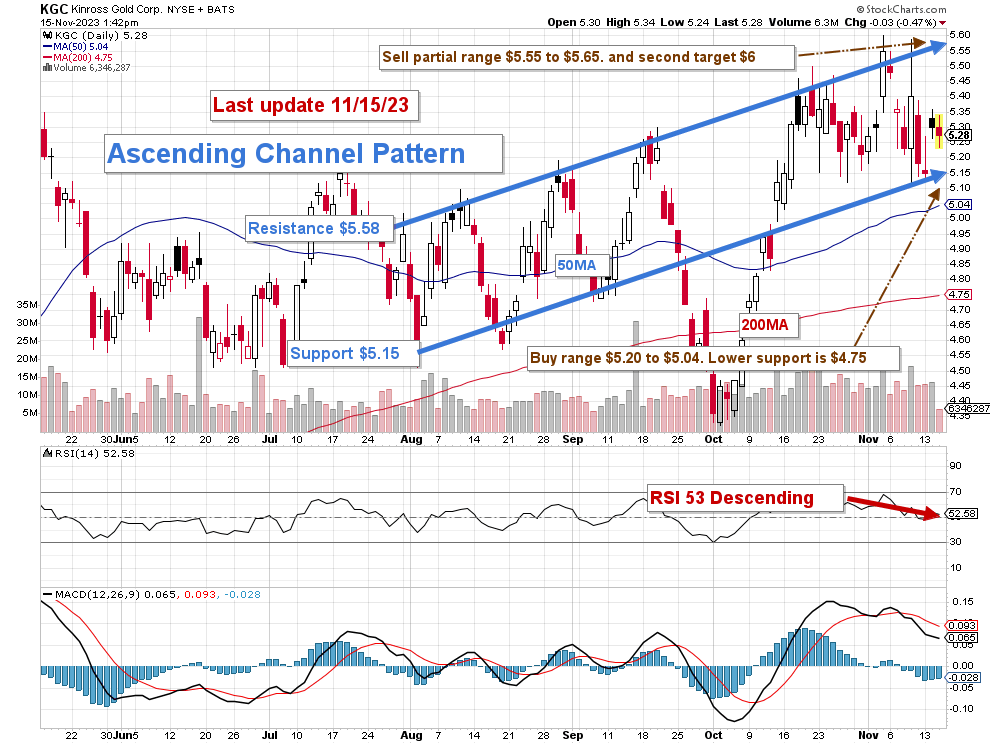
5: Technical Analysis and Commentary
KGC TA Chart (Fun Trading StockCharts)
Note: The dividend is taken into account in the chart.
KGC forms an ascending channel pattern, with $5.15 as support and $5.58 as resistance. The RSI is currently 53 falling, suggesting that the $5.15–$5 support level may be tested again. As I have indicated in my preceding article:
Ascending channel patterns or rising channels are short-term bullish in that a stock moves higher within an ascending channel, but these patterns often form within longer-term downtrends as continuation patterns. The ascending channel pattern is often followed by lower prices, but only after a downside penetration of the lower trend line.
I advise maintaining a core long-term investment with a target of $7+ and trading short-term LIFO at roughly 50% of your total KGC position.
I suggest buying KGC between $5.20 and $5.04 with potential lower support at $4.75 and selling roughly 50% of your position between $5.55 and $5.65 with potential upper resistance at $6.00.
Trading LIFO allows you to trade your most recent position for a profit without liquidating at an unnecessary loss, which is usually underwater for KGC.
First and foremost, I don't think you should ever sell LIFO at a loss. Rather, you should sell it at a profit of three to eight percent, depending on your plan and available cash. The real gain is in repeating the process while waiting for a breakthrough.
Warning: The TA chart must be updated frequently to be relevant. The chart above has a possible validity of about a week. Remember, the TA chart is a tool only to help you adopt the right strategy. It is not a way to foresee the future. No one and nothing can.
For further details see:
Kinross Gold: Impressive Results This Quarter