STLD - Magic Formula Dividend Portfolio For April
2023-04-07 11:03:02 ET
Summary
- The following is a dividend portfolio strategy for large caps that score the highest amongst Joel Greenblatt's Magic Formula screener.
- The list follows large caps that have dividends.
- The dividend yield kicker is added to the final score to enhance the total return outlook of the stock.
Magic Formula with a dividend kicker
In my bio, you'll see that I'm a big proponent of Joel Greenblatt's Magic Formula indexing method. It's worked well for me. The strategy makes up a significant portion of my self-indexing, beta-plus part of my portfolio. The other part is a self-indexing strategy mimicking the DJIA 30. I call this beta plus because I seek to match the beta of the market with a few points of Alpha on top.
For those unfamiliar with Magic Formula investing, here is a synopsis below: The metric used in Magic Formula/Little Book investing is quite simple, it takes all the stocks in the stock market, minus banks and utility companies (since their growth is regulated), and scores them by combining their earnings yield and their return on invested capital. The two percentages are added together and a score is derived from this.
I am adding one more metric to the formula for income investors such as myself and the legions of intelligent Seeking Alpha investors. On top of the ROIC and earnings yield score, I'm adding a kicker for dividend yield in the scoring system. This is similar to the unique way Peter Lynch used his PEG ratio system where he would add the dividend to the multiplier. Every stock in the portfolio here has a dividend. I have set the market cap at $15 Billion and above. This leaves stocks with institutional investment grade market caps to even out the beta and have a higher likelihood of dividend consistency and growth.
The list
The Magic Formula screener does not provide scores, just a list of the top 30 or 50 stocks above a chosen market cap. I have set up a scoring system similar to what Tobias Carlise had proposed in his acquirer's multiple book and ETF. You can download the Excel sheet with scoring formulas built-in on my previous article with small caps titled "Buy and Hold Coffee Can Portfolio For The Next 15 Years" .
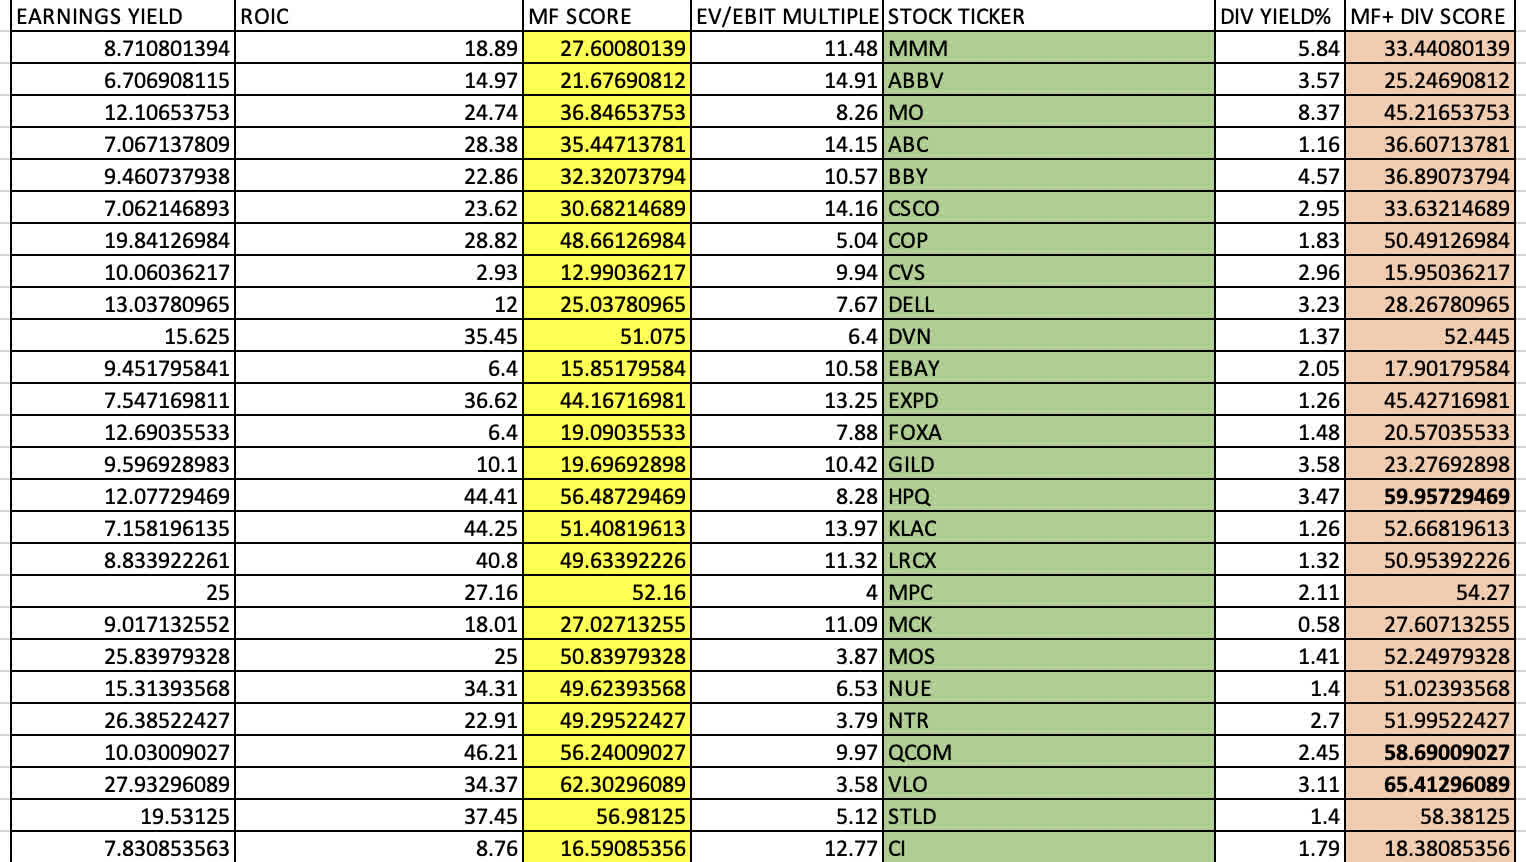
First, the EV/EBIT multiple is placed in one column and then 1 is divided by the multiple to come up with the earnings yield. ROIC is from my brokerage fundamentals section. If your brokerage does not supply the data, Greenblatt advised you to use ROA. I then lined up the dividend yields on the second to last right column and added it to the Magic Formula score on the far right for the adjusted score including the dividend yield.
The scores
| ( MMM ) |
| 33.44 |
| ( EBAY ) |
| 17.9 |
| ( NUE ) |
| 51.02 |
| ( ABBV ) |
| 25.24 |
| ( EXPD ) |
| 45.427 |
| ( NTR ) |
| 51.99 |
| ( MO ) |
| 45.21 |
| ( FOXA ) |
| 20.57 |
| ( QCOM ) |
| 58.69 |
| ( ABC ) |
| 36.6 |
| ( GILD ) |
| 23.27 |
| ( VLO ) |
| 65.41 |
| ( BBY ) |
| 36.89 |
| ( HPQ ) |
| 59.95 |
| ( STLD ) |
| 58.38 |
| ( CSCO ) |
| 33.63 |
| ( KLAC ) |
| 52.668 |
| ( CI ) |
| 18.38 |
| ( COP ) |
| 50.49 |
| ( LRCX ) |
| 50.95 |
| ( CVS ) |
| 15.95 |
| ( MPC ) |
| 54.27 |
| ( DELL ) |
| 28.26 |
| ( MCK ) |
| 27.6 |
| ( DVN ) |
| 52.445 |
| ( MOS ) |
| 52.24 |
Top 3
There are quite a few oil and gas companies found when screening high ROIC+ EY stocks. Valero ( VLO ), stands out as the top stock in the list of Magic Formula dividend socks. They are humming along at the top of the oil cycle with some nice momentum scores. HP Inc. ( HPQ ), was big news when it became a Buffett stock in the portfolio of Berkshire Hathaway ( BRK.B )( BRK.A ), but hasn't changed much since and still sits around a $3 Billion position according to their latest 13F. Finally, Qualcomm ( QCOM ), makes the top 3 with a nice 2.45% dividend, a high ROIC, and a great earnings yield. It has been relatively flat as of late, but is one of the more resilient chip stocks out there and a long-term holding if mine.
Below are the "what they do" descriptions courtesy of Yahoo Finance accompanied by factor grades and trend lines for price and ROIC correlations.
HP Inc.
HP Inc. provides personal computing and other access devices, imaging and printing products, and related technologies, solutions, and services in the United States and internationally. The company operates through three segments: Personal Systems, Printing, and Corporate Investments. The Personal Systems segment offers commercial and consumer desktops and notebooks, workstations, commercial mobility devices, thin clients, retail point-of-sale systems, displays and peripherals, software, support, and services, as well as video conferencing solutions, cameras, headsets, voice, and related software products.
HP Inc is seeing a slight positive uptick in momentum. The trend line for return on invested capital that spiked a year ago, corresponded with the price peak in 2022.
SEEKING ALPHA
HP Inc. is boasting an excellent dividend yield with a massive 5-year growth rate over 10%. The payout ratio of earnings is only 27%. Plenty of coverage.
Stats courtesy Seeking Alpha:
| Div Yield [FWD] 3.57% |
| Annual Payout [FWD] $1.05 |
| Payout Ratio 27.22% |
| 5 Year Growth Rate 13.51% |
Qualcomm
QUALCOMM Incorporated engages in the development and commercialization of foundational technologies for the wireless industry worldwide. It operates through three segments: Qualcomm CDMA Technologies (QCT); Qualcomm Technology Licensing (QTL); and Qualcomm Strategic Initiatives ((QSI)). The QCT segment develops and supplies integrated circuits and system software based on 3G/4G/5G and other technologies for use in wireless voice and data communications, networking, application processing, multimedia, and global positioning system products.
Momentum for Qualcomm is improving along with the rest of the chip sector. Price movement and ROIC trends are correlating closely.
SEEKING ALPHA
With a yield of just under 3%, it is still one of the best yields among all of the semiconductors. A payout ratio under 30% and a growth rate over 5%.
Stats courtesy Seeking Alpha:
| Div Yield [FWD] 2.44% |
| Annual Payout [FWD] $3.00 |
| Payout Ratio 25.11% |
| 5 Year Growth Rate 5.64% |
Valero
Valero Energy Corporation manufactures, markets, and sells transportation fuels and petrochemical products in the United States, Canada, the United Kingdom, Ireland, Latin America, and internationally. It operates through three segments: Refining, Renewable Diesel, and Ethanol.
Valero and the refiners in general are seeing a positive uptick in momentum. ROIC for the entire sector is seeing positive uptrends and prices are following suit.
SEEKING ALPHA
Valero is in the ultra-hot refiners' sector and has one of the better yields after gaining over 28% YTD. The payout ratio is a paltry 13.4% with a nice growth rate of over 6%. If trends in oil and gas continue, there is plenty of room to grow the dividend with ample coverage.
Stats courtesy Seeking Alpha:
| Div Yield [FWD] 3.02% |
| Annual Payout [FWD] $4.08 |
| Payout Ratio 13.40% |
| 5 Year Growth Rate 6.43% |
ROIC correlations
We can see above that ROIC and to the same extent you'll probably find ROE tracking price movement in near lockstep. The goal of the Magic Formula is to catch the companies selling cheaply by earnings yield yet performing well in their business cycle as indicated by their ROIC. Although some of the top scorers are starting to taper downwards by share price and ROIC, it is still worthwhile to bet on companies who have demonstrated the ability to generate these high returns on capital, indicating companies that are high quality and may have some attributes of a moat.
Dividend coverage
It seems to be no surprise that focusing on a portfolio of high earnings yield, high ROIC stocks also have the commonality of excellent dividend coverage. Using the screener as a good area to hunt for healthy, well-covered dividend yields seems like a wise choice. The higher the score, the higher the correlation between dividend coverage and 5-year dividend growth. With an emphasis on adding the yield to the Magic Formula score, we get the trifecta of great coverage, growth, and yield.
Conclusion
My spin on the Magic Formula is to primarily put money in dividend payers exclusively at the large-cap level. The guidance of the Magic Formula is to liquidate the portfolio after your gains have become long-term and then buy a new list and subsequently hold for another year. So on and so forth. My opinion is I'd rather buy consistently shares of large-cap quality companies that pay dividends, reinvest those, and hold for much longer periods than a year, avoiding headaches and tax implications of liquidation. I update the list periodically and continue to DCA this method and the 30 stocks in the DJIA as my index strategy. Looking forward to updating this list on a monthly basis. Happy hunting!
For further details see:
Magic Formula Dividend Portfolio For April