MCD - McDonald's: New Growth Strategy Review
2023-12-12 10:20:36 ET
Summary
- McDonald's is the Quick Serve Restaurant sector market leader in terms of revenues and profitability.
- The key to its profitability comes from the high margins generated from its franchise operations.
- At its recent Investor Day, the company announced a strategy to accelerate the growth rate in new restaurant openings.
- Although generating higher revenue growth and higher operating margins into the future, the company currently looks to be more than fully priced.
Company Description
McDonald’s Corporation (MCD) franchises and operates McDonald’s restaurants. At the end of FY2022 there were 40,275 branded restaurants across 119 countries. Approximately 95% of the restaurants are franchised.
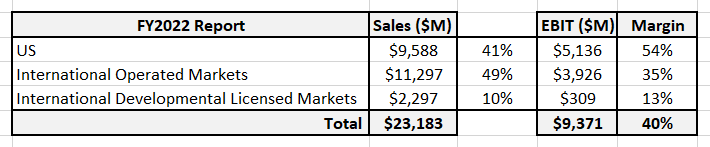
The company generates revenues from operating its own restaurants and from fees applied to franchisees. It has three reportable geographic operating segments and provides fully allocated restaurant operating margins for each segment:
Author's compilation using data from McDonald's 10-K filing.
Business Overview
McDonald’s has three models for the ownership and operations of its franchised restaurants:
- Conventional franchise.
- Developmental license franchise.
- Affiliate franchise.
The key differences between the franchise types essentially relates to the amount of capital McDonald’s invests. The two extremes are a conventional franchise where McDonald’s may own the land and the buildings whereas in a developmental license franchise McDonald’s may have no capital invested.
For strategic reasons McDonald’s also owns and operates restaurants but it can be seen from the following chart that these numbers have been declining, and the franchise model is clearly their preferred business model:
Author's compilation using data from McDonald's 10-K filings.
The proportion of company owned restaurants has declined from 19% in FY2013 to just over 5% by the end of FY2022. Another take-away from the chart is the relatively low growth rate in restaurant numbers that has been occurring for many years.
One of the key differences between McDonald’s and its competitors is the amount of capital it invests in land and buildings. At the end of 2019, the company owned 55% of its operating sites and 80% of the buildings (there has not been an update to this information for several years).
Addressable Market
McDonald’s defines its market as the Informal Eating Out sector. It provides an update of their market size estimate every 2 years in its 10-K filing (the last update was in FY2021) and this estimate is very similar to the estimates provided by Statista.
I have sourced the sector’s annual turnover from Statista and graphed it below:
Author's compilation using data from Statista and McDonald's 10-K filings.
Note that the McDonald’s data is based on “system” revenues (defined as the total restaurant sales of all McDonald’s branded restaurants).
The key takeaways from the chart are:
- The decline in sector revenues caused by the COVID pandemic have been fully recovered.
- McDonald’s has been slowly gaining market-share since FY2016. The sector is extremely fragmented given that McDonald’s is the market leader (with Yum Brands (YUM) in a distant 2 nd place).
- The sector is relatively mature and the compound annual revenue growth rate since FY2012 has been just above 3%.
McDonald’s Strategy – Accelerating the Arches
The “Accelerating the Arches” plan was initiated in November 2020 and earlier this year the company announced an enhancement to the plan involving an accelerated store opening plan (potentially with new formats) and a new internal program called Accelerating the Organization (focused on creating structural efficiencies).
The strategy has been relatively successful in growing system sales (notwithstanding the negative impact of COVID):
Author's compilation using data from McDonald's 10-K filings.
Over the last 10 years, McDonald’s has achieved a compound annual system revenue growth rate of 3% (which is reasonably in line with the sector).
The chart shows that a key component of the strategy has been to shrink the company owned restaurant base and drive system growth through the franchisees. In the next section of the report, it will become clear the significant impact that this strategy has had on the company’s profitability.
McDonald’s Historical Financial Performance
Revenues and Operating Margins
McDonald’s consolidated historical revenues and adjusted operating margins are shown in the following chart:
Author's compilation using data from McDonald's 10-K filings.
It should be noted that I have made an adjustment to McDonald’s reported Operating Income for the impact of operating leases and non-operating gains and losses (these include asset sales, investment profits, restructuring charges, etc).
The chart highlights the significance of the changing mix between company stores and franchised stores. This has resulted in a decline in reported revenues, but this has been more than made up for by the significant increase in aggregate operating margin (owned restaurants typically have margins of 15% to 17% whist Franchise margins are 81% to 83%).
The chart also highlights that since FY2020, total revenues have stopped declining and are now rising. Since FY2018 MCD has managed to almost double the rate of new system restaurant openings (FY2022 numbers are distorted by the closure and sale of the Russian business).
I estimate that McDonald’s has the highest operating margins globally in its sector and its competitors are significantly lower.
Cash Flows
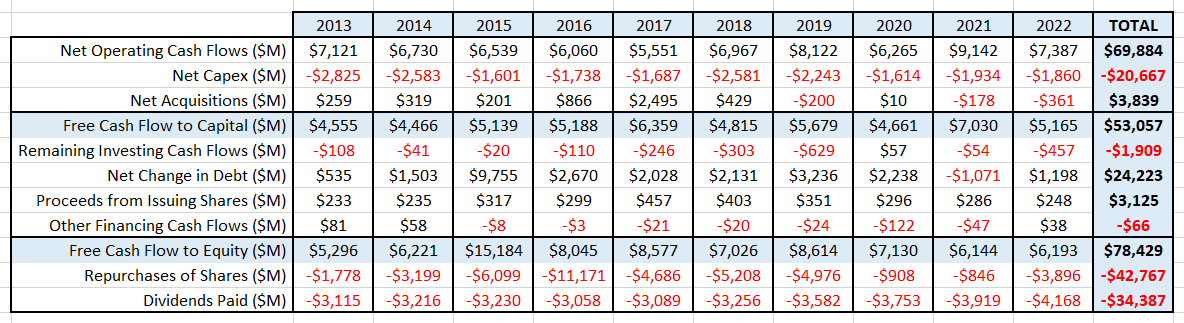
The following table summarizes McDonald’s cash flows for the last 10 years:
Author's compilation using data from McDonald's 1o-K filings.
From the table, we can see that McDonald’s operations have generated $53,057 M in free cash flow after reinvestment. They have increased their debt by $24,223 M and received $3,125 M from the issuance of new shares to its executives.
This means that there was $78,429 M available to return to shareholders.
The company used this cash to pay out $34,387 M in dividends and spent $42,767 M in buying back stock.
The dividend is safe as it is easily covered by the free cash flow (the dividend has increased every year for the last 46 years and I see no reason for this not to continue).
The share buybacks have been used as a balancing item when the company has excess cash and I expect that in the future the quantum will flex up and down in line with the performance of the underlying business.
There will probably be a “bumper” year of share buy-backs every few years if the company’s cash balance gets to a level where it is considered excessive.
Capital Structure
The following chart shows the history of McDonald’s capital structure:
Author's compilation using data from McDonald's 10-K filings.
McDonald's level of debt peaked during COVID (unsurprisingly). The restaurant sector’s median debt ratio is currently 24% and the company appears to take reasonable care to ensure that the structure of its balance sheet is closely aligned with its competitors.
I have no concerns about McDonald’s capital structure, and they have sufficient operating cash flows to more than cover its interest payments.
Return on Invested Capital
The following chart shows the history of McDonald’s return on invested capital:
Author's compilation using data from McDonald's 10-K filings.
It should be noted that the ROIC is excellent and is in the sector’s highest quartile.
To some degree, the chart shows a cyclical pattern but more importantly since the implementation of its growth initiatives there has been a progressive increase in ROIC (after allowing for the impact of COVID).
The relatively high ROIC leads me to conclude McDonald’s has a narrow but quite deep sustainable competitive advantage relative to its competitors.
My Investment Thesis for McDonald’s
I have previously written about McDonald's in an article titled " McDonald's: Price Fall to Come ". In this article, I used my own estimates of the company's growth and margin potential and concluded that it was over-priced.
McDonald's recently held their 2023 Investor Day and the key take away was that it is planning to increase its rate of restaurant expansion. McDonald’s is now targeting to increase the number of system restaurants from 40,275 in FY2022 to 50,000 by the end of FY2027.
This article is a based on the financial outcomes announced at the McDonald's Investor Day.
Growth Story
I have assumed that the cadence of new restaurant openings will be constant over the next 5 years which equates to 1,960 restaurants per year.
McDonald’s has provided a divisional split for the new restaurants. I have assumed that McDonald’s will continue to own and operate 5% of the total system restaurants.
The scenario is based on the following annual new restaurant schedule for the next 5 years:
Author's valuation scenario.
At the end of FY2027, I assumed that the rate of new restaurant growth will slowly taper to 4% per year by FY2033.
I have also assumed that the same store revenue growth rate is 4% per year (this is a proxy for the US 10-year risk free rate) for the next 10 years.
This scenario generates a total reported revenue growth for McDonald’s of between 6% to 8% per year for the next 5 years before tapering to 4% at the end of year 10.
Margin Story
McDonald’s already achieves sector leading operating margins. For the scenario I have assumed that the current operating margins for each of the divisions are maintained for the entire forecast period.
Although the divisional margins are unchanged, by virtue of the new restaurant opening skew to international developmental franchises this will lead to an expansion in the overall reported operating margin.
This scenario generates an operating margin of between 46% to 49% per year.
Growth Efficiency
McDonald’s has indicated that the base level of annual capex will be around $2,500 M per year, and it should increase by an average of $400 M per year from now.
I measure capital efficiency as revenue generated per invested capital. McDonald’s has a historical capital ratio of 0.65 (this means it generates 65 cents in revenue for every dollar invested).
The ratio is very low relative to the sector’s median of 1.69 because McDonald’s owns quite a reasonable proportion of the land and buildings occupied by itself and many of its conventional franchisees.
This scenario assumes that 70% of the new restaurants are international developmental franchises where McDonald’s claims that it does not invest any capital. As a result, I have assumed that the growth initiative will be relatively capital “light” and the capital ratio for the next 10 years will be between 2.0 and 2.4 (between the sector’s 50 th and 75 th percentile).
McDonald’s may choose to take minority equity holdings in some of the new restaurants, but I have not included these investments in the scenario. I have also assumed that there will not be any significant acquisitions over the forecast period.
Risk Story
My scenario is based on the current global macro-economic conditions (interest rates are stabilizing but economic activity appears to be slowing). In these circumstances the current cost of capital is quite high relative to estimates for the previous few years. This is a reflection of the current higher interest rates and the economic uncertainties which are facing many companies.
McDonald’s cost of capital is slightly higher than my estimate for the typical US-based company. This is not surprising because McDonald's has exposure to a very large number of countries and the risks associated with this spread of operations contributes to the company's over-all risk profile. Over the course of the forecast period, I have allowed the cost of capital to drift down to the current average US listed company level.
McDonald’s current capital structure is typical for companies in the sector, and I am not forecasting any significant changes which may impact the cost of capital.
Competitive Advantages
McDonald’s operates in a very fragmented sector where the barriers to entry are very low but nevertheless it has managed to become the sector leader with a very enviable market position. It has sector leading margins, above average growth potential and relatively high returns on capital.
I have assumed that McDonald’s can maintain its competitive position into the future and will continue to have returns on capital which exceed its terminal cost of capital.
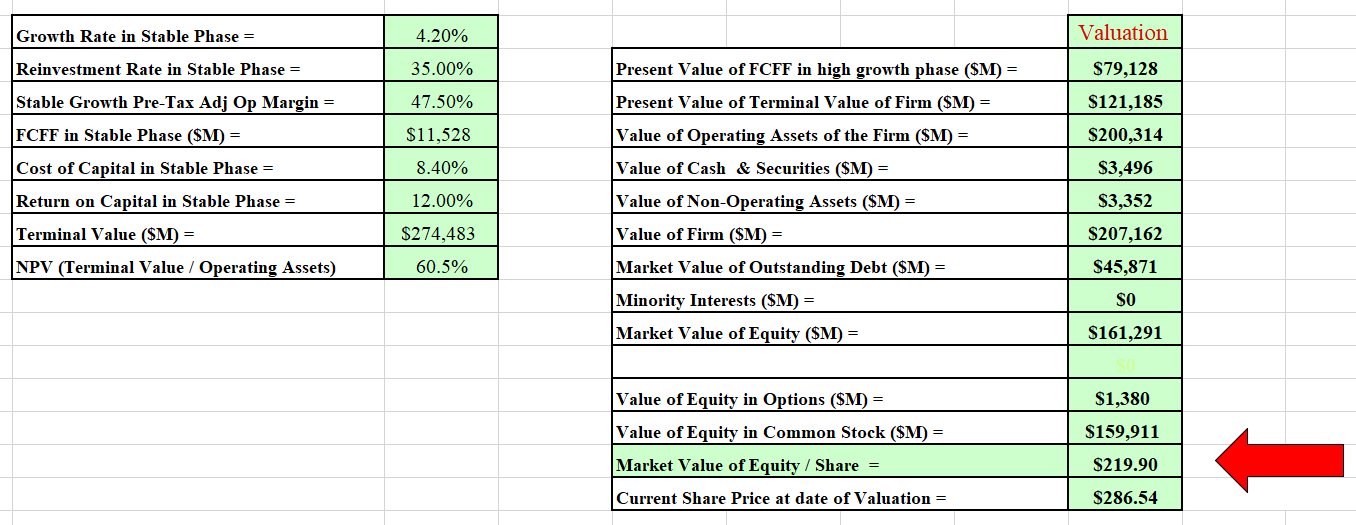
Valuation Assumptions
The following table summarizes the key inputs into the valuation:
Author's valuation model inputs.
There are other implicit assumptions within my valuation which should be noted:
- I have converted McDonald’s equity investments into a market value by multiplying the current book value by the sector’s median price to book ratio (3.23).
- McDonald’s has announced that it is increasing its equity in its Chinese franchise. The holding will continue to be less than a controlling stake therefore it will have no impact on the valuation (I assume that the seller will only sell at the current market value).
- The value of the real estate assets on the McDonald’s balance sheet may be significantly understated given that the land for many locations was purchased many years ago. I have not attempted to account for this in the valuation.
- Given the proximity to the end of FY2023, I have taken this to be the base year.
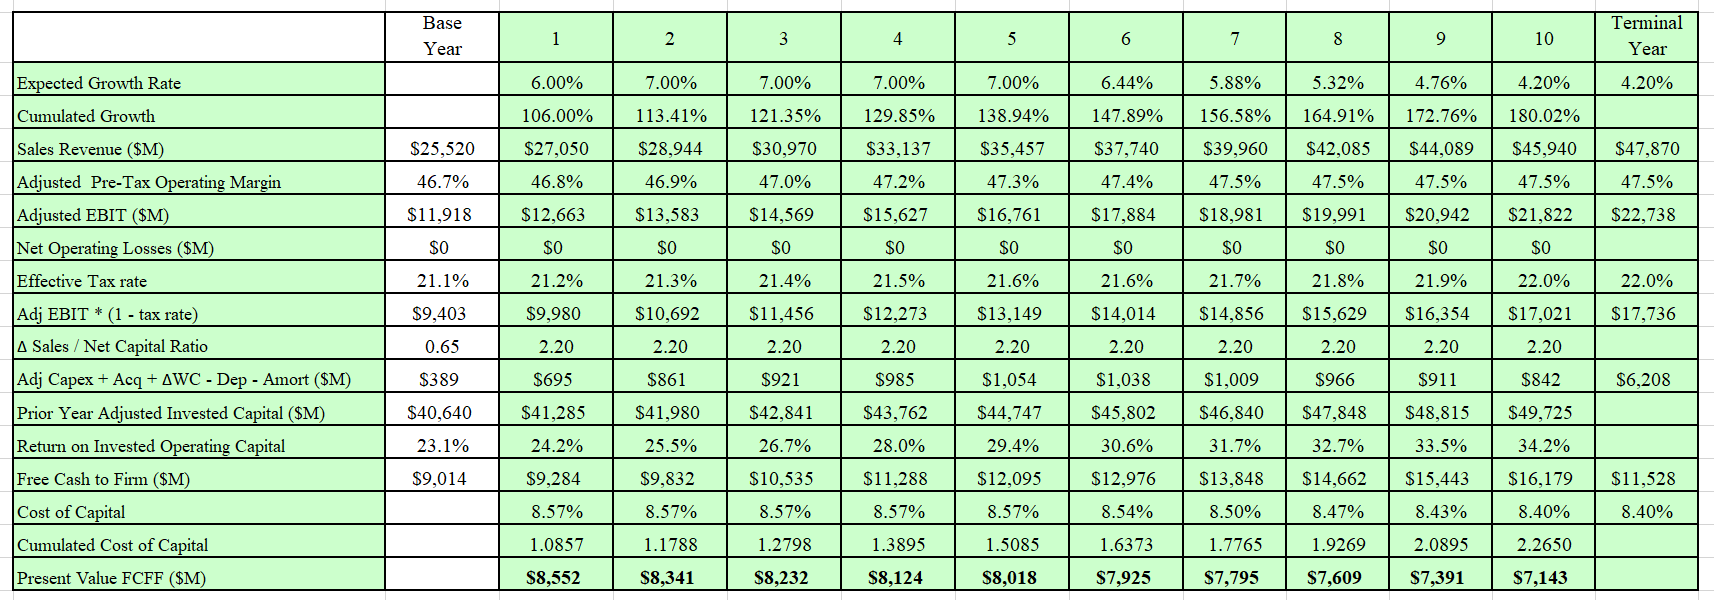
Discounted Cash Flow Valuation
The valuation has been performed in :
Author's model output. Author's model output.
The model estimates McDonald’s Equity Value is $159,911 M.
This equates to a mid-point value per share of around $220.
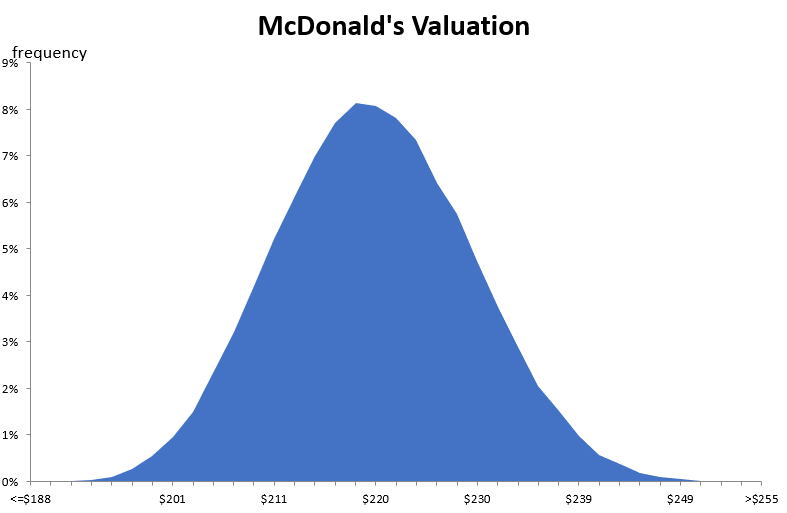
I also developed a Monte Carlo simulation for the valuation based on the range of inputs for the valuation. The output of the simulation is developed after 100,000 iterations.
The Monte Carlo simulation can be used to help us to understand the major sources of sensitivity in the valuation.
Author's valuation Monte Carlo simulation output.
The simulation indicates that the valuation is most sensitive to the cost of capital and the future sales growth.
Over the last 18 months McDonald’s cost of capital has increased in line with the increases in market interest rates. This would have caused the company's intrinsic value to fall.
I estimate that McDonald’s intrinsic value is between $188 and $255 per share with a typical value around $220.
This would indicate that McDonald’s is currently over-priced relative to its intrinsic value.
What Assumptions are Baked into the Current Price?
The Monte Carlo simulation indicated that the most influential inputs into the valuation are the forecast sales revenue and the cost of capital.
To shift McDonald’s intrinsic value towards the current market price the sales growth must be significantly higher than 6%, the cost of capital must be significantly lower than 8.4% or a combination of both. How realistic is this?
Revenue Growth
Dealing with the revenue growth first. McDonald’s is a relatively mature company in a highly fragmented but mature market. Prior to COVID, McDonald’s 5-year revenue CAGR was -4.9% (revenues were falling because there were less owned restaurants and more franchised sites). Post COVID has seen a move back to higher restaurant growth. This has resulted in ((TTM)) revenue growth at the end of Q3 FY2023 of 7.5%. The question is how sustainable is this level of growth?
My scenario is based on a revenue growth rate for the next 5 years of between 6% to 8%. It is possible that growth may be higher, but I think it is improbable given the company’s maturity.
Cost of Capital
I use the Capital Asset Pricing Model ((CAPM)) to estimate a company's cost of capital and I don’t wish to bore readers with the theory behind the model. In its most basic definition – the cost of capital represents an investor’s expected return on investments of equivalent risk.
Given the current macro environment (considering long-term interest rates and market volatility) I have estimated that investors will achieve a long-term annual return of 8.4% from an investment in McDonald’s if it was purchased at a stock price of $220.
The current stock price is closer to $280. If all other valuation inputs remained constant the current market price has an implied annual return of 7.4%.
The market risk-free rate today for long-term investments (defined as the US 10-year bond rate) is 4.2%. I would be concerned that the difference between the implied annual return of McDonald's today of 7.4% and the risk free rate of 4.2% may not be enough to compensate for the additional risks involved in an investment in McDonald's today.
Final Recommendation
My latest valuation is significantly higher than my past estimate as a result of the company's optimistic growth and margin story. Although the intrinsic value is higher it is still significantly lower than the current stock price.
My last recommendation for McDonald's to SELL was essentially correct. The table below demonstrates this to be the case when you compare the performance of the stock to the broader index:
Author's compilation using historical pricing data from Yahoo Finance.
There are two ways for an over-priced stock to trade back to its intrinsic value:
- the stock's price declines.
- or the stock trades sideways whilst the broader market advances.
McDonald's has essentially traded sideways over the last year whilst the market has had a spectacular year (acknowledging that the gains may have been in a relatively small number of stocks).
Over the long-term, holders of McDonald's have exceeded the broader market index but there have been periods where the stock has significantly under performed.
McDonald's stock price has been rising for the last 2 months. As the current price is significantly above my estimate of its intrinsic value, I think that holders should carefully consider their current portfolio allocation to the stock and consider trimming back their exposure when the current upward pricing momentum starts to decline.
McDonald's is an excellent company and a worthy addition to any portfolio at the right price. I suspect that there may be an opportunity in the coming months to buy the stock at lower prices.
I believe that the stock is a SELL .
For further details see:
McDonald's: New Growth Strategy Review