SPY - Merion Road Capital Q1 2023 Investor Letter
2023-04-26 12:47:00 ET
Summary
- Merion Road Capital Management LLC is a registered investment adviser. We focus on value-oriented investing through rigorous fundamental analysis of a company's operations.
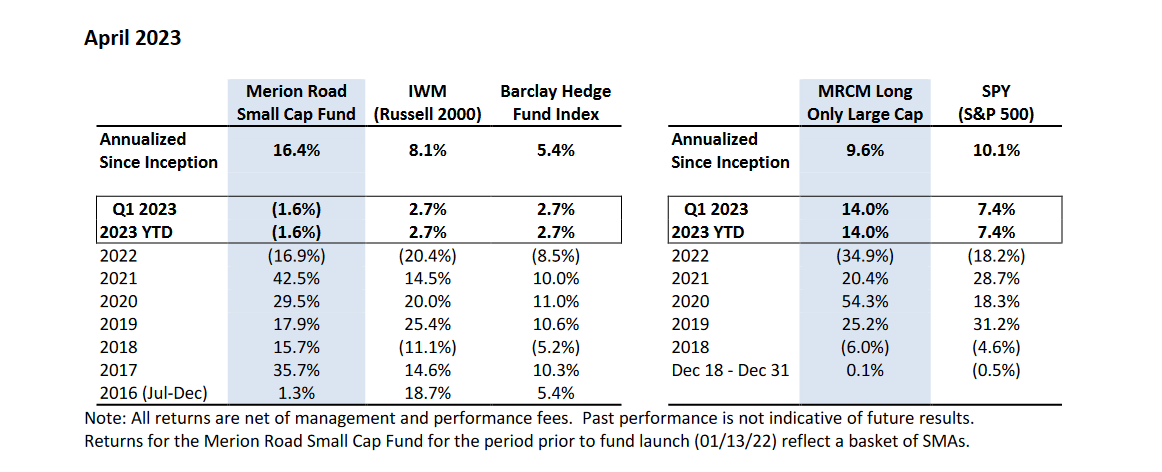
- The Long Only portfolio increased 14% during the first quarter.
- The Small Cap Fund fell (1.2%) during the first quarter.
- WCC seems ideally positioned to succeed in the current environment.
The Long Only portfolio increased 14% during the first quarter. Last year our higher quality “growth” companies were disproportionately hurt by rising rates – when this trend reverses, they stand to benefit the most. As the market began incorporating a pause or even a cut in the current rate hike cycle, several of these positions outperformed. Earnings for the names in our portfolio also skewed positive. For instance, Mueller Water Products (MWA), the new addition discussed in my last letter, produced an EBITDA margin 300bps higher in Q4 than in Q3. With relatively stable end-markets, the name of the game for them is getting margins back to reasonable levels. They still have some wood to chop but are heading in the right direction.
I started buying Wesco (WCC) at the end of last year. I continued adding this year and have made it a mid-level position. WCC is a $23bn distributor of electrical, communications, and utility products. They completed the acquisition of Anixter in 2020, which doubled the size of the company and gave them exposure to higher-growth end markets. By all accounts, this acquisition has been a home run. Cross-selling synergies initially targeted at $170mm hit over $700mm by end of 2022 and management is currently targeting $1.2bn. Similarly, cost savings set at $200mm within 3 years are expected to reach over $300mm in 2023.
WCC seems ideally positioned to succeed in the current environment. Their communications and security solutions division accounts for 30% of their revenue and will benefit from increasing demand of automation, connectivity (5G, LTE, remote/hybrid work), and digitalization. Utility and broadband represent another 29% of their revenue and will benefit from grid modernization, green energy, and rural broadband initiatives. The electrical and electronic solutions segment, representing 40% of revenue, is perhaps the most cyclical of the bunch. Revenue in this segment is split amongst construction, industrial, and original equipment manufacturers. Construction predominately serves non-residential projects and includes things like electrical, solar, and network/security projects which should grow over time. Industrial is relatively diversified across various industries including metals/mining, food/beverage, chemicals, and oil/gas. All three segments should benefit from increasing public sector infrastructure spending coming out of the $1.2 trillion Infrastructure Investment & Jobs Act, $369 billion Inflation Reduction Act, $53 billion CHIPS and Science Act, and $20 billion Rural Digital Opportunity Fund.
Management believes that they can achieve mid-single digit organic revenue growth which consists of base market growth plus a 1-2 percentage points for their secularly growing end-markets and another 12 for share gains. They have the goal of reaching 10% EBITDA margins which would bring them closer to other leading industrial distributors. While performance has been strong (revenue grew 18% last year organically and EBITDA margins expanded from 6.3% to 7.9%), the economic outlook is obviously a little more daunting. Using LTM figures WCC is trading at just 8x EPS. Management plans to allocate 40% of its operating cash flow to share returns (they have a $1bn share repurchase authorization which represents ~15% of market cap) with another 40% towards value creation through investments/M&A.
Before discussing the Small Cap Fund, I would like to highlight a market dynamic that I have noticed. If we look at equity indices segmented by company size an interesting pattern emerges. This year has seen a large divergence of performance based on company market cap (see A below). The same pattern holds true when examining index returns since the beginning of the current drawdown ((B)). This is not unique to the current environment, as smaller companies have typically underperformed their counterparts in other bear markets (C&D). This makes sense as smaller companies are generally more exposed to marginal changes in the economy and may have less access to credit. When the tide turns, this subsegment of the market that has gotten beaten up the most historically recovers faster; we can see that with the 1-year performance after covid ((E)) and the financial crisis ((F)).
| Index (ETF) |
| S&P 500 ( SPY ) |
| Russell 2000 ( IWM ) |
| Russell Microcap ( IWC ) |
| Average Market ($ Weighted) |
| $71.8bn |
| $2.9bn |
| $763mm |
| A: 2023 Year to Date |
| 7.4% |
| 2.7% |
| (2.8%) |
| B: Q1 2022 - Q3 2023 |
| (14.3%) |
| (20.8%) |
| (26.6%) |
| C: Q1 2020 |
| (19.9%) |
| (30.9%) |
| (32.6%) |
| D: Q3 2007-Q1 2009 |
| (47.9%) |
| (47.5%) |
| (54.3%) |
E: Q2 2020- Q1 2021 53.8% 93.0% 119.2% F: Q2 2009- Q1 2010 47.1% 61.2% 63.0%
I bring this up for two reasons. Firstly, I have always used the Russell 2000 as my benchmark (and I will continue to do so), but this helps to partially explain why things have been challenging. The second is a reminder that, if we look ahead, the current bearishness in small/micro-cap names will provide some good opportunities for attractive prospective returns.
The Small Cap Fund fell (1.2%) during the first quarter. As an example of the above dynamic, our position in RF Industries (RFIL) fell almost 14% in the quarter. RFIL is a manufacturer and distributor of RF connectors and cables, and custom copper and fiber assemblies. New management came in 5 years ago and have grown the company through acquisitions. I think of the business in two buckets. The largest and most profitable has been their distribution business of more basic products into the telecom market. This includes things like coax cables, connectors, and hybrid fiber optic cables. The second bucket is their specialized product business which includes the production of thermal cooling control systems and small cell shrouds. While the “basic” business has produced relatively stable growth and profitability, the “specialized” business has yet to find the promised land.
The company is being overly penalized for losses in the “specialized” business. Their “RF Connector & Cable Assembly” segment is generating around $40mm in revenue at ~10% EBITDA margins, so $4mm in EBITDA. Their “Custom Cabling Manufacturing & Assembly” segment produced $54mm of revenue last year but only $2.9mm of EBITDA (a 5.4% margin). More importantly, revenue came in at just $9mm last quarter and EBITDA was a loss of $0.8mm. Simplistically we can say that the value of the RF business is being dragged down by losses in their Custom business. But the Custom business consists of their profitable hybrid fiber product line as well as the troubled cooling/small cell ones. We do not have a breakout of the two, but we do know that this segment produced $7.6mm of EBITDA in 2018 and $3.9mm in 2019 before they acquired Schroff Tech (the original cooling/small cell manufacturers).
The million-dollar question is when to pull the rip cord on cooling/small cell. While it has a great story, the company just has not been able to execute on it. My preference would be for them to sell the division and not get caught up in the sunk cost fallacy. Management has always been thoughtful and I believe they are taking the right steps. For instance, they are in the process of streamlining operations by consolidating their West Coast operations into one facility and will do the same to the East Coast operations later this year. They have outlined $3mm of annualized savings when all is said and done. To be clear, I am not underwriting an incremental $3mm to the bottom line, but am encouraged by these operational initiatives.
Now one might ding RFIL for acquiring Schroff Tech as it was clearly a swing and a miss. It is important to keep in mind that this was a relatively small acquisition at just $4mm. More recently, they acquired another RF component business, Microlab, for $25mm funded with cash on the balance sheet and 5-year debt fixed at 3.76%. Revenue and earnings from Microlab have rebounded from when they acquired it in 2020 and it appears that they bought it for just 4-5x EBITDA. The Chairman of the Board and largest shareholder is Mark Holdsworth, a co-founder of Tennenbaum Capital Partners (a multi-billion dollar private equity firm). In summary, I think we have an attractively priced business with a good management team and proven capital allocator. With a little patience, I think we can see earnings and valuation recover to more reasonable levels.
Sincerely ,
Aaron Sallen
General Disclaimer
This material does not constitute an offer or the solicitation of an offer to purchase an interest in Merion Road Small Cap Fund, LP (the “ Fund ”), which such offer will only be made via a confidential private placement memorandum (the “ Memorandum ”). An investment in the Fund is speculative and is subject to a risk of loss, including a risk of loss of principal. There is no secondary market for interests in the Fund and none is expected to develop. No assurance can be given that the Fund will achieve its objective or that an investor will receive a return of all or part of its investment. All statements herein are qualified in their entirety by reference to the Memorandum, and to the extent that this document contradicts the Memorandum, the Memorandum shall govern in all respects.
This material is confidential and may not be distributed or reproduced in whole or in part without the express written consent of Merion Road Capital Management, LLC (the “ Investment Manager ”). The information and opinions contained in this document are for background purposes only and do not purport to be full or complete. Unless otherwise stated, the information in this document is not personalized investment advice or an investment recommendation on the part of the Investment Manager.
The performance data discussed herein do not represent the performance of the Fund, but rather, represent the unaudited performance of a basket of separately managed accounts managed by the Investment Manager pursuant to the same strategy expected to be implemented for the Fund. Results generated in the Fund once outside capital is admitted could be materially different than those results shown. The results shown reflect the deduction of: (i) an annual asset management fee of 1.5%, charged quarterly; (ii) a performance allocation of 15%, taken annually, subject to a “high water mark;” and (iii) transaction fees and other expenses actually incurred. The management fee and performance allocation were applied retroactively and do not reflect actual fees charged. None of the results shown reflect the deduction of certain organizational and operating expenses common to investment funds, which would serve to decrease profits or otherwise increase losses. Results were achieved using the investment strategies described in the Memorandum.
Results are compared to the performance of the Russell 2000 Index, the Russell Micro-cap Index, and the Barclay HF Index (collectively, the “ Comparative Indexes ”) for informational purposes only. The Fund’s investment program does not mirror any of the Comparative Indexes and the volatility of the Fund’s investment program may be materially different from the volatility of the Comparative Indexes. The securities included in the Comparative Indexes are not necessarily included in the Fund’s investment program and criteria for inclusion in the Comparative Indexes are different than criteria for investment by the Fund. The performance of the Comparative Indexes reflects the reinvestment of dividends, as appropriate.
This material contains certain forward-looking statements and projections regarding market trends, investment strategy, and the future asset allocation of the Fund, including indicative guidelines regarding position limits, exposures, position sizing, diversification, and other indications regarding the Fund’s strategy. These projections and guidelines are included for illustrative purposes only, are inherently predictive, speculative, and involve risk and uncertainty because they relate to events and depend on circumstances that will occur in the future. The guidelines included herein do not reflect strict rules or limitations on the Fund’s investment program and the Fund may deviate from the guidelines described herein. There are a number of factors that could cause actual events and developments to differ materially from those expressed or implied by these forward-looking statements, projections, and guidelines, and no assurances can be given that the forward-looking statements in this document will be realized or followed, as described. These forward-looking statements will not necessarily be updated in the future.
PAST PERFORMANCE IS NOT NECESSARILY INDICATIVE OF FUTURE RESULTS.
Editor's Note: The summary bullets for this article were chosen by Seeking Alpha editors.
For further details see:
Merion Road Capital Q1 2023 Investor Letter