CA - Metalla Royalty & Streaming: All Streamers Are Not Created Equal
2023-10-05 12:12:19 ET
Summary
- Metalla Royalty & Streaming Ltd. announced a merger with Nova Royalty Corp., causing a significant drop in stock price.
- The merger is an attempt by Metalla to enter the copper market and expand its portfolio.
- Metalla reported revenues of $0.96 million for Q2 2023, with a net loss of $0.49 million. Free cash flow is $0.77 million.
- I recommend buying cautiously Metalla Royalty & Streaming Ltd. shares between $2.95 and $2.80, with possible lower support at $2.70.
Introduction
On August 11, 2023, the Vancouver, British Columbia-based Canadian Metalla Royalty & Streaming Ltd. (MTA) announced its operating and financial results for the second quarter of 2023.
Also, on September 8, 2023, the company announced its merger with Nova Royalty Corp. (NOVR:CA) (NOVRF). Brett Heath, President and CEO of Metalla, stated:
We are very excited about the combination of these businesses. This merger represents a transformative moment for both companies and will lay a clear, low-risk path to becoming an intermediate royalty company. Together, we expect that our peer-leading, high-quality growth, underpinned by some of the best-in-class operators in the mining sector, will deliver superior long-term value for our shareholders.
The only party "excited" about such a merger seems to be the management, judging by its caustic effect on the stock price. Nova shareholders will have approximately 40% ownership in the combined company.
MTA Merger Goal (MTA Presentation)
Following the merger, MTA announced a special dividend payment on the Common Shares, for C$0.03 per share, paid on September 15, 2023.
MTA dropped significantly after the deal was announced, whereas Nova Royalty fared a little better, losing only 16% YoY.
Note: This article updates my article published on June 18, 2023. I have followed MTA on Seeking Alpha since December 2020.
1 - Stock performance
Metalla Royalty & Streaming Ltd. has tumbled 32% on a one-year basis and is now one of the worst performers in the group. The company has used its stock to finance its expansion and entered into a merger with Nova, significantly diluting shareholders in the process.
It is the same strategy used at Sandstorm (SAND) or Gold Royalty (GROY), which produced the same dilutive effects. SAND, GROY, and MTA are the only stocks down significantly YoY (see below), with GROY winning the contest with a drop of 55%.
Note: I recommend reading my article on all the streamers indicated below by clicking here, and especially my recent GROY article here.
2 - Merger Thesis
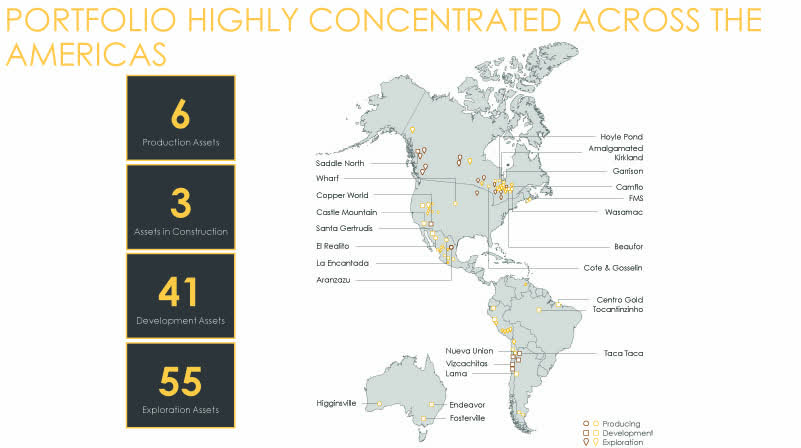
MTA remains in development despite owning 105 assets as of September (including 23 assets from Nova Royalty).
MTA Map Assets Pre-Merger (MTA Presentation)
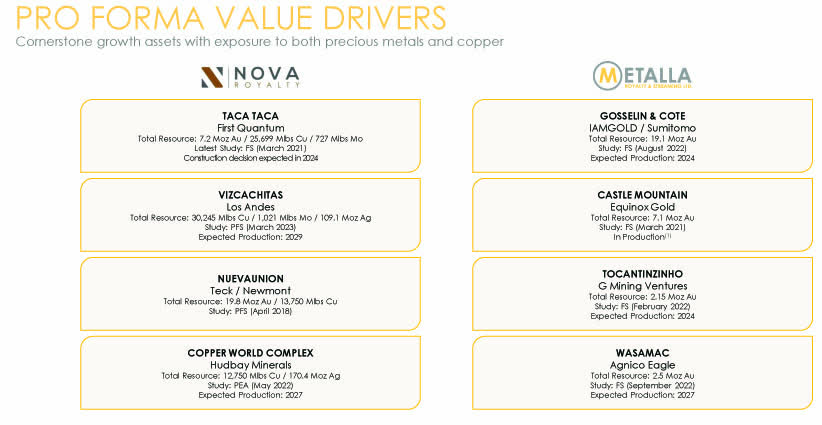
The merger with Nova is mainly an attempt to enter the copper market that the company viewed as "at the core of all electrification and decarbonization technologies for the 21st century and is projected to become the lifeblood of the new economy."
MTA Main Royalties List (MTA Presentation)
Note: The new MTA will generate Cash Flow from Aranzazu royalty (copper, gold, silver) , along with Tocantinzinho, Côté Gold, and Amalgamated Kirkland royalties, expected to commence cash flow in 2024.
Concurrent with closing the transaction, Beedie Capital has agreed, among other things, to increase the loan facility from C$25.0 million to C$50.0 million.
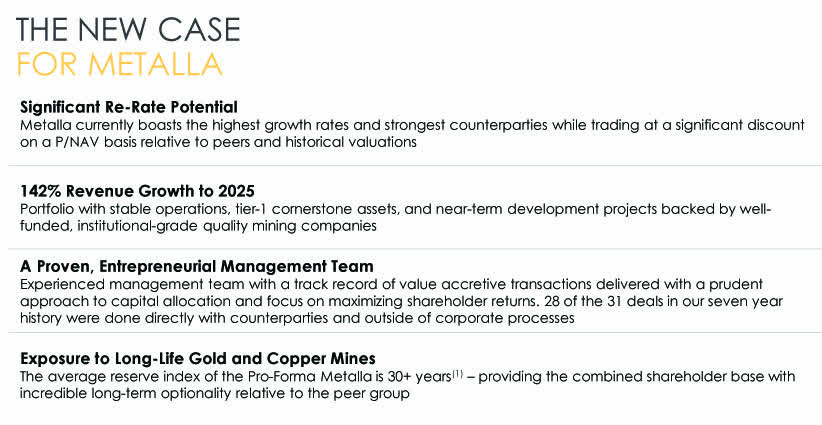
Despite what the company has said about this merger and the estimated "142% revenue growth to 2025," I am very skeptical that this ill-timed transaction will benefit common shareholders.
It is another dilution exacerbated by the Beedie Capital's agreement. As always, shareholders are not part of the equation for such early-stage development companies.
Thus, due to the high risk of dilution, I do not recommend MTA as a long-term investment, expecting more acquisitions and financings along the way.
Thus, the best way to profit from such a volatile stock is to trade short-term LIFO of about 85+% of your total position and use ONLY the short-term gain to build up a derisked long-term position, hoping for an elusive success story down the road.
Metalla Royalty & Streaming Ltd.: 2Q23 Financial Snapshot History - The Raw Numbers
Note: The numbers are indicated in .
| Metalla Royalty |
| 2Q22 |
| 3Q22 |
| 4Q22 |
| 1Q23 |
| 2Q23 |
| Total Revenues in $ Million |
| 0.46 |
| 0.66 |
| 0.63 |
| 0.98 |
| 0.96 |
| Net Income in $ Million |
| -1.37 |
| -2.54 |
| -4.79 |
| -1.36 |
| -0.49 |
| EBITDA $ Million |
| -0.74 |
| -1.65 |
| -4.11 |
| -0.44 |
| 1.41 |
| EPS diluted in $/share |
| -0.03 |
| -0.06 |
| -0.10 |
| -0.03 |
| -0.01 |
| Operating Cash Flow in $ Million |
| 0.12 |
| 0.32 |
| -0.18 |
| 0.16 |
| 0.80 |
| Capital Expenditure in $ Million |
| 0.00 |
| 0.12 |
| 0.35 |
| 2.82 |
| 0.03 |
| Free Cash Flow in $ Million |
| 0.12 |
| 0.20 |
| -0.53 |
| -2.66 |
| 0.77 |
| Total Cash $ Million |
| 3.37 |
| 3.30 |
| 4.56 |
| 4.80 |
| 11.71 |
| Total Long-Term Debt in $ Million |
| 10.81 |
| 10.29 |
| 10.59 |
| 10.50 |
| 7.87 |
| Shares Outstanding (diluted) in Million |
| 44.58 |
| 44.83 |
| 45.50 |
| 50.51 |
| 52.22 |
| Producing assets |
| 2Q22 |
| 3Q22 |
| 4Q22 |
| 1Q23 |
| 2Q23 |
| Gold in GEOs |
| 560 |
| 714 |
| 683 |
| 927 |
| 856 |
| GoldCashivalent price realized |
| 1,844 |
| 1,714 |
| 1,715 |
| 1,836 |
| 1,945 |
Data Source : The company's financial report .
Gold Production and Balance Sheet Details (in )
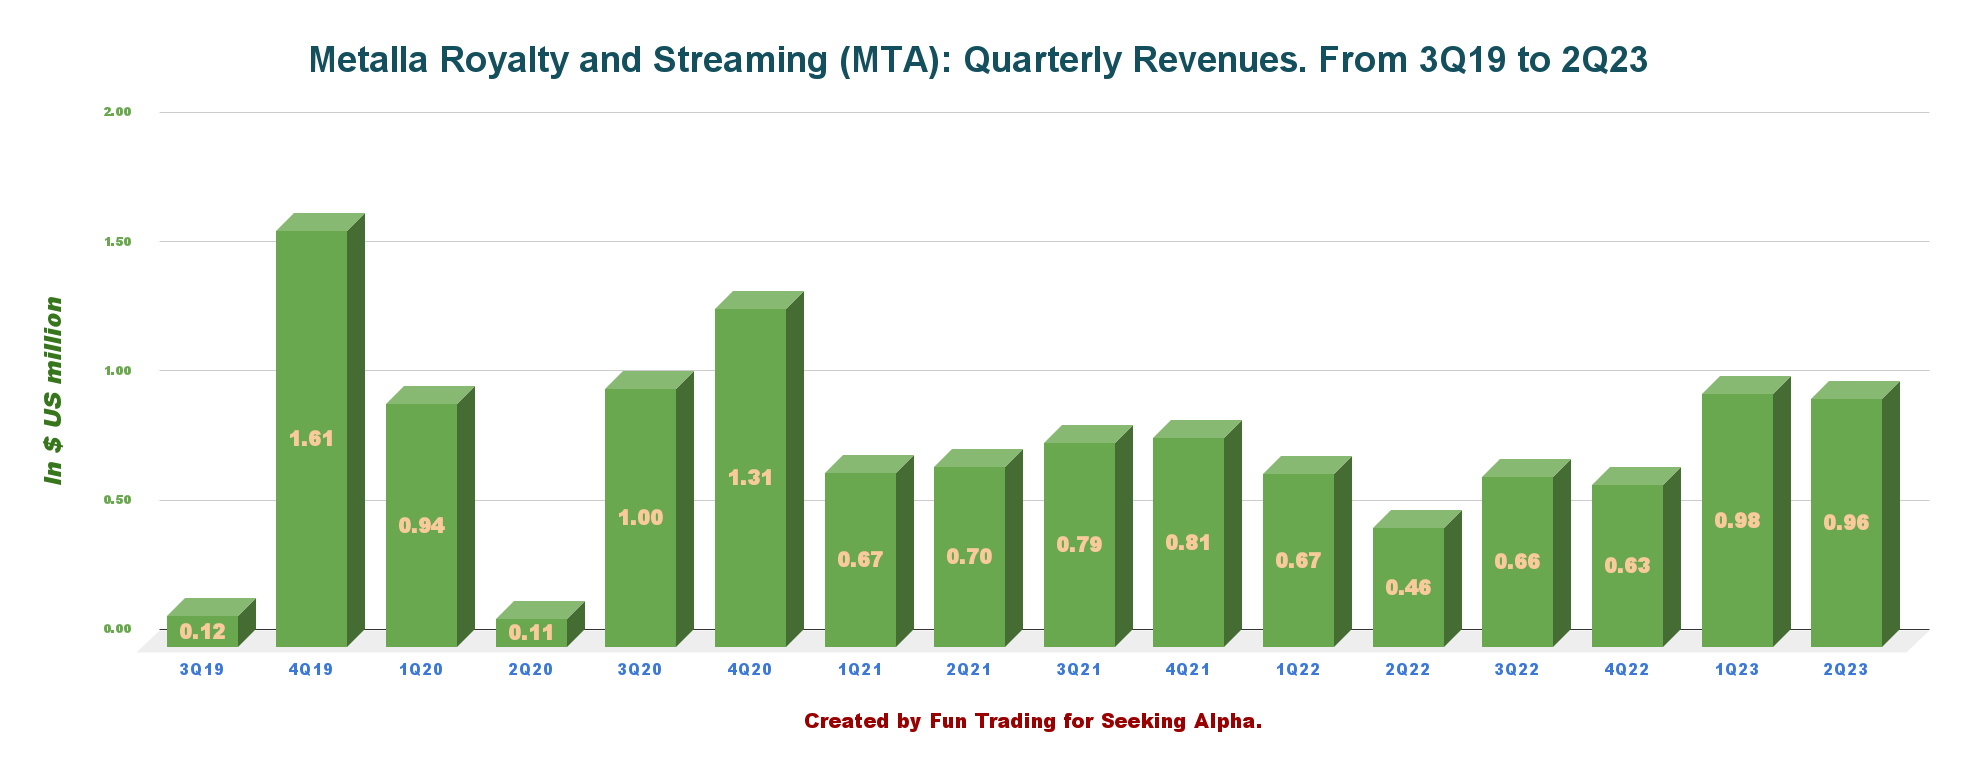
1 - Revenues were $0.96 million for the Second quarter of 2023
MTA Quarterly Revenue History (Fun Trading)
Revenues for the second quarter of 2023 were $0.96 million , up from $0.46 million in the same quarter a year ago and down from $0.98 million in 1Q23. Net loss was $0.49 million in 2Q23.
For the three months ended June 30, 2023, MTA generated an operating cash margin of $1,937 per attributable GEO.
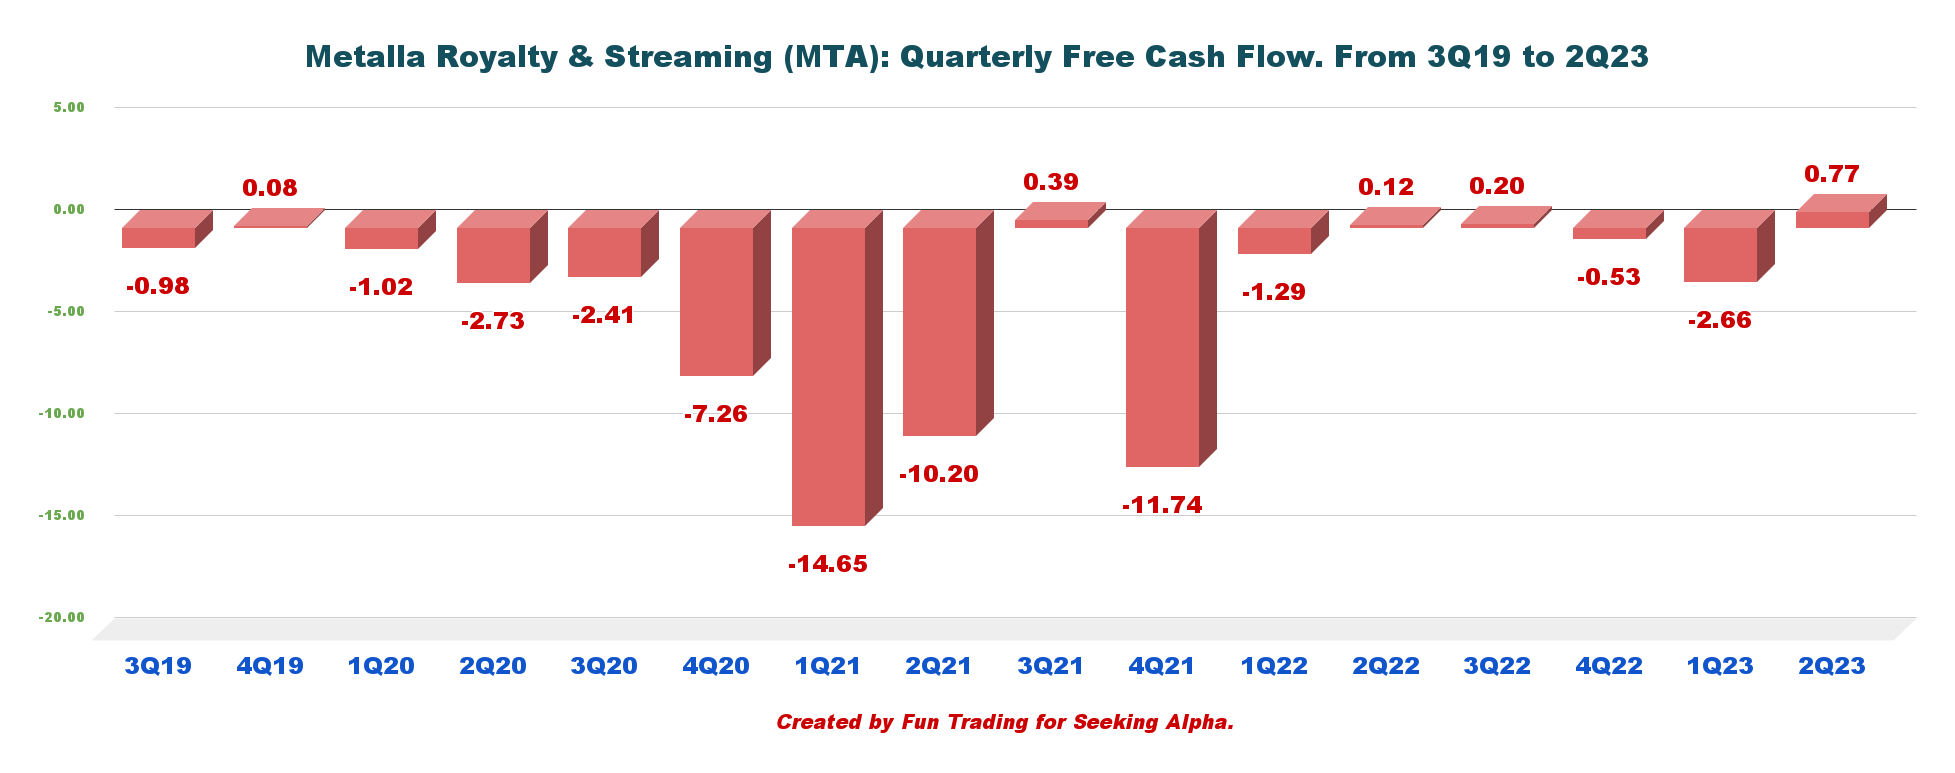
2 - Free cash flow was $0.77 million for 2Q23
MTA Quarterly Free Cash Flow History (Fun Trading)
Note: Generic free cash flow is the cash from operations minus CapEx.
In my preceding article, I explained that Metalla Royalty & Streaming is in the expansion phase that will probably last several years. The company is not generating free cash flow on a one-year basis.
During the quarter ending June 30, 2023, free cash flow was $0.77 million. Trailing 12-month free cash flow is negative $2.22 million.
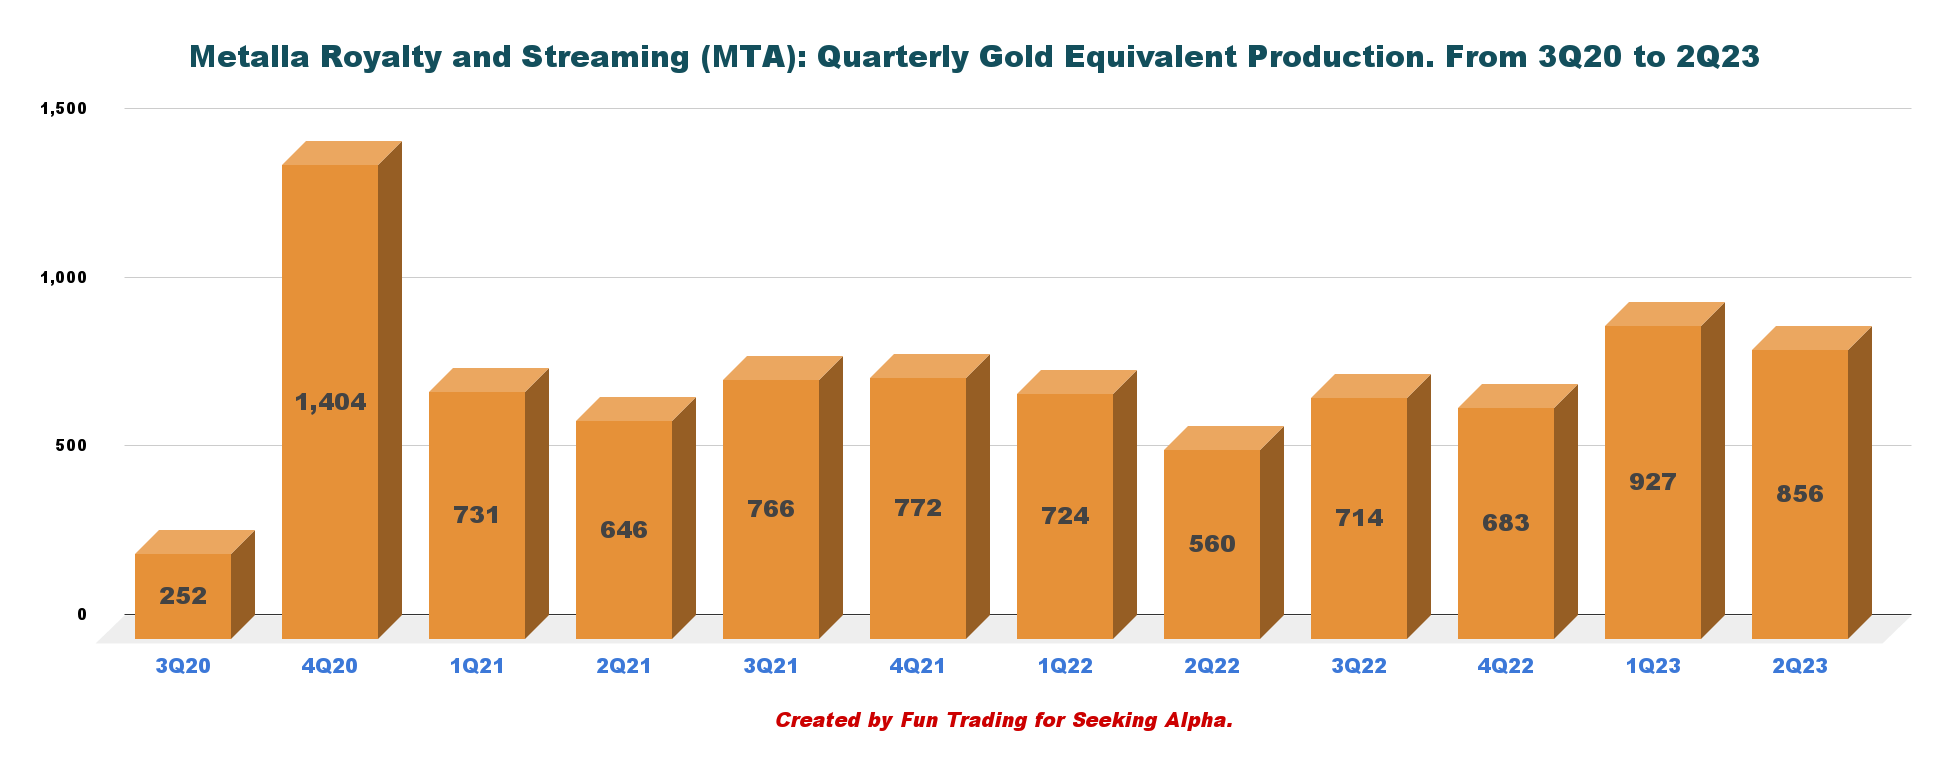
3 - Gold equivalent production details. Total production was 856 GEOs in 2Q23.
MTA Quarterly Production History (Fun Trading)
The gold equivalent production was 856 GEOs in 2Q23 at a cash margin of $1,937 per GEO .
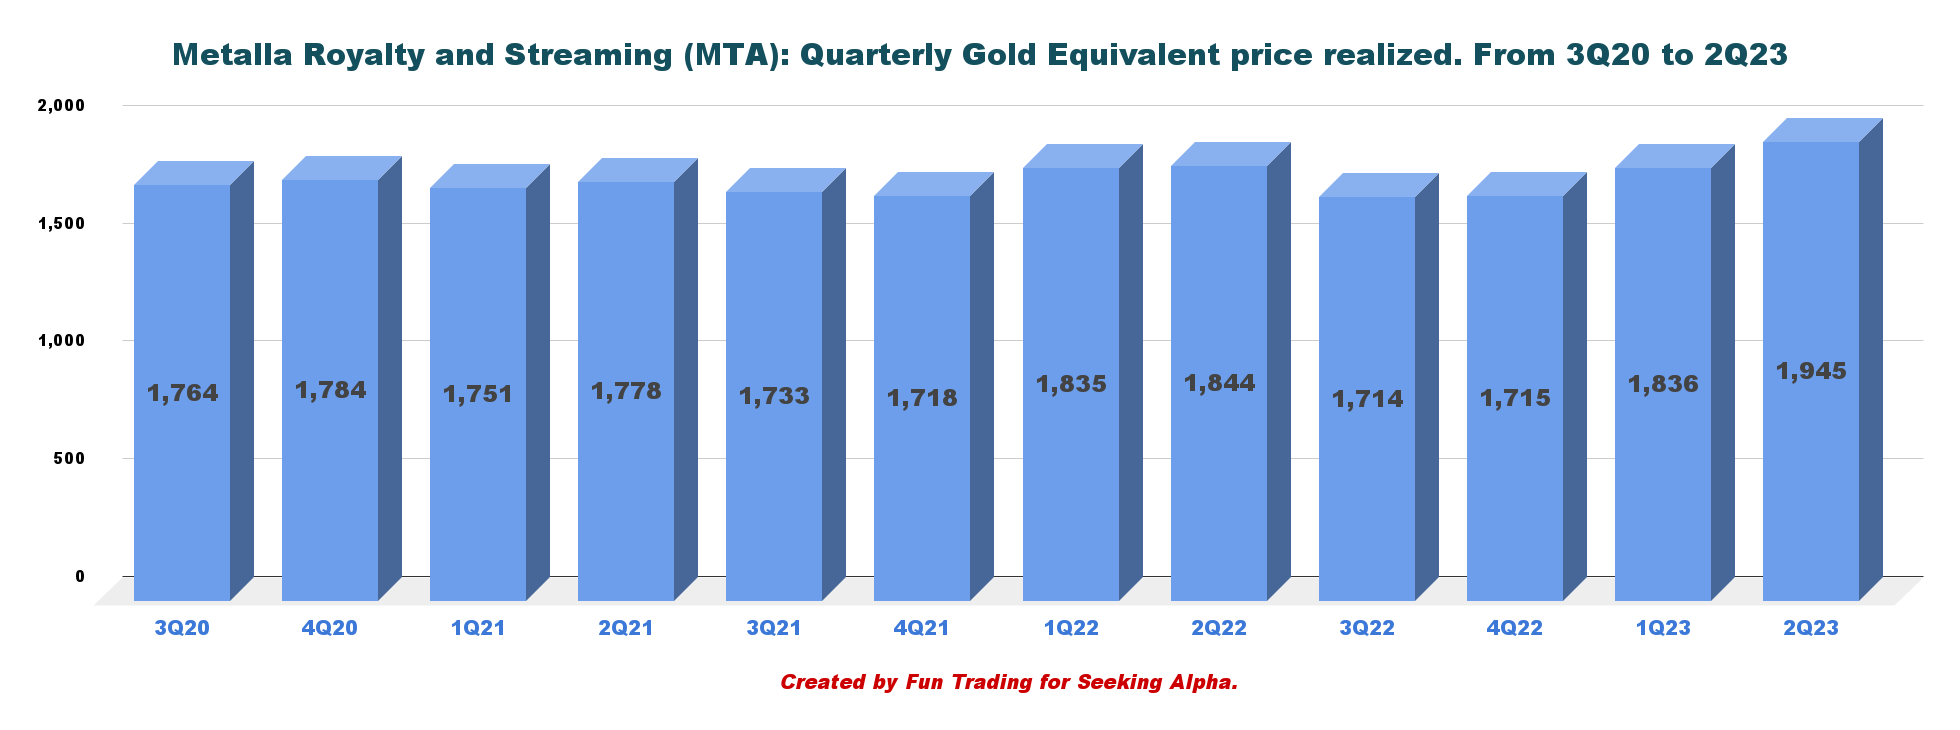
Gold was sold at $1,945 per ounce in 2Q23.
MTA Quarterly Gold Price History (Fun Trading)
Production Details in 2Q23:
- Higginsville 377 Geos
- Wharf 159 Geos
- El Realito 233 Geos
- La Encantada 55 Geos
- NLGM 32 Geos.
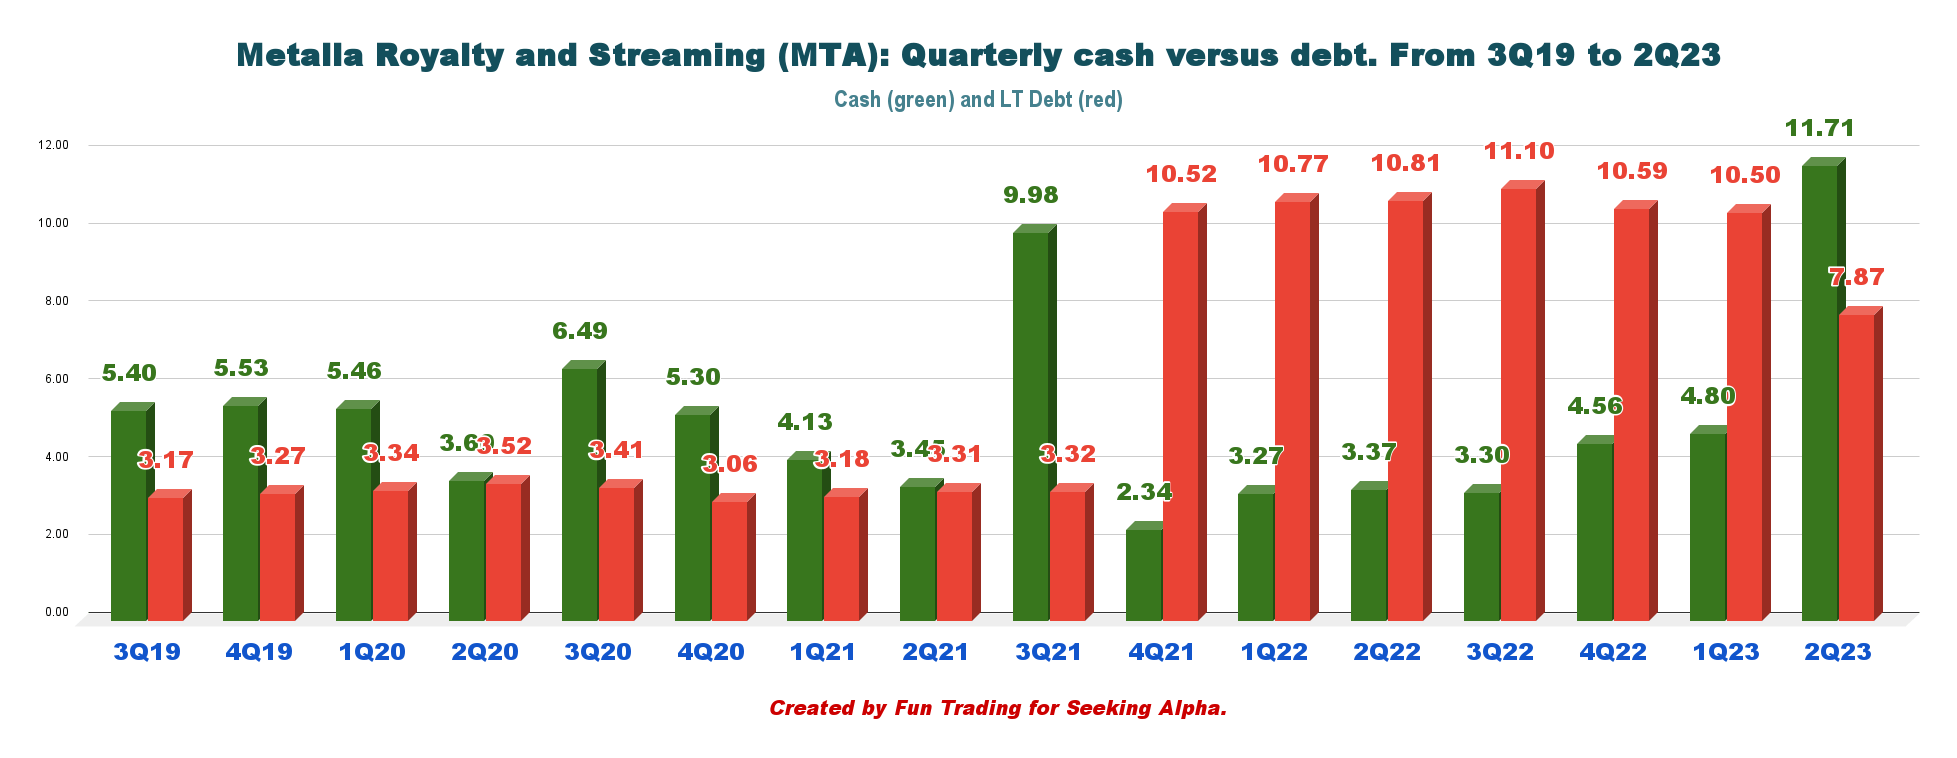
4 - Cash and debt Pre-merger
MTA Quarterly Cash versus Debt History (Fun Trading)
Cash on hand is $11.71 million , and long-term debt was $7.87 million at the end of June 2023. The debt and cash situation will be clearer in 3Q23.
Technical Analysis (Short Term) and Commentary
MTA TA Chart (Fun Trading StockCharts)
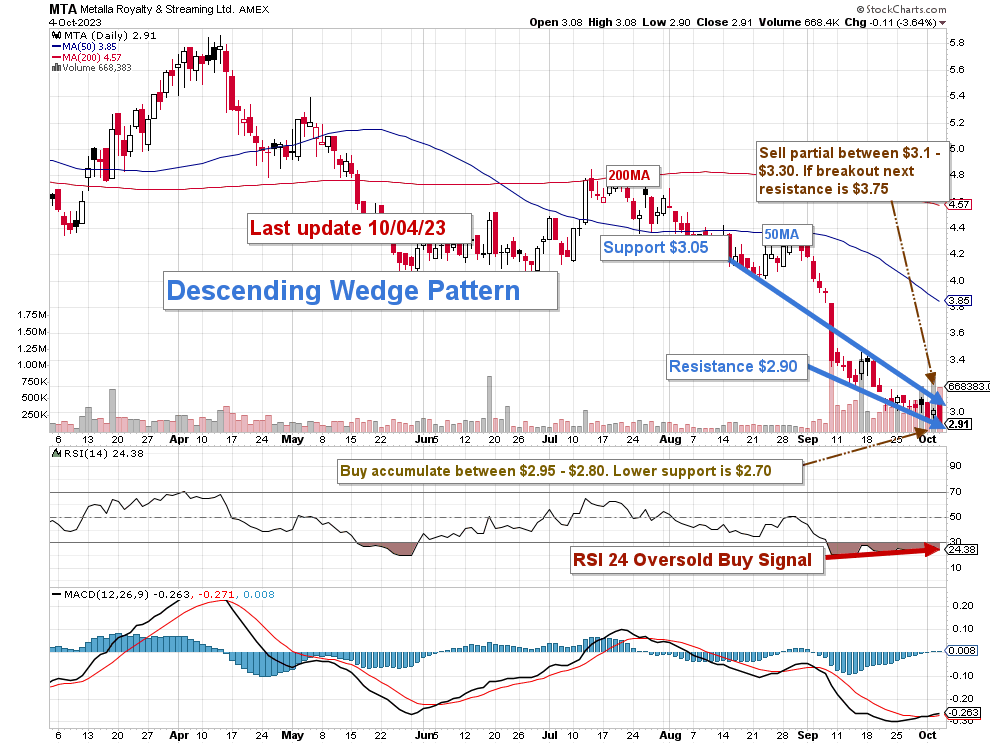
MTA forms a descending or falling wedge pattern, with resistance at $3.05 and support at $2.90. RSI is oversold at 24, indicating a buy signal.
The Falling Wedge is a bullish pattern that suggests potential upward price movement .
The overall basic strategy is to keep a small core long-term position and use about 85+% to trade LIFO while waiting for a higher final price target to sell your core position. MTA is a very small streamer and fluctuates wildly, and trading a large part of your position is perfectly adapted to this situation.
I recommend selling a part of your position at $3.10 to $3.30, with a potential higher target of $3.75. I believe buying between $2.95 and $2.80 is reasonable, with possible lower support at $2.70.
Watch gold like a hawk.
Warning: The TA chart must be updated frequently to be relevant. It is what I am doing in my stock tracker. The chart above has a possible validity of about a week. Remember, the TA chart is a tool only to help you adopt the right strategy. It is not a way to foresee the future. No one and nothing can.
For further details see:
Metalla Royalty & Streaming: All Streamers Are Not Created Equal