CA - Moon Capital Management Q2 2023 Letter
2023-07-21 02:00:00 ET
Summary
- Moon Capital Management, LLC is a SEC Registered Investment Adviser. Moon Capital helps individuals, families and institutions meet their financial goals by providing a full range of investment management and planning services.
- Our stock portfolio increased approximately 11% in the first half of 2023 but trailed the index by approximately 4 percentage points.
- During the second quarter, we fully liquidated two of our positions: title insurer First American Financial and bank software services provider MeridianLink.
Dear clients and fellow shareholders:
The 15% S&P 500 increase during the first half of 2023 caught most pundits off guard - a fact that likely says much more about pundits than the stock market itself. (In December, the median forecast of 41 strategists polled by Reuters was a 6% return for the S&P 500 for the year.) It serves as a reminder of the substantial risk long-term investors assume when they try to predict short-term movements in stock prices - regardless of whether their forecasts are based on politics, the economy, underlying business fundamentals, the Federal Reserve, or the outcome of the Super Bowl.
Just as it is dangerous to be invested in overpriced securities or in companies with questionable business or financial fundamentals, it can be equally as dangerous to avoid investments altogether, as the performance of the market in the first half of this year demonstrates.
After several years of handily outpacing the S&P 500, our stock portfolio, which increased approximately 11% in the first half of 2023, trailed the index by approximately 4 percentage points. If we are going to have periods when we trail the market (which we will), it's nice to do so while earning more than 11% in 6 months.
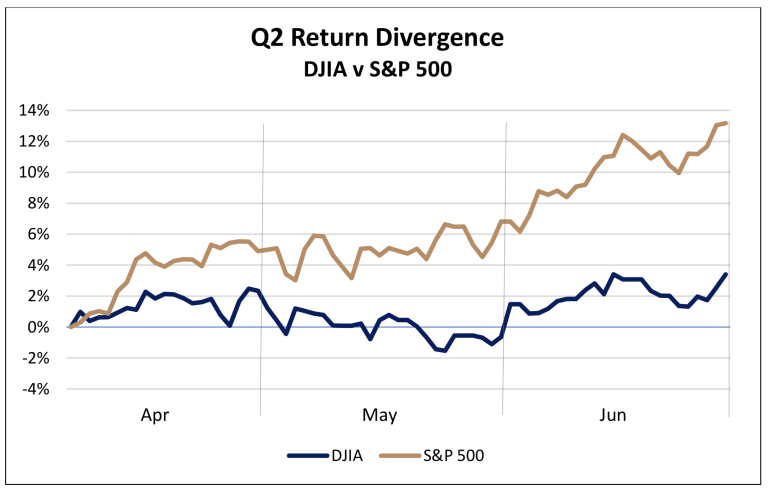
We aren't quite sure what to make of the hugely divergent first-half returns among different U.S. stock indices, as the Nasdaq return (31.7%) was twice that of the S&P 500 (15.9%), which increased more than twice the Russell 2000 (7.3%), which returned twice the Dow Jones Industrial Average (3.8%).
Most investment banks continue to forecast corporate earnings declining this year, while short-term interest rates linger at 20-year highs. This doesn't seem like the most logical 6-month period for the S&P 500 to produce more than a (normal) year's worth of appreciation, but the stock market has a unique capacity for defying expectations.
Investor reaction to extraordinary stock price moves is both curious and interesting. Relying on misapplied academic studies, many professional investment helpers ascribe to the notion that volatility is a measure of risk. Individual investors, by contrast, most often only consider downside volatility as a risk, and assume that upside volatility is the normal state. They are both wrong.
A dive into the characteristics of the stocks within the various indices provides an explanation of the divergence of the index returns. In a reversal of several years of outperformance of value stocks vs. growth stocks, in the second quarter, investors gravitated to the most price-risky securities. Stocks trading at the highest prices relative to earnings have produced the highest performance this year, while the lowest returns have been among the companies in the lowest two P/E quintiles. (The risk divergence was also evident in the bond market, as the Bloomberg high yield (that is, junk) bond index increased 11% in the first half of the year, more than 10 times the 1% return of the index of high-quality, investment-grade bonds.)
When stock price swings are extraordinary in either direction, it is an objective reminder that the stock market is inefficient. It also reminds us that investors, in total, are a schizophrenic lot, susceptible to unpredictable vacillations between overexuberance and illogical pessimism. And when the swings are most extreme - in either direction - it creates opportunity, not risk - and we used the recent opportunity to make a number of changes to our stock portfolio.
Portfolio liquidations
During the second quarter, we fully liquidated two of our positions: title insurer First American Financial ( FAF ) and bank software services provider MeridianLink ( MLNK ) . We sold our shares of First American Financial with a small gain, while we lost approximately 20% on our Meridianlink investment.
Although residential housing pricing has remained relatively strong, the business models of both FAF and MLNK are, to a certain degree, reliant on housing transaction volumes. In most environments, these high-margin royalty streams make for attractive business models. Today, however, both companies are swimming upstream against a heavy interest rate current.
Over the past year, transaction volume in the residential market has moved materially lower and the market for refinancing has nearly dried up. In fact, the second half of 2022 marked the largest decline in home sales ever recorded in U.S. history. Mortgage applications recently hit a 28-year low, as more potential buyers have chosen to stay in their current homes instead of moving.
We suspect that refinancing will likely experience a multiyear period of weakness because most homeowners can no longer refinance at lower rates. As noted in a recent Wall Street Journal piece, roughly 14 million homeowners have mortgage rates below 3% and another 20 million have rates between 3-4%. Combined, these groups represent two-thirds of all primary mortgages . Given the unfavorable macro backdrop for businesses reliant on mortgage transaction volume, we chose to redeploy our capital away from FAF and MLNK.
A purchase: First Horizon Corporation ( FHN )
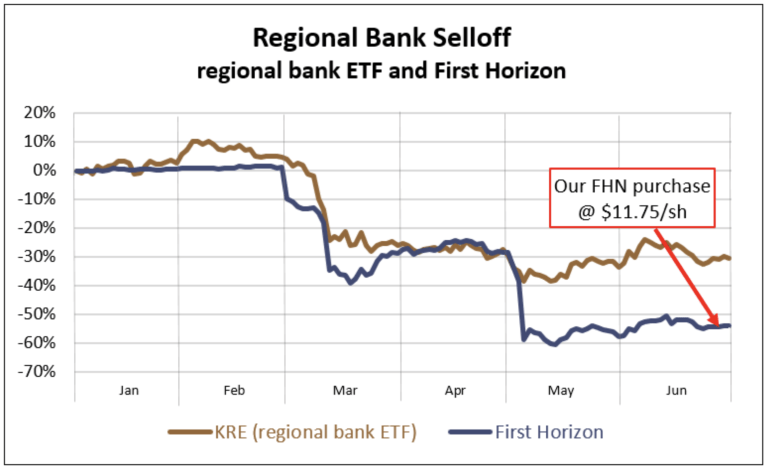
Last quarter, we discussed several banks that fell victim to the Federal Reserve's rapid raising of interest rates. With three banks having been recently put into receivership and many others struggling due to misplaced interest rate bets, it is easy to see why many observers are bearish on the entire banking industry. From its high, this February, the S&P Regional Banking ETF ( KRE ) was off 43% at its low in May, its largest drop since the 50% selloff during the 2007-09 Great Financial Crisis. What has been largely absent from the discussion of company-specific banking woes and larger systemic risks such as deposit runs has been the mention of industry profitability as a whole. Given the overall negative news about U.S. banks, few would guess that bank profits reached an all-time high of $80 billion in the first quarter of this year. Adjusting for one-time gains related to the acquisition of banks in receivership, earnings are up 15% year-over-year. This earnings strength stems from the very factor that has left some banks on life support: the surge in interest rates. While this rise spells catastrophe for banks that loaded their portfolios with long-duration, fixed-rate investments, it benefits banks that were properly positioned, as it allows them to earn higher interest income. As banking analyst Steve Eisman aptly summed up the current situation "We are not having a banking crisis. We are having a crisis with certain banks."
Historically, most bank failures were caused by credit losses, an issue that was largely absent in the three high-profile bank failures earlier this year. While there are looming concerns about weakness in the commercial office market (an area in which many regional banks are generally overexposed - more on that below), non-performing loans have yet to jump materially, and banks are better capitalized and hold more liquidity than in times preceding prior crises. Commercial real estate defaults are likely to increase in the coming years, but most banks are well-provisioned for potential increases. Despite the economy having yet to experience any meaningful credit cycle stress, shares of regional banks have largely collapsed, creating a situation that offers some unique opportunities.
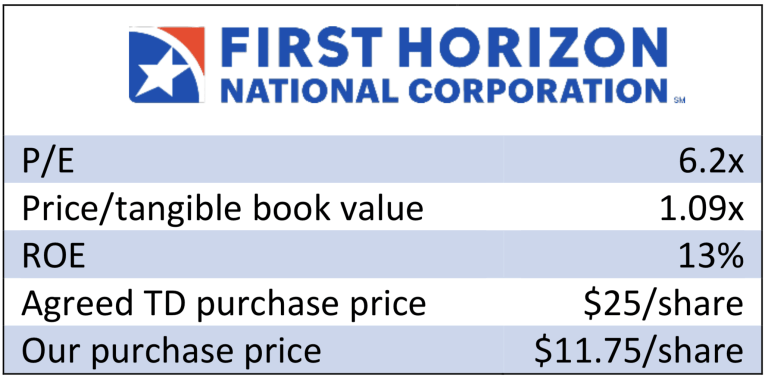
We took advantage of the indiscriminate selloff in regional bank stocks and purchased shares in First Horizon Corporation ((FHN)) following the termination of its merger agreement with Toronto-Dominion Bank ( TD ). By our judgment, First Horizon fits squarely in the group of banks set to perform well in the current rate environment - those with robust deposit bases that operate in pro-growth markets and carry significant variable rate loans. We view First Horizon as even further discounted than its cheap peer group, solely due to the uncertainty surrounding the unsuccessful TD merger; we expect that this discount will be resolved over time.
Finally, FHN's exposure to the commercial office market is much smaller and diversified differently than the typical regional bank.
We purchased our shares at prices around First Horizon's tangible book value which, when adjusted for the $225 million fee Toronto Dominion paid to terminate the merger agreement, is roughly $11.70 per share. As a well-run bank that consistently posts returns on equity in the mid-teens, FHN has historically traded well above book value (typically 1.5-2x). For reference, at the time of the merger offer, TD was eager to pay 2.1x tangible books for the company.
When the merger fell through, FHN's price dropped more than 50%, allowing us to buy our shares at approximately tangible book value - and less than half of what TD originally agreed to pay. While both earnings and book value multiples have compressed among regional banks, First Horizon is still positioned to earn well more than $1 billion annually. With a current market capitalization of around $6 billion, this equates to a P/E ratio of six.
Over the past few years, FHN has executed admirably. Instead of extending the duration of its portfolio when yields were near all-time lows, the company parked excess cash at the Fed, which temporarily reduced earnings. Avoiding this reach for yield has paid off, as it has left the bank with minimal "held-to-maturity" losses, which is not the case for many banks. First Horizon has also properly positioned its loan book to benefit from higher rates. In the most recent quarter, the company's net interest margin increased 150 basis points year-over-year, helping it generate a return on equity of 17% (19%, if adjusted for acquisition-related costs).
First Horizon has a valuable deposit franchise with a large base of sticky, noninterest-bearing deposits. In the most recent quarter, the company's total deposit cost was 111 basis points, which allowed it to earn a net interest margin approaching 4%. As a 100-year-old institution, we believe the composition of First Horizon's deposit base is fundamentally different from those of recently failed banks that grew their deposit bases significantly by way of "hot" venture capital money prior to collapse. First Horizon's top 15 accounts represent just one percent of deposits, a stark contrast to Silicon Valley Bank, which had $13 billion in uninsured deposits from just its top ten depositors. During FHN's recent analyst day, management noted that the company has seen no change in deposit outflows or client relationships since it reported first-quarter results from March. (In addition to deposits and client relationships, First Horizon has also retained its senior-level employees, despite the collapse of the TD acquisition. From the date of the merger announcement through May 2023, FHN has lost no regional presidents and only 1% of the executives in its top two management tiers.)
A concern among many bank analysts is the effect of work-from-home policies on the overall demand for general office space. Increasingly empty buildings reduce landlords' ability to service the debt used to purchase those buildings. While First Horizon has substantial exposure to the commercial real estate market, only $2.8 billion of its total loan portfolio of $59 billion in office exposure. Of those office loans, roughly half are considered medical office, a market segment that doesn't face the same work-from-home issues challenging general commercial office space tenants and landlords. (It's hard for a surgeon to work from home.) Adjusting for medical loans, FHN's office exposure is well below that of the typical regional bank.
FHN also has a strong market share in pro-growth areas that will likely face fewer commercial real estate issues than some of the larger markets that we expect to be more problematic. (According to a recent Bloomberg study, the Southeast accounted for more than two-thirds of all job growth across the US since 2020 and is now home to 10 of the 15 fastest-growth cities. Additionally, FHN has no exposure in either California or New York.) Moreover, the majority of FHN's loan book consists of floating-rate loans, with 70% of the portfolio expected to reprice within the next year. That is, higher interest rates should provide an earnings boost to FHN.
Additionally, FHN excels in credit evaluation compared to its peers, with an impressively low percentage of non-performing loans, currently standing at only 54 basis points.
One area of concern for FHN has been its relatively large base of uninsured deposits, which represent approximately 41% of its total deposit base. It was a combination of a rapid withdrawal of massive amounts of uninsured deposits and a precipitous drop in the value of its investment portfolio that proved fatal to Silicon Valley Bank. First Horizon doesn't face either of those threats.
While we view FHN's uninsured deposits as unlikely to migrate away from the bank, if it happened the company's substantial interest income provides the ability to easily replace any lost deposits, albeit at a cost. What sets First Horizon apart from recently failed banks is its balance sheet's capacity to withstand a significant increase in funding costs. In contrast, now-defunct banks such as Silicon Valley had locked their balance sheets into low-yielding assets that higher interest rates rendered permanently impaired.
To illustrate a worst-case scenario, let's assume that depositors withdrew 80% of the uninsured deposits at FHN. The company could replace that capital by borrowing from the Federal Reserve at 5% (versus its current 1.7% cost of interest-bearing deposits), resulting in an increased annual interest cost of approximately $600 million - or a temporary hit of less than 50% of the company's net income.
Canadian Natural Resources
For several reasons, we have always viewed the oil and gas industry with an especially skeptical eye. Commodity businesses are difficult to forecast, and the industry has long been plagued by poor incentive structures and principal-agent issues. The managements of many of the smaller companies in the industry are notable for seldom being burdened with an abundance of ethics. Further, the entire industry has historically been dominated by a "drill at all costs" mentality, with little regard to returns on capital. That is, until recently, as social concerns have helped propel both a sell-off in oil and gas company stock prices and a massive reduction in capital expenditures. The lack of capital expenditures has created a favorable environment for higher commodity prices. As a result, we are beginning to see the sector as a more appealing hunting ground.
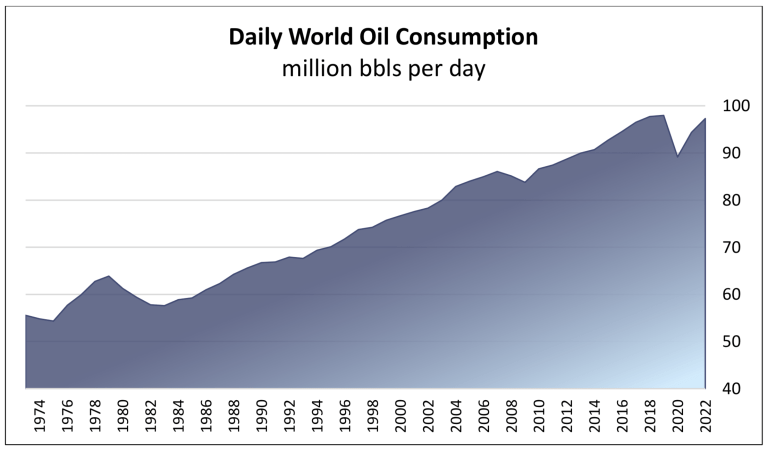
The move from fossil fuels may be inevitable, but it is in no way imminent, regardless of the political or social pressures demanding otherwise. While renewable energy sources will continue to take "market share" from fossil fuels, even the most ardent renewables supporters acknowledge that oil and gas will continue to be needed for at least the next 30 years to bridge the gap to even the most optimistic projections of a complete shift to renewables.
We recently purchased shares of Canadian Natural Resources ( CNQ ) , a diversified energy company that specializes in the acquisition, exploration, development, production, and sale of crude oil and natural gas. We consider CNQ to be one of the few companies in the industry that never needed to undergo either a capital allocation or ethical transformation. The company has long nurtured a culture of continuous improvement, emphasizing cost control to drive strong operational and financial results while working to maximize shareholder value.
CNQ's remarkable growth can be attributed to a combination of organic initiatives and successful consolidation of the upstream Canadian oil and gas industry. Through strategic acquisitions, CNQ has secured significant reserve capacity and infrastructure, investing $50 billion (equivalent to 41% of sales) between 2010 and 2018. This has positioned CNQ as the largest acreage holder in the Canadian oil and gas industry (23 million acres), boasting more than twice the proven reserves of its closest competitor, Cenovus Energy. Moreover, CNQ has shifted its production mix from natural gas to crude oil, which currently represents approximately 57% of its proven reserves. This strategic shift aligns with the strong structural tailwinds and pricing advantages associated with crude oil.
The capital investment undertaken by CNQ has enabled the company to achieve operational scale, top-tier efficiency, and vertical integration, positioning it as a low-cost producer with a long-life, low-decline reserve base. CNQ's asset base also requires significantly less maintenance capital expenditures compared to its peers, as 78% of its liquid production comes from long-life reserve bases. With major project spending completed, CNQ is now in a cash flow harvesting phase, allowing the company to maintain its production volume with minimal annual maintenance capital expenditures. Over the past five years, CNQ has generated free cash flow averaging 120% of its net income.
From a unit economics perspective, CNQ has historically spent approximately $17 per barrel on production expenses, $17 per barrel on transportation expenses, and 15% of revenues on royalties. This produces Earnings Before Interest Taxes and Depreciation (EBITDA) of $25 per barrel at $70 oil prices. Additionally, depreciation and depletion expenses amount to $12-15 per barrel, which significantly exceeds the company's necessary maintenance capital expenditures. On the natural gas side, CNQ's position as the largest producer in Canada allows it to draw on a total resource base of approximately 13.6Tcf. This scale helps contribute to its position as a low-cost producer, with costs ranging from $1.00 to $1.20 per mcf. (The average breakeven price for Canadian natural gas producers is $2.30 per mcf.)
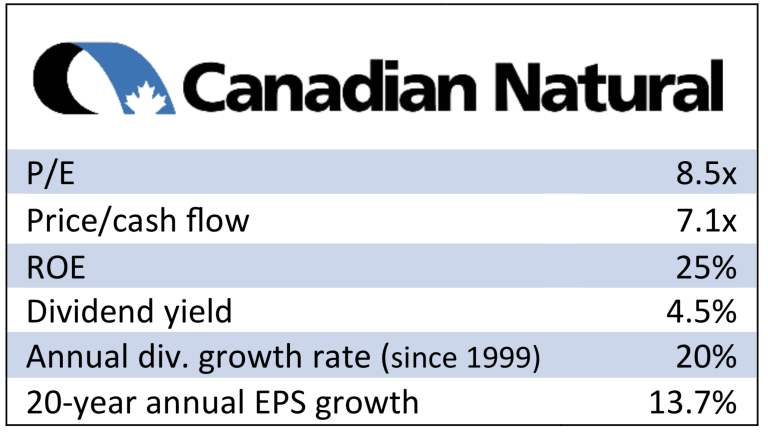
In terms of valuation, CNQ trades at a 14% yield on estimated FY'23 free cash flow, assuming $70/bbl oil prices. It also offers a 4.4% dividend yield and has reduced its leverage to less than 1x debt-to-EBITDA. Notably, CNQ has implemented a defined free cash flow allocation policy, directing 100% of free cash flow (after capital expenditures and dividends) to share repurchases when net debt falls below $10 billion. (The company currently has net long-term debt of less than $8 billion.)
Widely recognized for its superior management, CNQ has raised its dividend for 23 consecutive years, achieving a remarkable 21% compound annual growth rate, compared to the industry average of 5%. Unlike many industry peers, CNQ consistently prioritizes return on capital and earned an after-tax return on capital of 22% in 2022, up from 15.6% in 2021.
With a proven reserve life of 32 years, a dividend yield of 4.4%, and an incremental share repurchase program equivalent to 100% of free cash flow, CNQ represents one of the best royalty streams available for sale. Our estimate of the company's fair value is $80/share, 45% higher than our purchase price of approximately $55.
It is possible that you may have noticed us occasionally mention that we can't predict short-term moves in the stock market. No one else can either, although that doesn't prevent people from claiming or believing otherwise. But we certainly recognize our inability to do so. Nonetheless, it is tempting to exercise even more caution than usual when stock prices jump so rapidly in a short period.
However, since pre-pandemic, the S&P 500 increase closely matches the increase in earnings of the companies in the index. Measuring from January 1, 2020 - that is, pre-pandemic - the S&P 500 has increased 36%, while the earnings of the S&P 500 companies have increased 33%. Over these past 30 months, the stock market has increased an average of 10.4% annually, almost perfectly equal to its long-term average.
Editor's Note: The summary bullets for this article were chosen by Seeking Alpha editors.
For further details see:
Moon Capital Management Q2 2023 Letter