SPY - MSCI: Better Buy Than Moody's And S&P Global
2023-10-03 18:04:01 ET
Summary
- MSCI, Moody's and S&P Global are top players in the financial industry, fortified by fundamentally strong market positions and strong moats.
- In terms of performance, all three companies excelled in the past decade, but MSCI emerged as the definitive leader.
- Despite dividend yields around 1%, all three companies have demonstrated robust dividend growth over the past five years, with expectations for continued growth in the future.
- MSCI stands out as the priciest among the three, but it's currently trading at a discount compared to its five-year averages, making it a compelling opportunity.
- While all three companies are anticipated to experience substantial capital appreciation, MSCI's exceptional growth prospects position it as the top choice among the three.
Investment Thesis
As a dividend growth investor in my 30's, my focus is on identifying blue-chip companies with substantial potential for robust and sustainable growth. This growth should translate into increasing dividends, ultimately providing a passive income source.
When evaluating potential investments, I prioritize companies with strong market positions, solid management, reasonable valuation and enduring competitive advantages. I seek businesses operating in expanding markets, showcasing a proven history of both capital appreciation and consistent dividend growth, coupled with sustainable payout ratios that can last for decades.
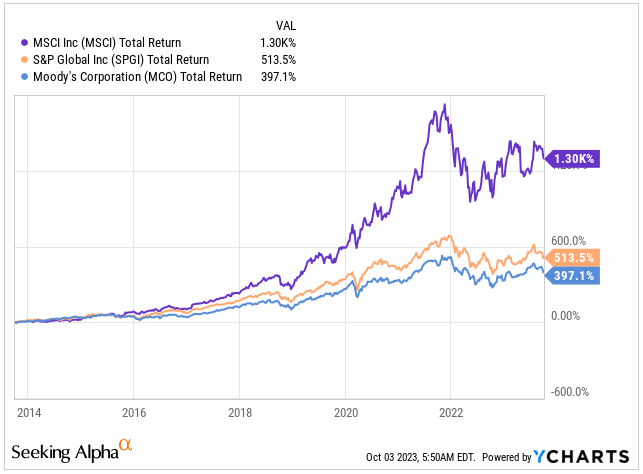
This led me to compare MSCI ( MSCI ), Moody's ( MCO ) and S&P Global ( SPGI ). I perceive all three companies as exceptional, firmly established in their respective industries and fortified by significant competitive advantages. Despite all three performing well over the last decade, easily outperforming the S&P 500 ( SPY ) by at least double, MSCI has been the clear winner of the return game.
At this point, I don't have a stake in any of these companies. This analysis serves not just the readers but also me, aiding in deciding which of these businesses is worth investing in. The goal is to anticipate both capital appreciation and steady, dependable dividend growth in the years to come.
Business Overview
MSCI Inc.
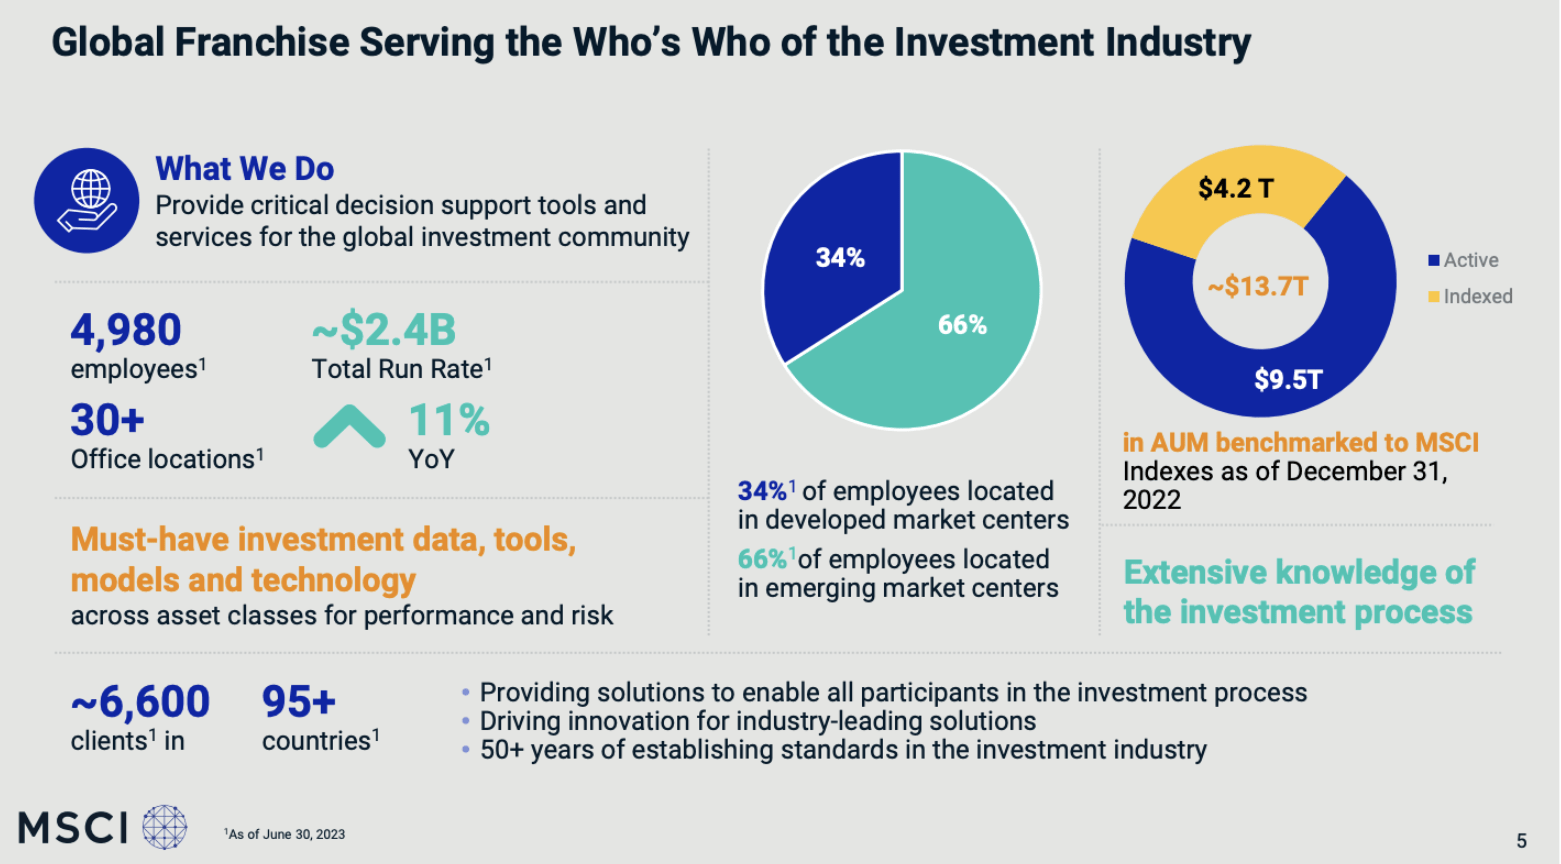
MSCI, also known as Morgan Stanley Capital International, is a truly fascinating company within the financial sector. It ranks among the world's largest financial service firms with its market cap of more than $40 billion, boasting a substantial workforce of 4,980 employees spread across 30 locations globally. Their reach extends to nearly 100 countries, serving 6,600 clients.
What makes MSCI stand out is its role as a leading global provider of tools that aid investment decisions. Their primary focus is on delivering in-depth financial data, analytics, and indices. These resources are invaluable for investors, empowering them to make wise and well-informed choices. MSCI's core business revolves around providing insights and solutions tailored to help investors manage risks, optimize performance, and navigate the complexities of the global market.
In essence, MSCI plays a crucial role in empowering financial professionals and institutions. Their services are instrumental in enabling effective capital allocation and supporting investors in achieving their investment objectives.
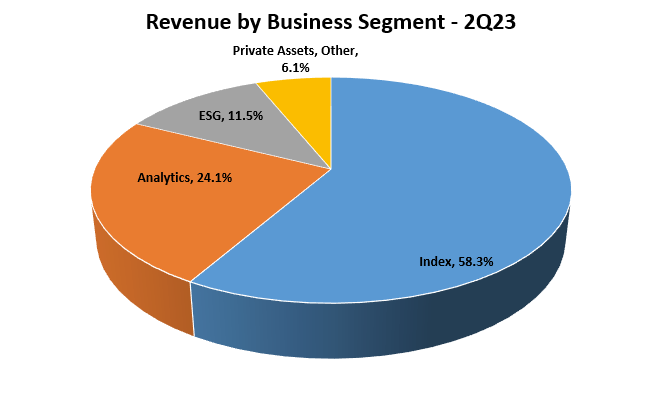
Regarding its operations, MSCI, is organized into four major business segments. Notably, the Index segment which has generated a remarkable $362.3 million in revenue during Q2 FY23 . This segment represented a substantial 58.3% of the total quarterly revenue and showcased an impressive organic YoY growth rate of 13%, solidifying its position as the company's leading segment.
Compared to the other companies we're analyzing today, MSCI reported a revenue of $2.24 billion by the end of 2022, making it the smallest among the three.
At the heart of MSCI's business are its indices, which serve as vital benchmarks for investors. These indices span across various investment categories, including equity, fixed income, and multi-asset class investments. They play a crucial role for clients, enabling them to evaluate performance, allocate assets strategically, and even create diverse investment products like ETFs.
Revenue by Business Segment (Author's Graph (Data MSCI IR))
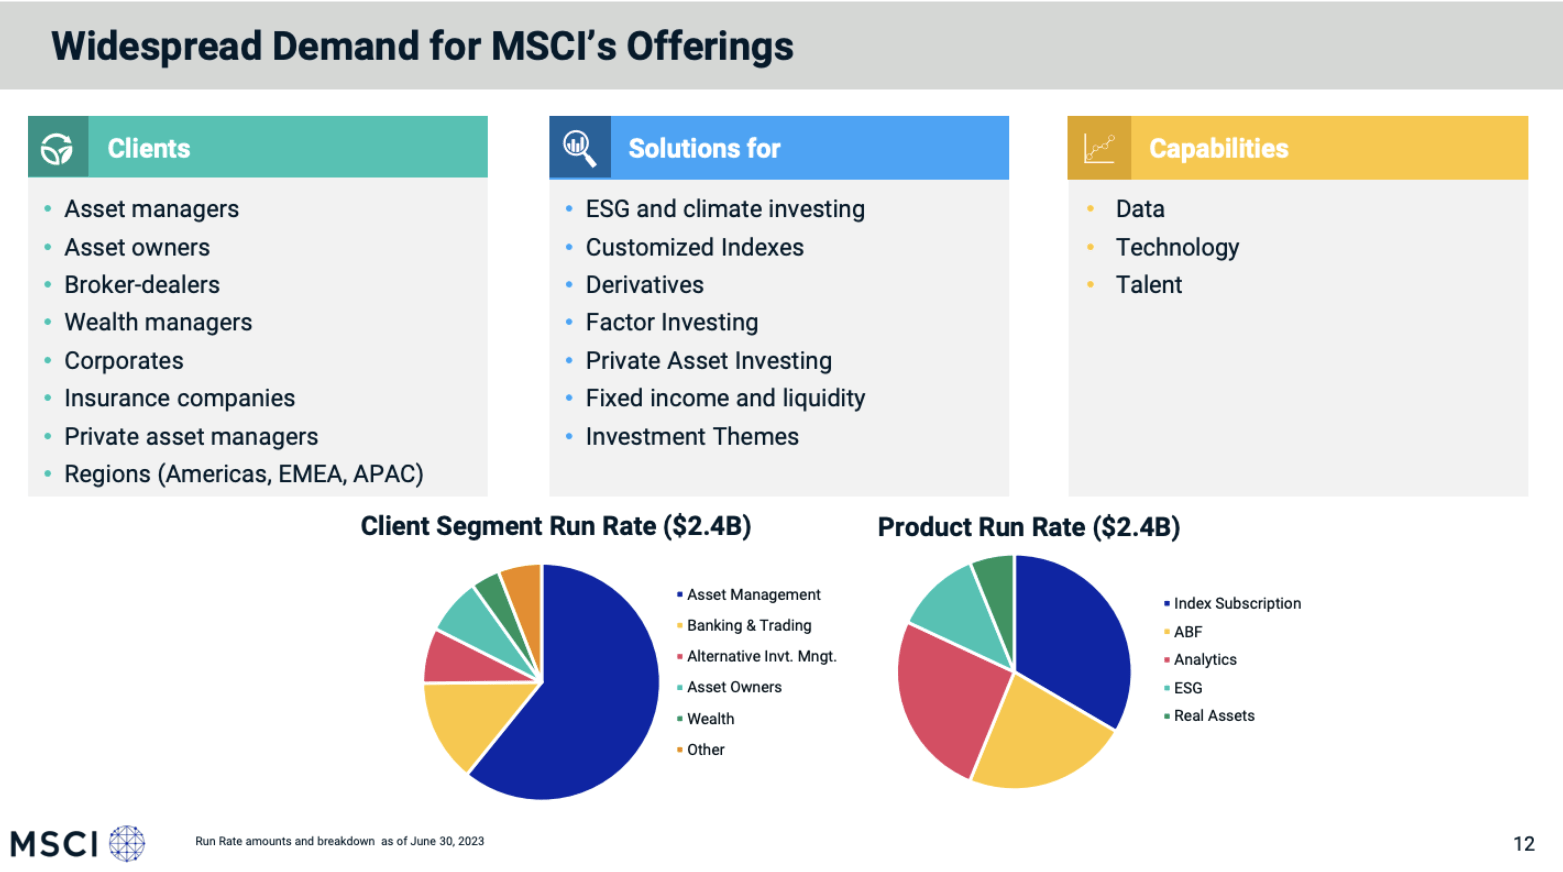
Moreover, MSCI doesn't limit itself to indices alone. The company is deeply involved in a wide array of services, notably in the Environmental, Social, and Governance or "ESG" and climate investing. This diversification allows MSCI to cater to the evolving needs of its clientele.
Speaking of clients, MSCI's primary customer base comprises asset managers, as well as banking and trading companies.
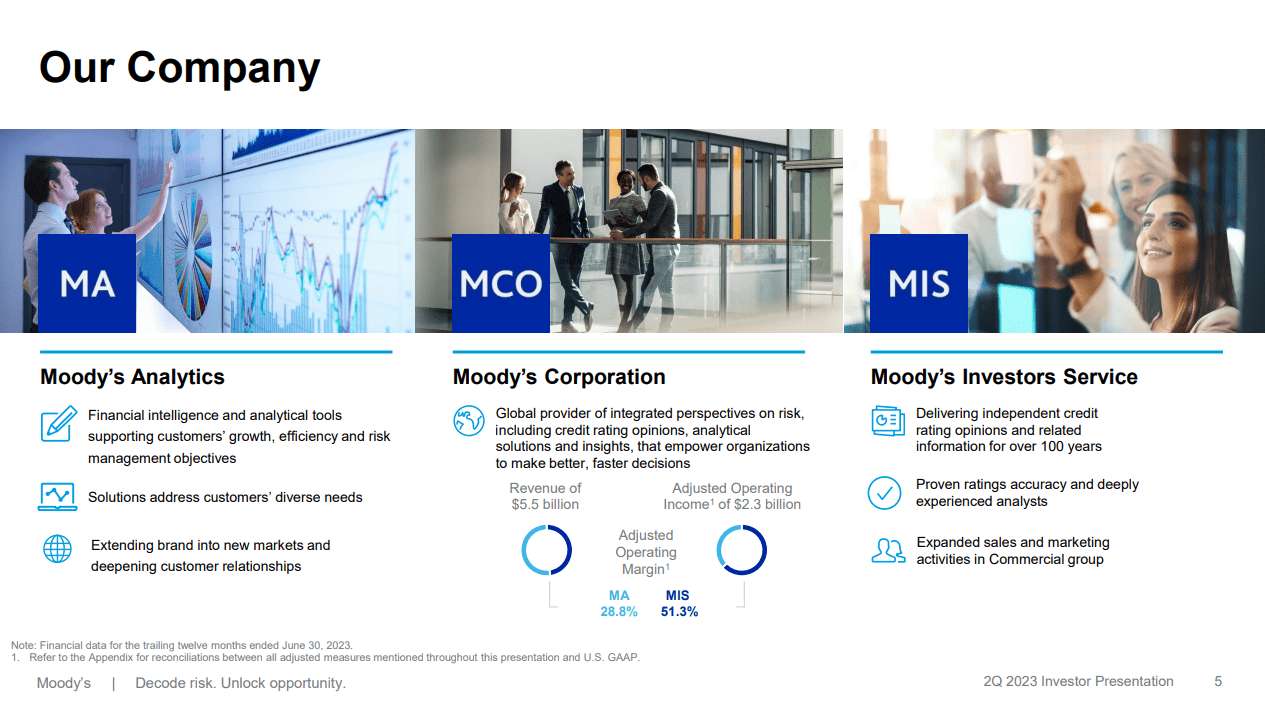
Moody's Corporation
Moody's has been a stalwart in the global financial arena, boasting a substantial market capitalization of $53 billion. Renowned for its expertise in credit ratings, research, and risk analysis, Moody's has earned a stellar reputation over its century-long existence.
With a workforce of over 14,000 employees, the company holds significant influence, evident in Warren Buffet's substantial 13.5% stake. Moody's core competency lies in evaluating creditworthiness, a role pivotal in shaping financial decisions, promoting stability, and driving economic growth.
In the last few years the company was undergoing a transition, stepping beyond its traditional identity as a rating agency to emerge with a more versatile product offering of financial analytics through Moody's Analytics.
This shift represents a strategic leap, focusing on providing all-encompassing, data-driven solutions and cutting-edge analytical tools tailored to meet the evolving demands of modern businesses and investors.
By integrating sophisticated analytics, Moody's empowers its clients with insights, equipping them to navigate complex financial landscapes, mitigate risks, and make better decisions in an era defined by data-driven financial decisions.
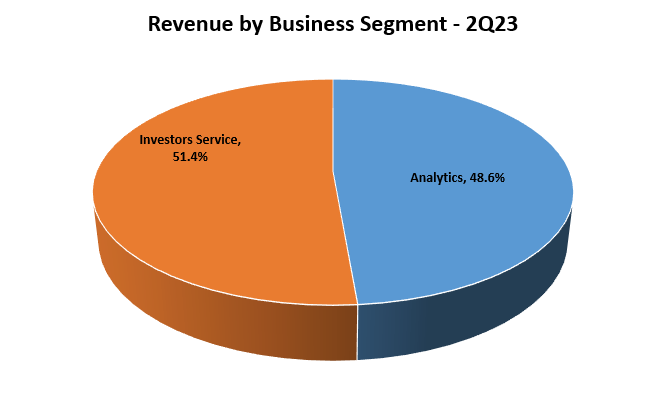
Moody's business segments might not be as varied as MSCI's, but there's a better balance in their contributions to the overall revenue which reached $5.46 billion at the end of 2022.
During Q2 FY23 , Investor Service, the larger segment offering independent credit rating opinions, made up 51.4% of the total revenue. Interestingly, it's the Analytics segment that's propelling the company's growth, showing an impressive 11% YoY increase in Q2 earnings.
Looking ahead, it's likely that Analytics will surpass Investor Service, becoming the company's leading revenue contributor.
Revenue by Segment (Author's Graph (Data MCO IR))
In my view, as interest rates rise and the possibility of a recession looms in 2024, the markets are becoming increasingly volatile, particularly in sectors sensitive to rates like real estate and cyclicals.
In this scenario, companies like Moody's are well-positioned to capitalize on the growing demand for accurate assessments distinguishing strong companies from the weaker ones. The need for reliable analysis and risk management is more crucial than ever, presenting an advantageous opportunity for Moody's in these uncertain times.
S&P Global Inc.
S&P Global is the largest company we're analyzing today, boasting a market cap of $117 billion and employing over 39,000 professionals globally. It holds a significant role in the financial industry, specializing in providing comprehensive financial information, analytical insights, and data services to a diverse clientele, including corporations, investors, and governments worldwide.
Their services range from credit ratings to market intelligence and research, equipping businesses and individuals with crucial tools for making strategic financial decisions.
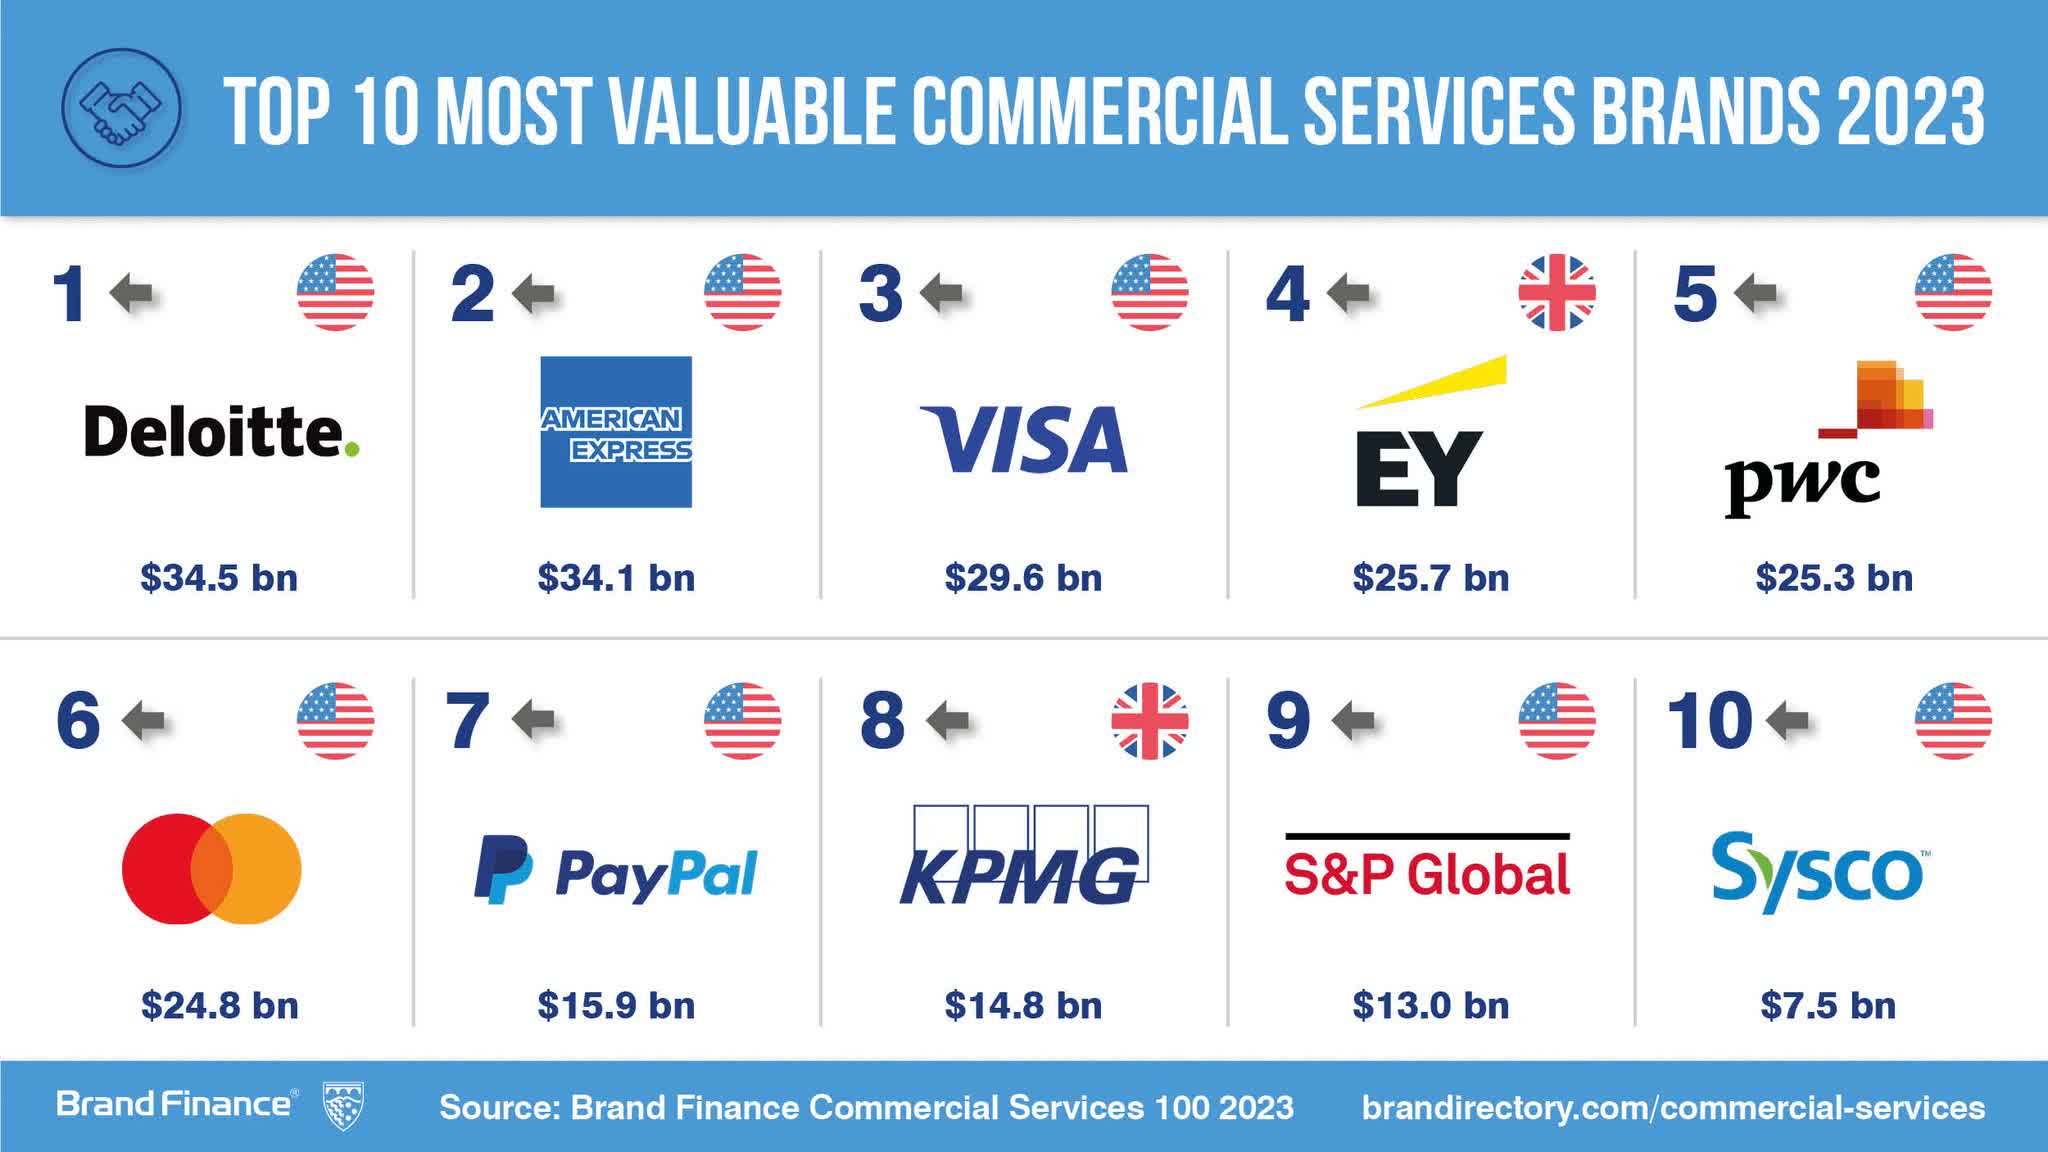
In my analysis, S&P Global stands out as the only company to rank among the top brands in the Commercial Services sector for 2023. It secured the ninth position, sharing the list with big names like American Express ( AXP ), Visa ( V ), and Mastercard ( MA ). S&P Global's brand value has surged to $13 billion, indicating a significant increase of $9.9 billion compared to the previous year, highlighting its growing prominence in the market.
S&P Global leads the pack in terms of revenue, with a reported revenue of $11.18 billion at the end of 2022.
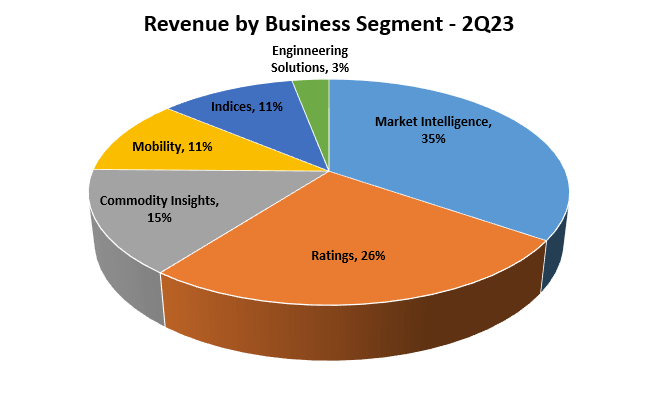
What sets S&P Global apart, in my view, is its revenue diversity. Their primary segment, Market Intelligence, contributes 35% of the total revenue in Q2 FY23 , closely followed by Ratings at 26%. Unlike Moody's or MSCI, S&P Global benefits from a larger market size and the most varied revenue sources.
Interestingly, although many associate S&P Global with indices like the S&P 500 and Dow Jones, these indices make up only 11% of the company's total revenue. Their business scope extends far beyond what many might assume.
Revenue by Business Segment (Author's Graph (Data SPGI IR))
Return to Shareholders
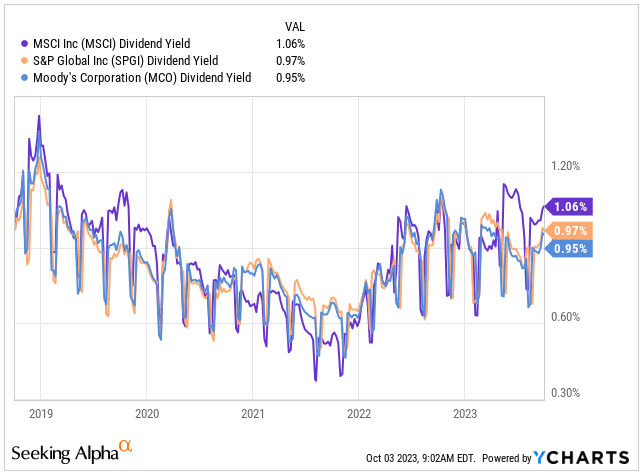
Shifting focus to the most intriguing aspect for dividend investors, it's essential to highlight that none of these companies boast stellar dividend yields. All three have fairly similar yields, with MSCI leading the way at 1.06%.
Looking ahead, MSCI's forward dividend yield is estimated at 1.09%. However, where the numbers become compelling is when you factor in capital appreciation. Taking into account the yield on cost from five years ago, MSCI's stands impressively at 3.05% today.
Additionally, it's worth observing that the current yields for all three companies are slightly higher than their five-year averages. MSCI's five-year average stands at 0.88%, Moody's at 0.86%, and S&P Global at 0.87%.
Dividend Yield (Seeking Alpha)
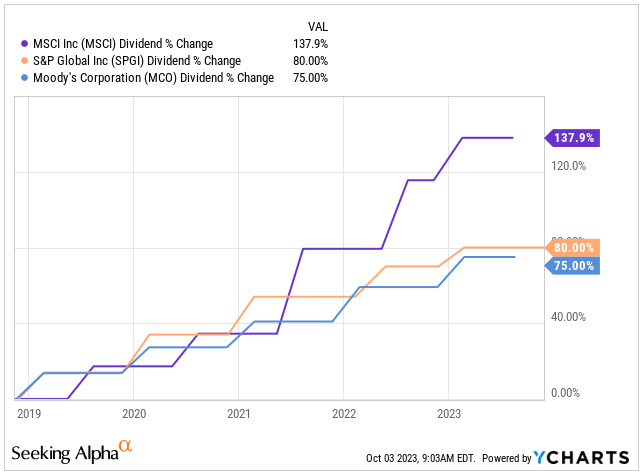
The standout factor for all three companies lies in their dividend growth. Speaking candidly, as someone in my 30s, my preference leans toward a steady dividend increase rather than a high yield, which often comes with higher risks. I favor a lower, single-digit yield coupled with robust dividend growth.
In this regard, MSCI leads the pack. In the last five years, the company has displayed an impressive track record, increasing its dividends by a remarkable 138%, roughly translating to an annualized growth rate of 27.6%.
This strong performance from MSCI is understandable, given its smaller revenue size compared to Moody's and S&P Global. However, both Moody's and S&P Global have reasons to be proud as well.
They have shown steady growth, with both companies increasing their dividends at an average rate of around 16% annually over the past five years. This reflects their consistent commitment to delivering value to investors through sustained dividend growth.
Dividend Growth Rate (Seeking Alpha)
When it comes to dividend safety, the low yields of all three companies are complemented by their payout ratios, which are consistently lower than 40%. This indicates exceptionally secure dividends across the board.
Certainly, dividends aren't the sole method of rewarding shareholders, especially considering their tax implications in brokerage accounts.
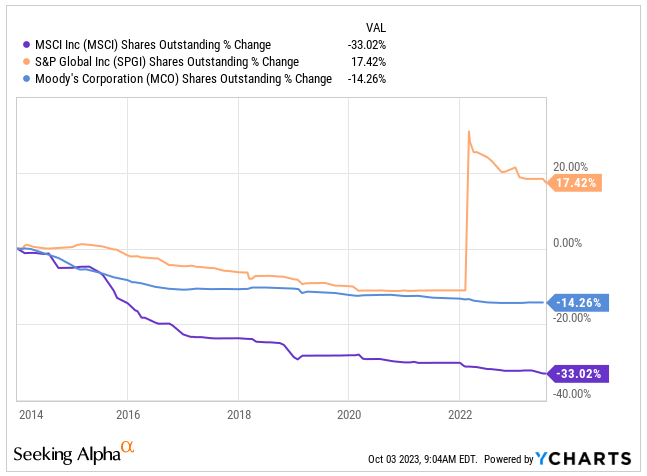
Share buybacks serve as an alternative avenue for companies to enhance shareholder value. Taking a closer look, MSCI once again stands out, having reduced its outstanding shares by an impressive 33% over the past decade. In comparison, Moody's decreased its shares by 14%, while S&P Global took a different approach by increasing its share count by 17.4%.
Share Buybacks (Seeking Alpha)
Valuation and Growth Outlook
In terms of shareholder returns, MSCI clearly takes the lead, offering the highest yield, rapid dividend growth, and an aggressive share buyback strategy compared to its peers.
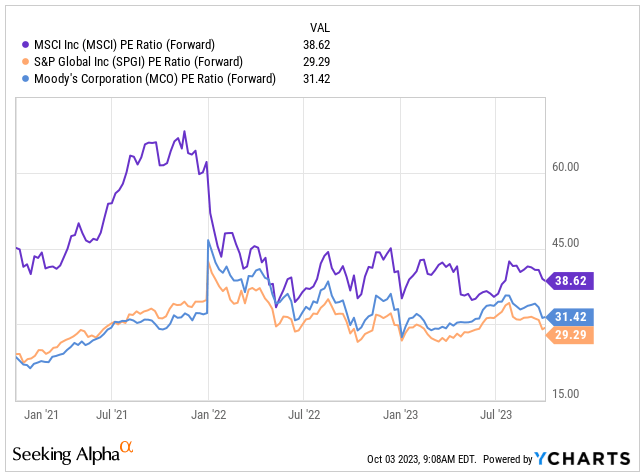
However, the valuation paints a different picture. While all three companies are unquestionably top-tier, MSCI currently trades at a higher valuation than the other two. Looking at the FY24 Forward PE ratios, MSCI stands at 38.62x, Moody's at 31.42x, and S&P Global at 29.29x.
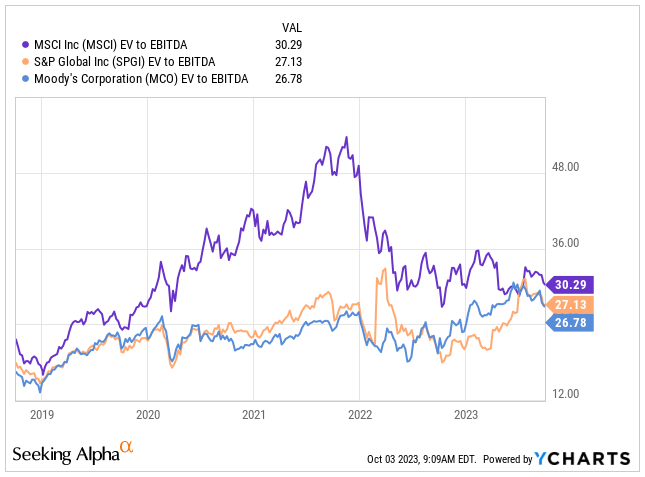
Analyzing the EV/EBITDA ratio provides a comparable perspective. MSCI is trading at 30.29x, Moody's actually positions as the cheapest at 26.78x, and S&P Global stands at 27.13x.
Certainly, it's evident that all three companies are trading at premium valuations. What's intriguing, however, is that despite MSCI being the most expensive among the trio currently, it's actually trading at a significant discount compared to its 5-year average.
MSCI is trading at a 16% discount in terms of Forward PE and at a 12% discount in terms of EV/EBITDA. In contrast, both Moody's and S&P Global are trading at relatively higher levels in terms of EV/EBITDA and are either at break-even or with a smaller discount to their 5-year Forward PE averages.
| Forward PE |
| 5-year AVG. |
| % Change |
| EV/EBITDA |
| 5-year AVG. |
| % Change |
| MSCI |
| 38.62 |
| 45.87 |
| -16% |
| 30.29 |
| 34.39 |
| -12% |
| Moody's |
| 31.42 |
| 31.03 |
| 1% |
| 26.78 |
| 22.47 |
| 19% |
| S&P Global |
| 29.29 |
| 31.85 |
| -8% |
| 27.13 |
| 22.72 |
| 19% |
When we dig into the nitty-gritty of valuation metrics, it's vital to keep in mind that both Forward PE and EV/EBITDA metrics have their limitations—they don't paint the complete picture, especially when it comes to growth prospects beyond FY24.
Let's get into what I'm anticipating in terms of each company's EPS growth and where their stocks might be headed.
Take MSCI, for instance. Analysts are optimistic about its earnings, expecting a consistent growth of around 13.6% annually between 2024 and 2028. Now, things get a bit foggy post-2028, but I believe the growth rate might ease to about 8.6%. If these predictions hold true, we could see MSCI's stock trading at approximately $1,022 by the end of 2030. That translates to an average annual return of roughly 12.7% over the next eight years, dividends not included.
| Fiscal Year |
| 2023 |
| 2024 |
| 2025 |
| 2026 |
| 2027 |
| 2028 |
| 2029 |
| 2030 |
| EPS |
| 13.1 |
| 15.0 |
| 17.1 |
| 19.7 |
| 22.2 |
| 24.8 |
| 27.0 |
| 29.2 |
| EPS Growth |
| 11.5% |
| 13.9% |
| 14.3% |
| 15.2% |
| 12.6% |
| 11.8% |
| 9.0% |
| 8.1% |
| Forward PE |
| 39 |
| 39 |
| 39 |
| 38 |
| 38 |
| 37 |
| 36 |
| 35 |
| Stock Price |
| $ 507 |
| $ 577 |
| $ 660 |
| $ 748 |
| $ 842 |
| $ 917 |
| $ 972 |
| $ 1,022 |
Looking at Moody's, the anticipated EPS growth from 2024 to 2028 is a bit more moderate compared to MSCI, standing at a still strong 13.1%. Similarly, looking further into the future, I foresee the EPS growth decelerating to around 8.8% after 2028. This implies that by the close of 2030, Moody's stock might be trading at approximately $572. This projection suggests an annual return of about 10.1%, excluding dividends, over the course of the next eight years.
| Fiscal Year |
| 2023 |
| 2024 |
| 2025 |
| 2026 |
| 2027 |
| 2028 |
| 2029 |
| 2030 |
| EPS |
| 10.1 |
| 11.4 |
| 13.1 |
| 14.9 |
| 16.8 |
| 18.6 |
| 20.5 |
| 22.0 |
| EPS Growth |
| 11.5% |
| 13.1% |
| 15.3% |
| 13.3% |
| 13.0% |
| 10.8% |
| 9.9% |
| 7.6% |
| Forward PE |
| 31 |
| 31 |
| 31 |
| 30 |
| 30 |
| 28 |
| 27 |
| 26 |
| Stock Price |
| $ 316 |
| $ 353 |
| $ 407 |
| $ 446 |
| $ 504 |
| $ 521 |
| $ 552 |
| $ 572 |
Turning our attention to S&P Global, it's evident that the EPS growth expectations are somewhat more conservative. I anticipate the company to experience earnings growth at a rate of about 11.7% between 2024 and 2028. Looking further into the future, I expect this growth to taper off to approximately 6.1%. If these projections hold true, it suggests that S&P Global's stock might be trading at around $637 by the conclusion of 2030. Despite the slightly tempered growth, this still translates to a robust annual return of 9.2% over the duration, maintaining its strength in the market.
| Fiscal Year |
| 2023 |
| 2024 |
| 2025 |
| 2026 |
| 2027 |
| 2028 |
| 2029 |
| 2030 |
| EPS |
| 12.5 |
| 14.5 |
| 16.4 |
| 18.2 |
| 20.0 |
| 21.8 |
| 23.1 |
| 24.5 |
| EPS Growth |
| 11.5% |
| 15.5% |
| 13.6% |
| 10.8% |
| 10.0% |
| 8.7% |
| 6.2% |
| 6.1% |
| Forward PE |
| 29.3 |
| 31.9 |
| 31.0 |
| 29.0 |
| 29.0 |
| 28.0 |
| 27.0 |
| 26.0 |
| Stock Price |
| $ 366 |
| $ 460 |
| $ 509 |
| $ 527 |
| $ 580 |
| $ 609 |
| $ 624 |
| $ 637 |
Keep in mind, that in all scenarios I am expecting the valuations to contract in line with the decreasing rate of EPS growth.
What the valuation analysis reveals is that although MSCI appears to be the priciest concerning valuation, it boasts superior EPS growth expectations compared to its peers. This suggests that if the projected growth indeed materializes, the return could significantly outperform its peers.
However, it's essential not to overlook the fact that growth stocks, especially if they face obstacles in achieving their expected growth, often experience substantial declines in stock prices. These hurdles can significantly impact the market performance of these companies, highlighting the inherent risks associated with investing in growth-oriented stocks.
Game Plan and Conclusion
In this article, we've delved into three formidable contenders within the financial industry, all of which boast robust business models with substantial competitive advantages and strong footholds in their respective sectors.
Among these, MSCI stands out as the frontrunner when considering factors like dividend yield, dividend growth rate, buybacks, and expected EPS growth.
If my analysis proves accurate, MSCI could potentially yield an impressive annualized return of 12.7% over the next eight years, excluding dividends. In comparison, Moody's is anticipated to offer a return of 10.1%, while S&P Global trails behind at 9.2%.
It's crucial to note that while I foresee all three companies outperforming the market in the long run, there's an inherent risk associated with growth stocks. If the anticipated growth fails to materialize, these companies might experience a significant decline in their stock prices.
At present, I haven't invested in MSCI, but I'm inclined to initiate a position, aiming for it to constitute no less than 2% of my dividend growth portfolio.
My strategy involves starting with a 25% investment when the price is below $500, adding another 50% if the price drops to $450, and considering an additional 25% investment if the price reaches $400.
This approach allows for a cautious yet strategic entry into the market.
For further details see:
MSCI: Better Buy Than Moody's And S&P Global