SPY - My Current View Of The S&P 500 Index: April 2023 Edition (Technical Analysis)
2023-04-02 07:04:09 ET
Summary
- Increasing allocation to SPY.
- EFA still bullish.
- Small caps back to bearish alignment.
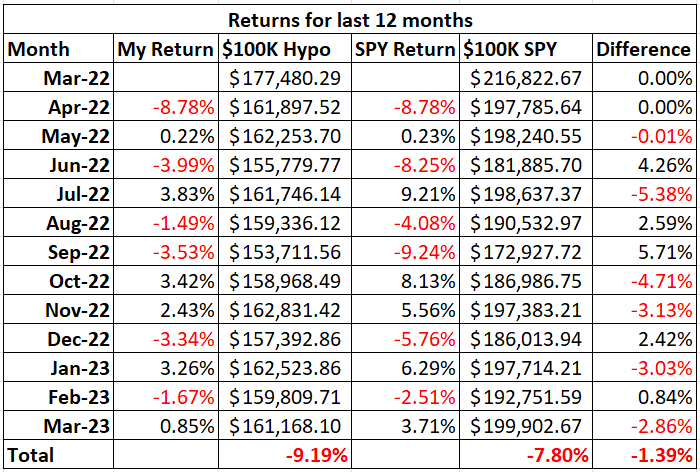
In this month’s article I outline why I am changing my allocation to the SPDR S&P 500 ETF ( SPY ) to 50% while maintaining my exposure of 50% to the iShares MSCI EAFE ETF ( EFA ). I will have no cash position. First, let me review my pension plan performance in March. The market, as measured by the S&P 500 index, gained 3.51% for the month as can be seen in Chart 1 below. As for my pension plan assets, I underperformed the index as my investment allocation gained 0.85% compared to a larger gain from the S&P 500. My investment objective of preserving my capital was met as I did make money. I did not meet my second investment objective which is beating the S&P 500 index. Table 1 below shows my returns and allocations for the month of March and Table 2 below shows my returns for the past 12 months.
I have made changes to Table 2 below after I received a comment from a reader. Table 2 shows new columns to better (more accurately) reflect my investment results. The third column, $100K Hypo, is what my returns would be if I started my account with $100,000 in my first article of this series and followed the allocation recommendations from my articles. The fifth column, $100K SPY, shows the returns of just investing $100,000 and keeping it all allocated to SPY. The percentage returns in the last row show that my strategy returned a negative 9.19% for the last 12 months and simply investing in SPY would have returned a negative 7.80% for the last 12 months. Therefore, I have underperformed SPY for the last 12 months by 1.39%.
Table 1 – Investment Returns for March
Author
Table 2 – Investment Returns Last 12 Months
To review the purpose of this series of articles, my retirement account only allows me to buy the following four ETFs: iShares Core U.S. Aggregate Bond ETF ( AGG ), SPDR S&P 500 ETF ( SPY ), iShares Russell 2000 ETF ( IWM ), and iShares MSCI EAFE ETF ( EFA ). I can also have my money in cash. The question is how to decide where and when to allocate money to these various ETFs.
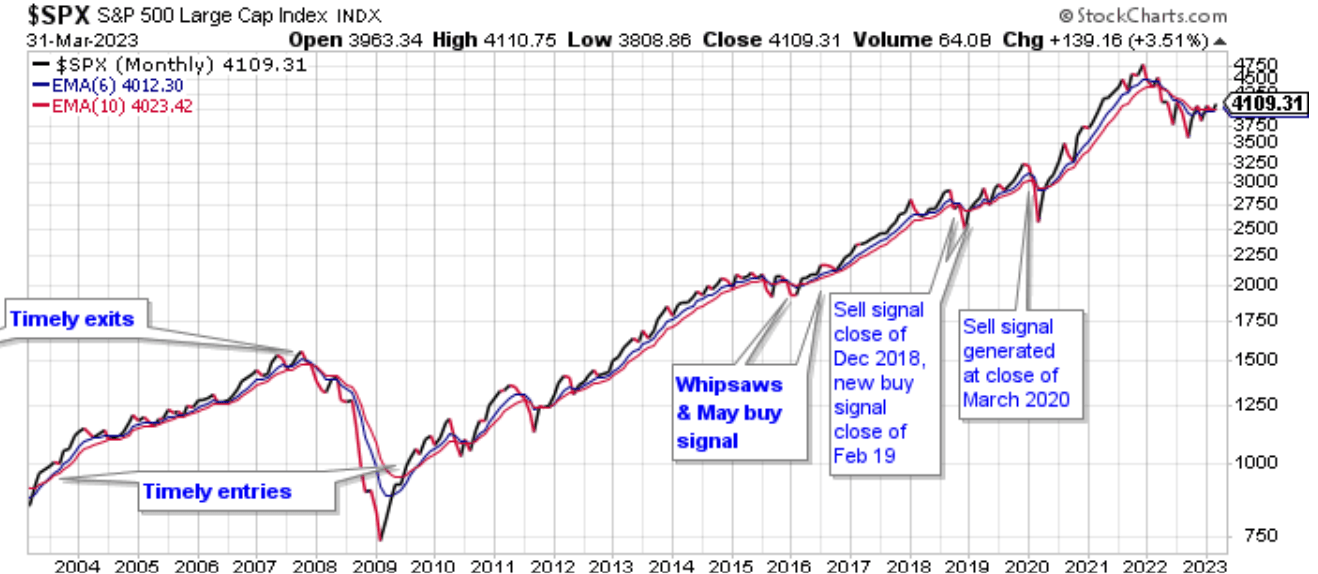
I use my moving average crossover system combined with relative strength charts to determine how to allocate my pension plan assets. My moving average crossover system uses the 6 month and the 10- month exponential moving averages to identify which of the four ETFs are in position to be bought. If the 6-month moving average is above the 10-month moving average, then the ETF is a buy. I call this setup being in bullish alignment. When the 6-month moving average is below the 10-month moving average the setup is referred to as a bearish alignment. When a bearish alignment happens, I don’t want to hold that asset. See Chart 1 below for a long-term look at the S&P 500 index using my moving average crossover system.
Chart 1 – Monthly SP 500 Index with 6/10 Moving Averages
You can see that the moving average crossover system provided some excellent long term buy and sell signals that would have allowed investors to capture long duration moves in the index; while avoiding costly drawdowns. Avoiding these costly drawdowns allows me to meet the objective of capital reservation.
I employ this strategy because I do not want to experience a large drawdown with my pension assets. During the 2008 - 2009 market crash many people didn't even look at their retirement statements because they were afraid of what they would find. I submit that if those people would have used a market strategy like what I outline in this series of articles, they would have been able to avoid much of the decline during the bear market and consequently would have had less emotional stress during that time period.
The following charts show the status of the ETFs that I am allowed to buy in my retirement account.
Chart 2 – Monthly SPY with 6/10 Moving Averages
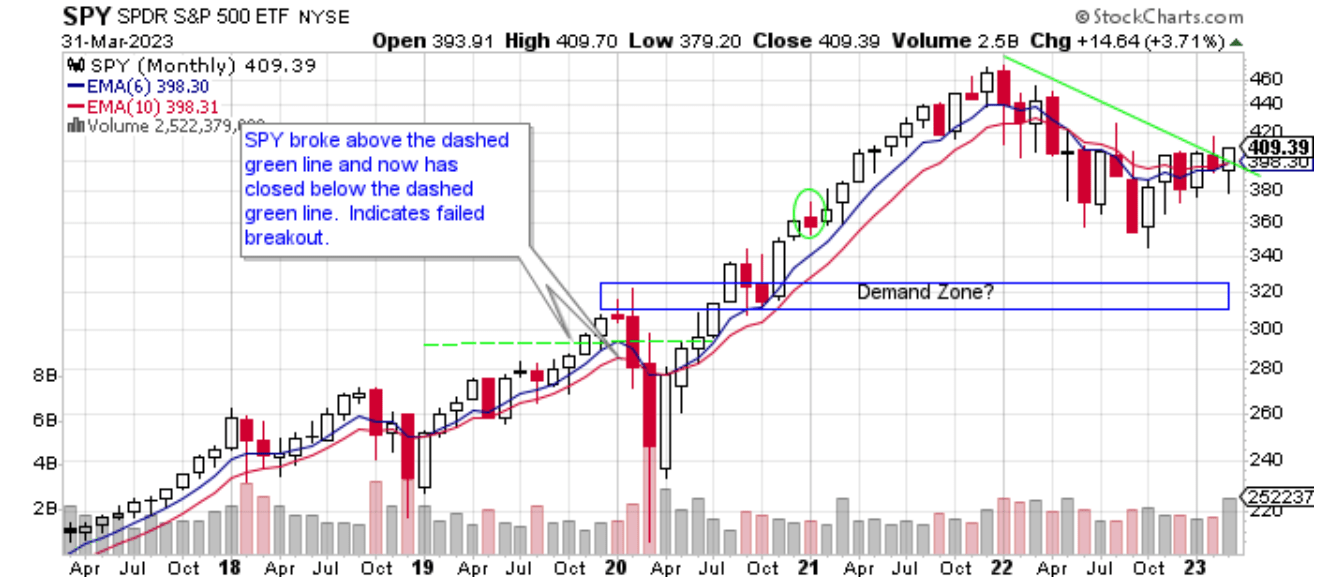
Chart 2 shows that SPY gained 3.71% in March. There is a lot to like about SPY if you are bullish on the market. Volume for the month was higher than we’ve seen for several months. From a trend following perspective SPY closed back above both the 6-month and 10-month moving averages. The close of 409.39 is the highest closing price since the close of March 2022 at 444.11. SPY closed above the downward sloping green trendline. Next, I’d like to see the 6-month moving average cross above the red 10-month moving average with price closing above both moving averages. That would put SPY in bullish alignment. The last time SPY was in bullish alignment was March 2022. So far, the October 2022 low has held. The market is looking more and more bullish. I like what I see and I will increase my allocation to SPY in April. SPY will be 50% of my retirement assets.
Chart 3 – Monthly IWM with 6/10 Moving Averages
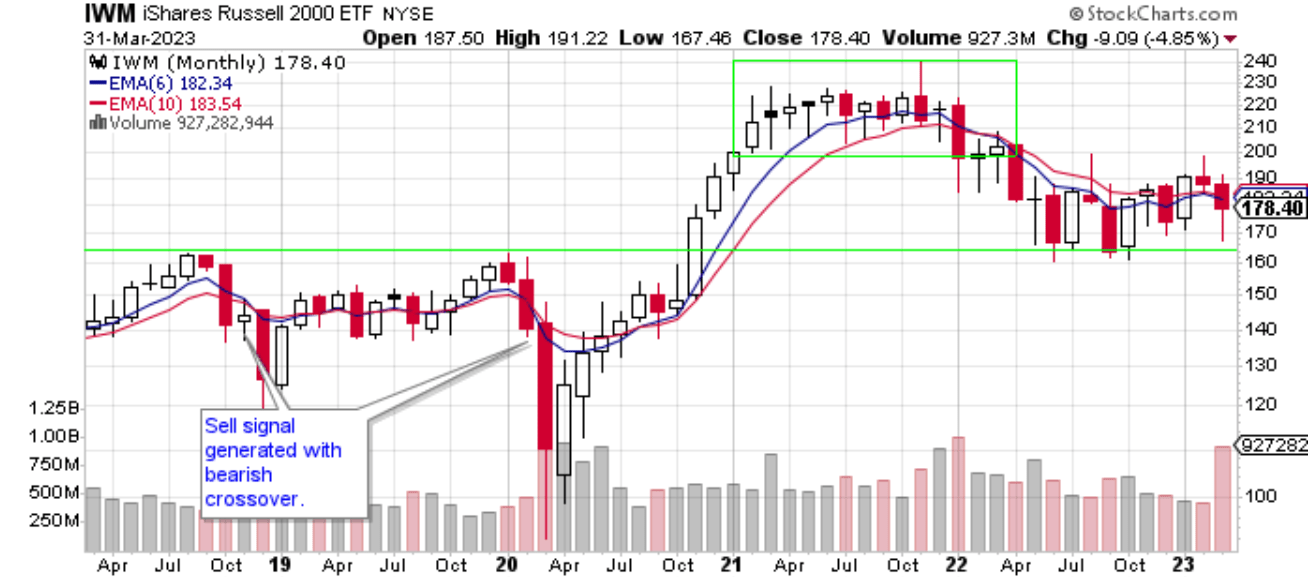
Chart 3 shows that small cap stocks faltered in March. IWM lost 4.85% and closed below both moving averages. IWM is in bearish alignment. IWM got caught up in the regional back concern as IWM had over 16% of its holdings in the Financial sector at the end of March. Financials are the second highest sector in IWM just under the weighting of Industrials. Probably at the beginning of March, Financials were the heaviest sector. Looking at Chart 3, there are some positive takeaways. IWM held above the support level shown as the green line. That level has been tested and has held several times in the last 12 months. Also looking at the month’s candle, you can see that IWM recovered about half of its losses. This is shown by the long lower wick of the candle. I still must respect the fact that IWM is in bearish alignment. In April, I will have no assets allocated to IWM.
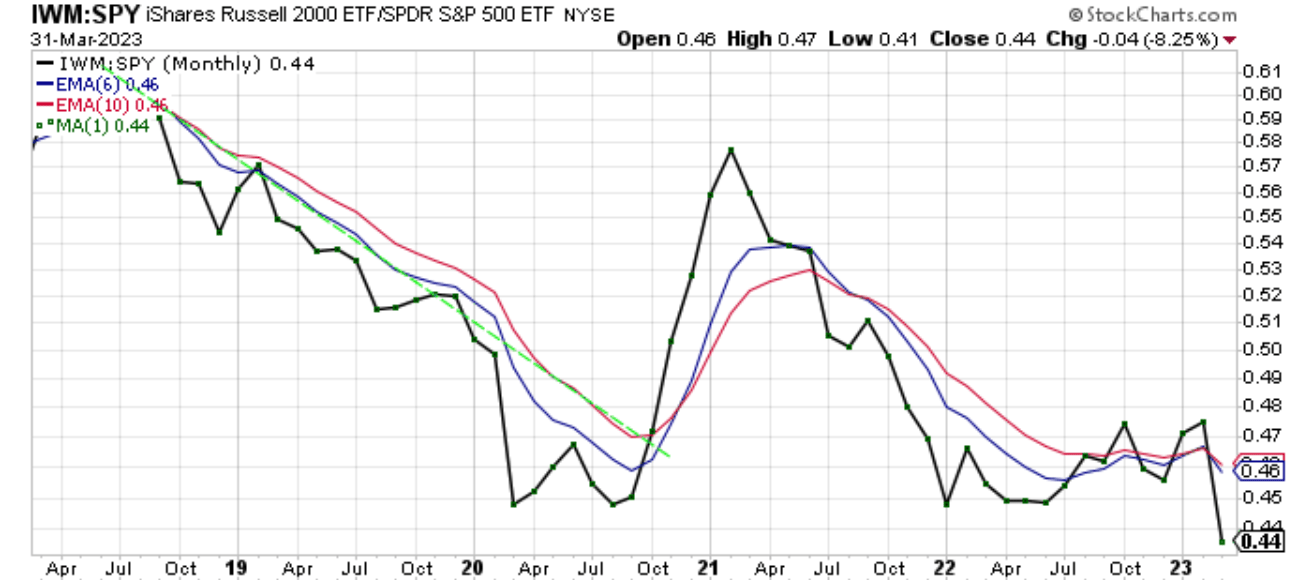
Chart 4 – Monthly IWM:SPY Relative Strength
The IWM:SPY ratio lost 8.25% in March as IWM underperformed SPY and all the other ETFs in this article. The ratio plummeted below both moving averages and reached a new low. The ratio is in bearish alignment. Last month I thought the ratio and IWM were bullish so I increased my exposure to IWM. In March the facts changed so I am changing my allocation to IWM to zero. I see no need to be in small cap stocks at this time.
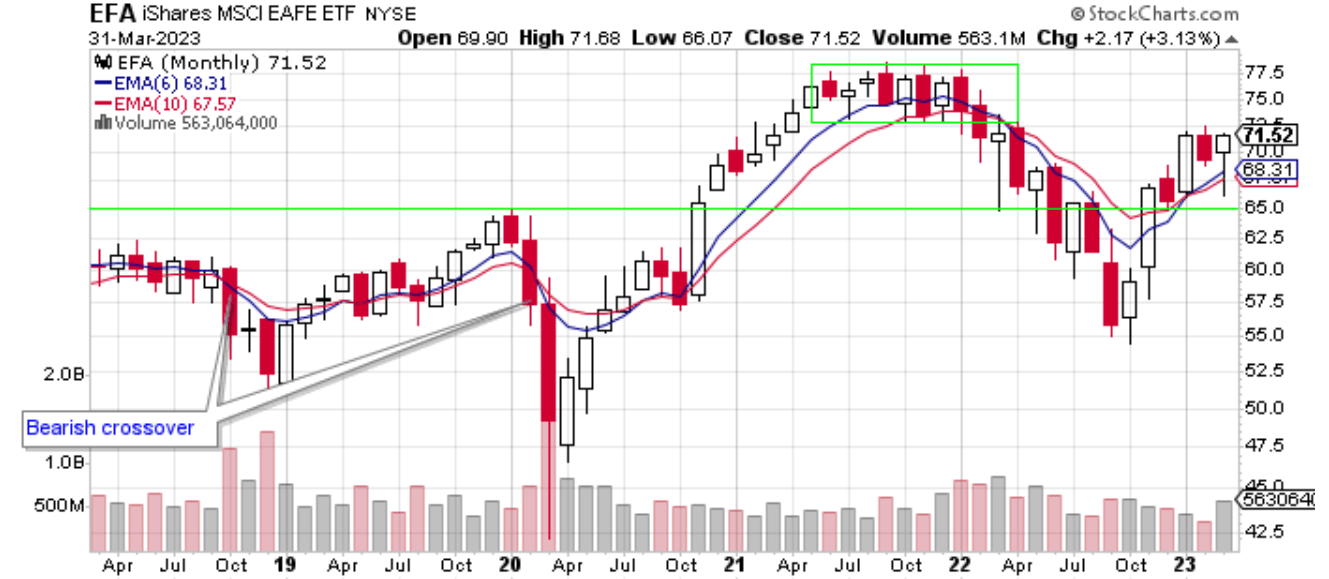
Chart 5 – Monthly EFA with 6/10 Moving Averages
Chart 5 shows that EFA had a good March and increased 3.13%. EFA remains above both moving averages and is in bullish alignment. I really like the price action of EFA in March. It tested both moving averages and the green support line while managing to close at the upper end of its monthly price range. The long lower wick tells me that the Bears were rejected and that the Bulls are in charge. I maintain that EFA has the strongest looking chart of the ETFs in this article. Foreign stocks are leading the new bull market.
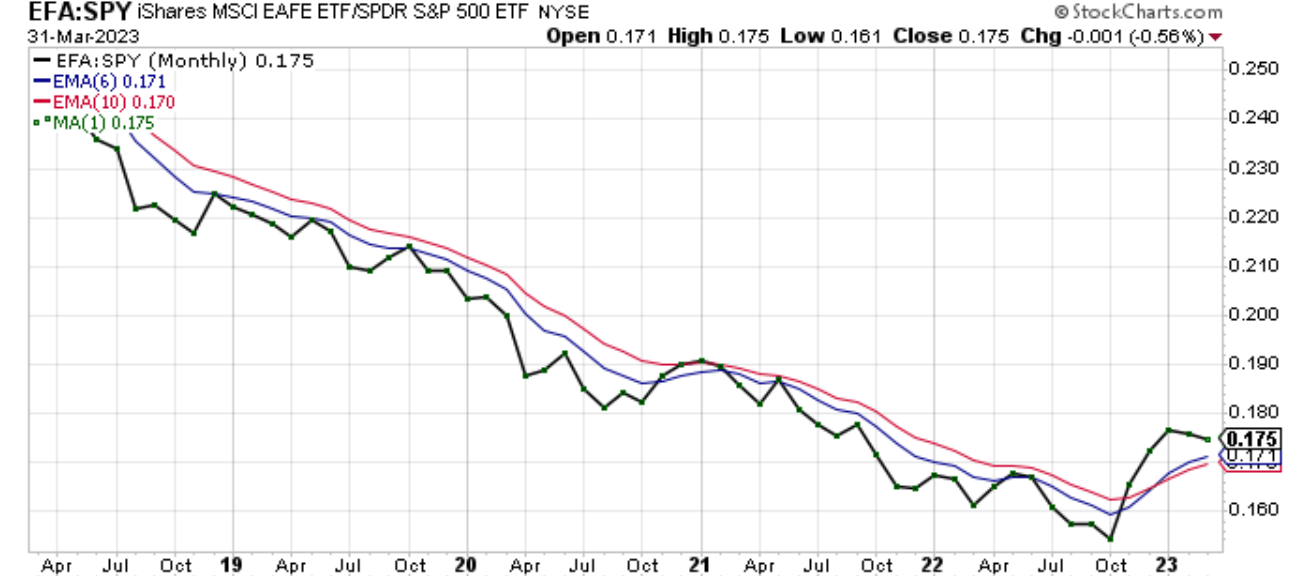
Chart 6 – Monthly EFA:SPY Relative Strength
Chart 6 shows that the EFA:SPY ratio lost 0.56% in March. The ratio remains in bullish alignment. In April, EFA will be 50% of my retirement assets.
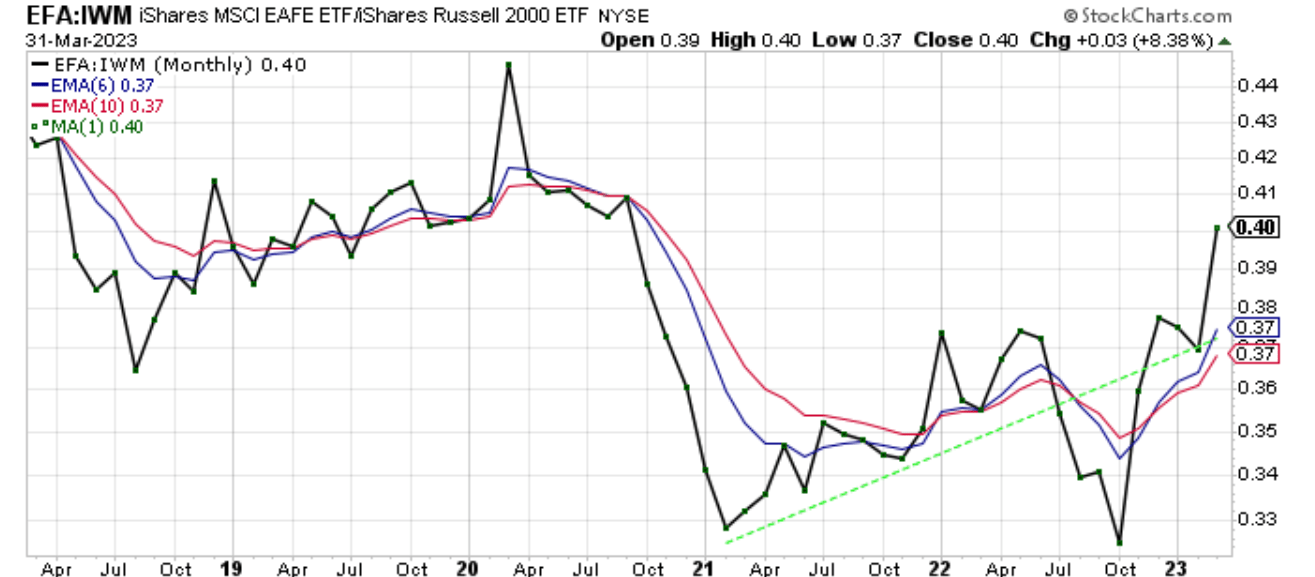
Chart 7 – Monthly EFA:IWM Relative Strength
Chart 7 shows that EFA outperformed IWM in March by 8.38%. The ratio is back above the dashed green line and the ratio remains above the highs made earlier this year. This chart still looks bullish to me.
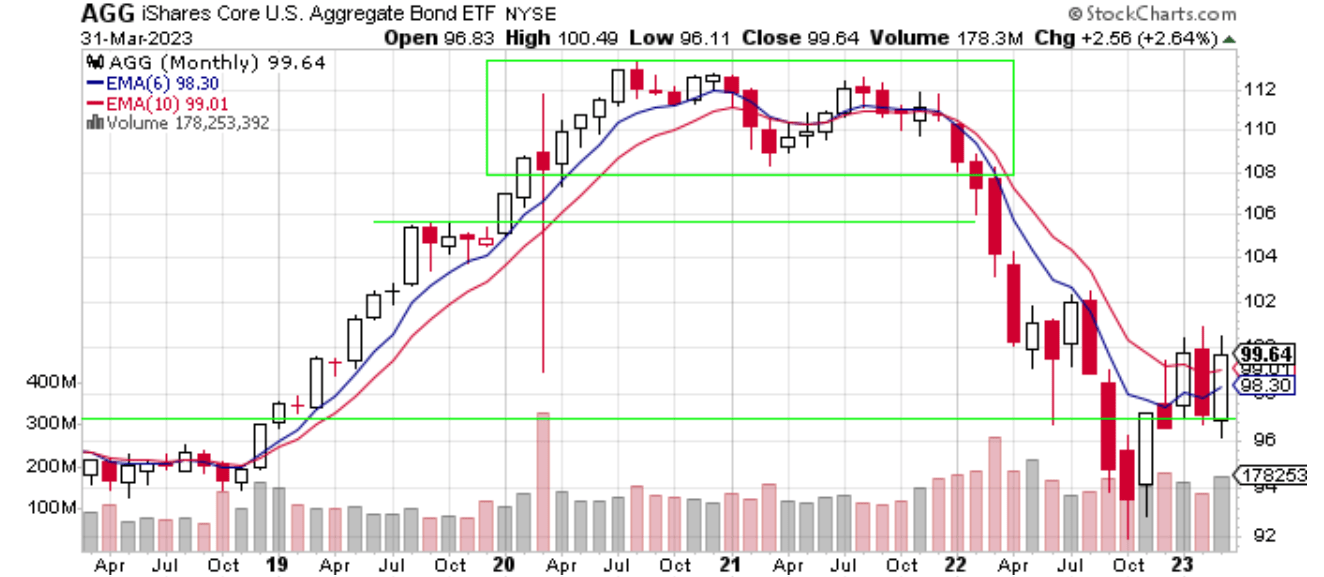
Chart 8 – Monthly AGG with 6/10 Moving Averages
Chart 8 shows that AGG gained 2.64% in March. AGG closed back above its red 10-month moving average. It also bounced off support which is shown by the horizonal green line. The two moving averages are flat to starting to trend higher. If you are bullish on AGG, the next thing you want to see is AGG go into bullish alignment where price is above both moving averages and the blue 6-month moving average is above the red 10-month moving average. I still prefer equities and will have no exposure to AGG in April.
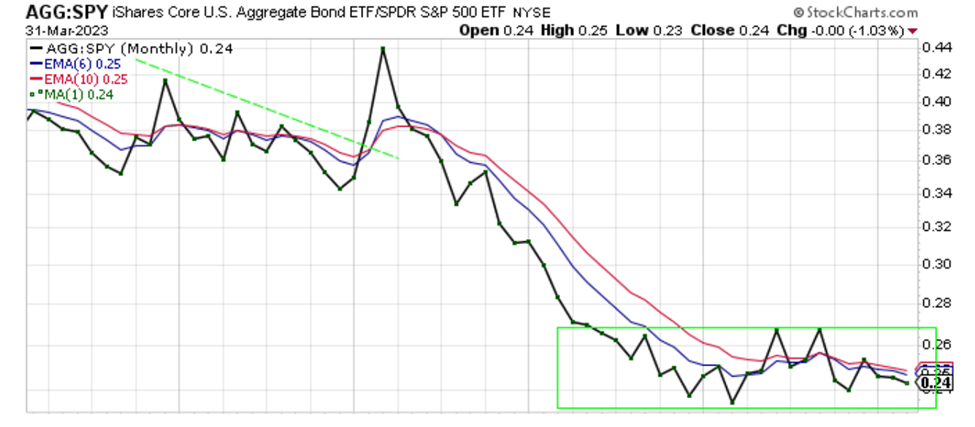
Chart 9 – Monthly AGG:SPY Relative Strength
The AGG:SPY ratio in Chart 9 lost 1.03% as AGG underperformed SPY in March. The ratio is trading in a consolidation pattern, moving sideways since mid-2021. The next step is for the ratio to put in a series of higher highs and higher lows. Then the ratio can get to bullish alignment.
In summary, March was bullish for all of the ETFs except IWM. SPY, EFA, IWM, and AGG all traded lower in the month of March and all, but IWM, were able to close higher for the month. A bullish sign for SPY, EFA, and AGG. Even IWM managed to come off its lows for the month. SPY, EFA, and AGG are all above their red 10-month moving averages while IWM remains in bearish alignment. For April, I will be 50% allocated to EFA and 50% allocated to SPY. If this allocation turns out to be a mistake, the charts will let me know and then I will adjust next month.
For further details see:
My Current View Of The S&P 500 Index: April 2023 Edition (Technical Analysis)