SPY - My Current View Of The S&P 500 Index: February 2023 Edition (Technical Analysis)
Summary
- Maintaining a 20% position in SPY.
- Increasing my position in EFA to 30%.
- Adding a new 20% position in IWM.
In this month's article, I outline why I am maintaining my allocation to the SPDR S&P 500 ETF ( SPY ) of 20%, adding a 20% position to iShares Russell 2000 ETF ( IWM ), and increasing my exposure to 30% in the iShares MSCI EAFE ETF ( EFA ). The remaining 30% of my assets will be in cash.
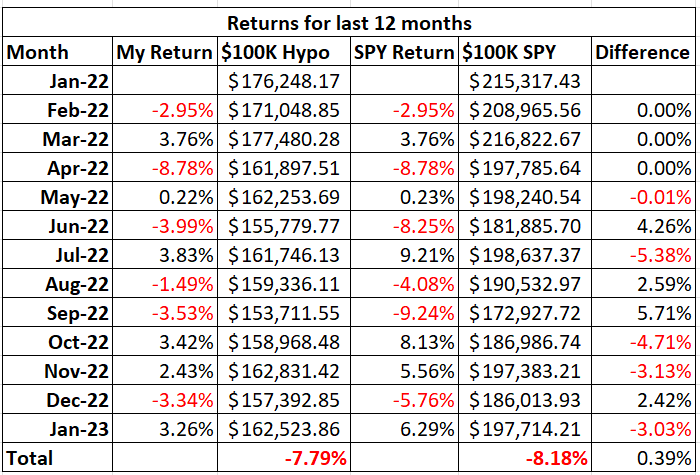
First, let me review my pension plan performance in January. The market, as measured by the S&P 500 Index (SP500), rose 6.18% for the month. As for my pension plan assets, I underperformed the index, as my investment allocation gained 3.26% compared to a much stronger performance from the S&P 500. My investment objective of preserving my capital was met, as I did make money. I did not meet my second investment objective, which is beating the S&P 500 index. Table 1 below shows my returns and allocations for the month of January, and Table 2 below shows my returns for the past 12 months.
I made changes to Table 2 below after I received a comment from a reader. Table 2 shows new columns to better (more accurately) reflect my investment results. The third column, $100K Hypo, is what my returns would be if I had started my account with $100,000 in my first article of this series and followed the allocation recommendations from my articles. The fifth column, $100K SPY, shows the returns of just investing $100,000 and keeping it all allocated to SPY. The percentage returns in the last row show that my strategy returned a negative 7.79% for the last 12 months and simply investing in SPY would have returned a negative 8.18% for the last 12 months. Therefore, I have outperformed SPY for the last 12 months by 0.39%.
Table 1 - Investment Returns for January
Author
Table 2 - Investment Returns Last 12 Months
To review the purpose of this series of articles, my retirement account only allows me to buy the following four exchange-traded funds ("ETFs"): iShares Core U.S. Aggregate Bond ETF ( AGG ), SPDR S&P 500 ETF ( SPY ), iShares Russell 2000 ETF ( IWM ), and iShares MSCI EAFE ETF ( EFA ). I can also have my money in cash. The question is how to decide where and when to allocate money to these various ETFs.
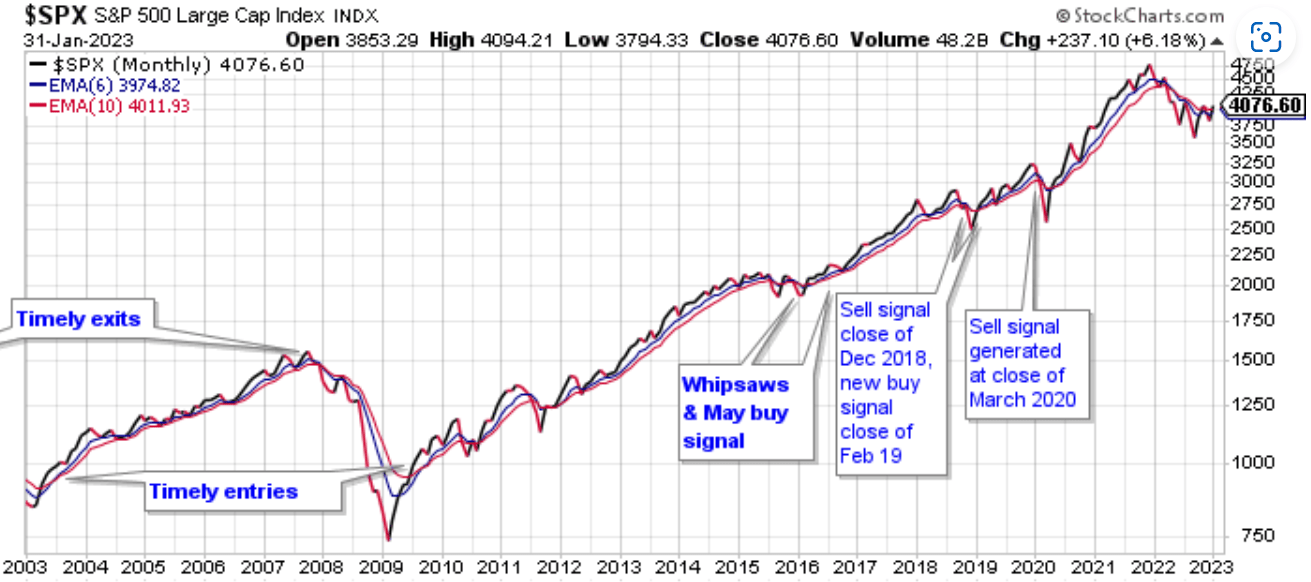
I use my moving average crossover system combined with relative strength charts to determine how to allocate my pension plan assets. My moving average crossover system uses the 6-month and the 10- month exponential moving averages to identify which of the four ETFs are in position to be bought. If the 6-month moving average is above the 10-month moving average, then the ETF is a buy. I call this setup being in bullish alignment. When the 6-month moving average is below the 10-month moving average the setup is referred to as a bearish alignment. When a bearish alignment happens, I don't want to hold that asset. See Chart 1 below for a long-term look at the S&P 500 index using my moving average crossover system.
Chart 1 - Monthly SP 500 Index with 6/10 Moving Averages
You can see that the moving average crossover system provided some excellent long term buy and sell signals that would have allowed investors to capture long duration moves in the index; while avoiding costly drawdowns. Avoiding these costly drawdowns allows me to meet the objective of capital reservation.
I employ this strategy because I do not want to experience a large drawdown with my pension assets. During the 2008 - 2009 market crash many people didn't even look at their retirement statements because they were afraid of what they would find. I submit that if those people would have used a market strategy like what I outline in this series of articles, they would have been able to avoid much of the decline during the bear market and consequently would have had less emotional stress during that time period.
The following charts show the status of the ETFs that I am allowed to buy in my retirement account.
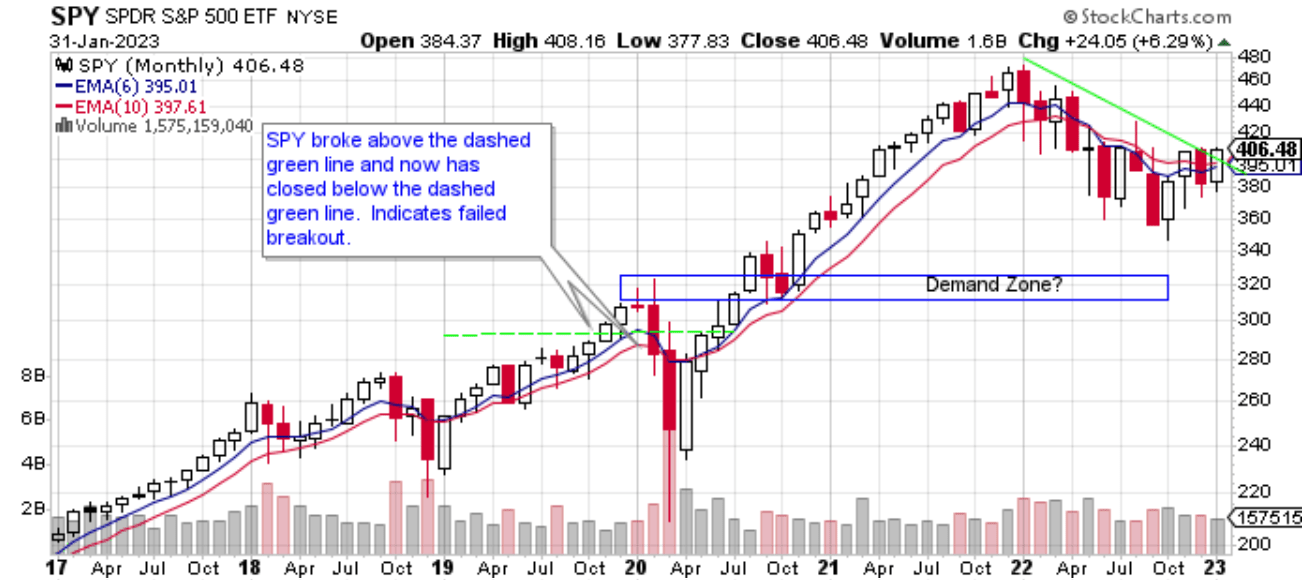
Chart 2 - Monthly SPY with 6/10 Moving Averages
Chart 2 shows that SPY gained 6.29% in January. That is starting the year off right. Volume was less than last month. SPY is about where it was nine months ago. The market has traded sideways since May 2022 yet is showing signs of a new bull market. SPY looks more bullish than it has since late 2021. SPY is above its red 10-month moving average. January's close is its highest close in nine months. SPY closed above the downward sloping trendline drawn in green. Both its red 10-month and blue 6-month moving averages look to be trending higher. The next bullish step to take for SPY is a crossover of the blue and red moving averages. Then SPY would be in bullish alignment. As I have said in previous articles, I do like to have some exposure to SPY for when the bear market ends, and the next rally starts. The next rally may have already started back in October.
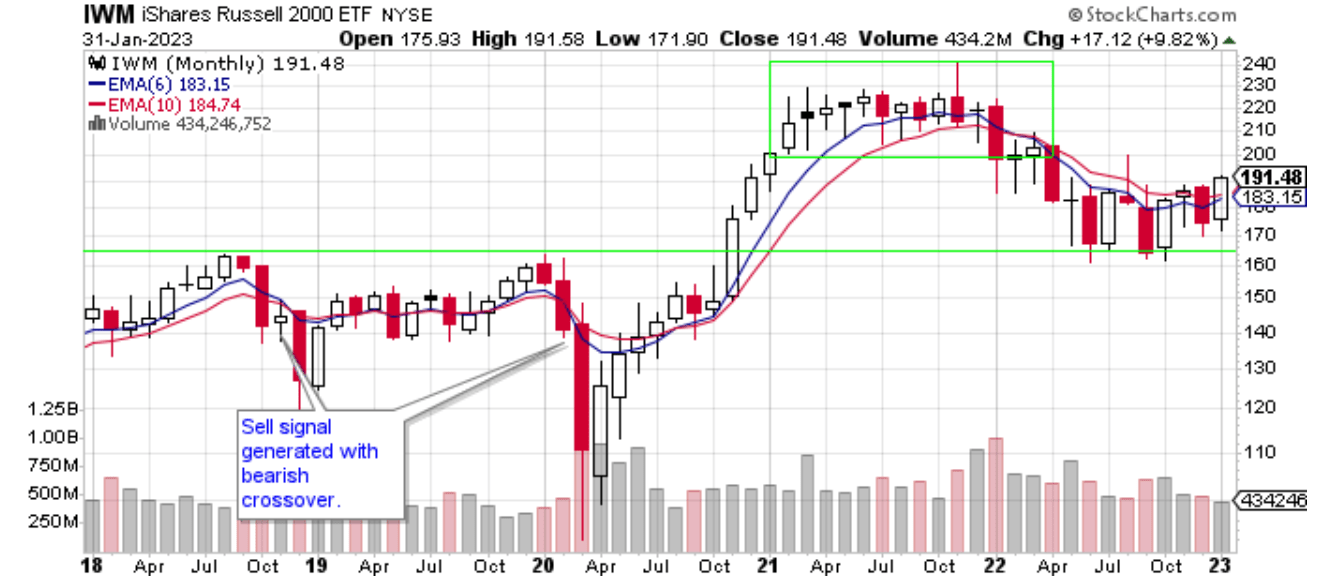
Chart 3 - Monthly IWM with 6/10 Moving Averages
Chart 3 shows that small cap stocks gained 9.82% in January. This was the best performing ETF that I follow. Volume was less than the previous month. Everything I said about SPY in Chart 2, can be said for IWM in Chart 3. IWM looks bullish to me.
Chart 4 - Monthly IWM:SPY Relative Strength
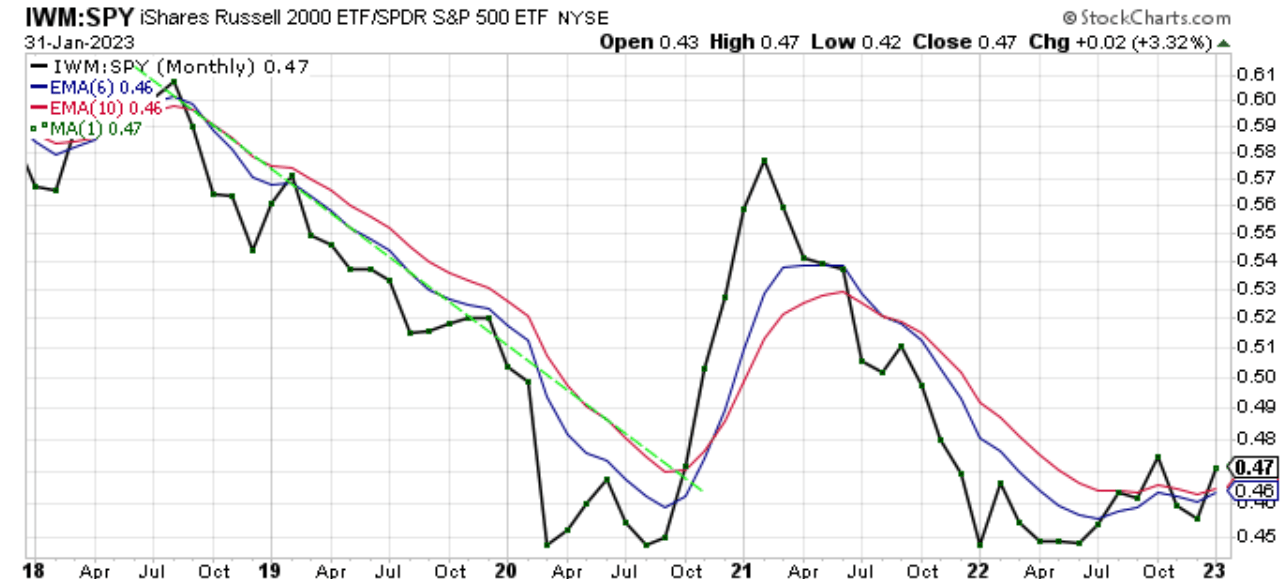
Last month I said that the IWM:SPY ratio may be bottoming. More confirmation of that can be seen above. So far, the bottom made in June has held. The ratio looks like it made a higher high in October and now a higher low in December. For the second time in the last four months the ratio closed above both moving averages. That is bullish. The information in Chart 3 and in Chart 4 tell me a 20% allocation to IWM is warranted. Next, I need to see a moving average crossover that would put the ratio in bullish alignment.
Chart 5 - Monthly EFA with 6/10 Moving Averages
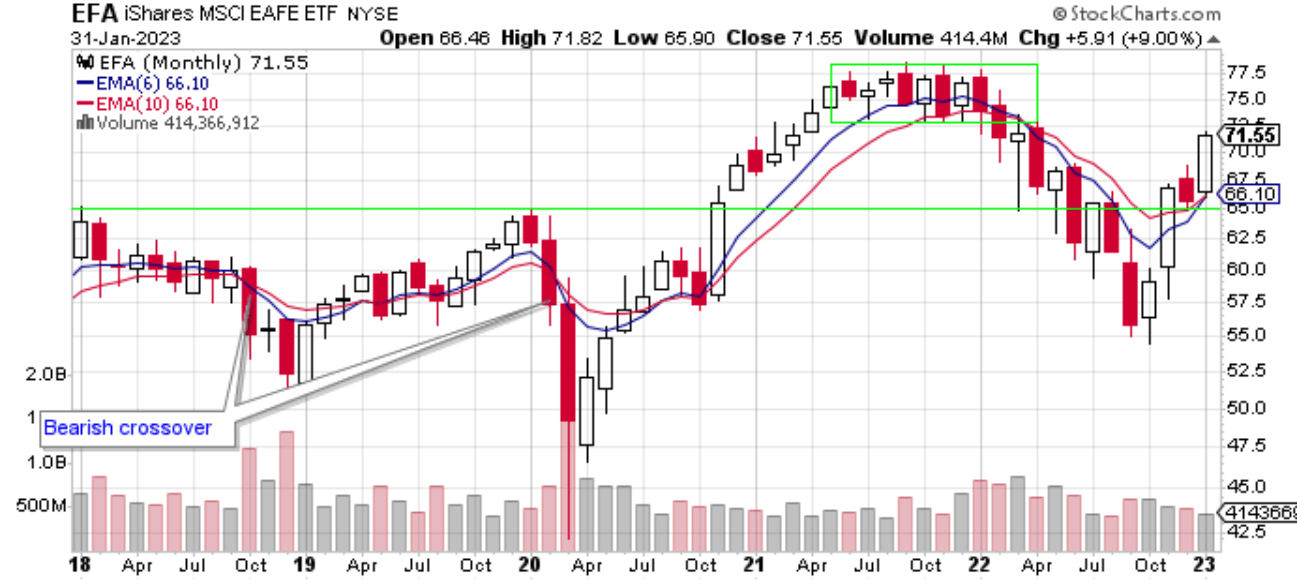
EFA has the strongest looking chart. Chart 5 shows that EFA gained 9.00% in January. It closed well above both moving averages which are now in bullish alignment. Foreign stocks are leading the new bull market.
Chart 6 - Monthly EFA:SPY Relative Strength
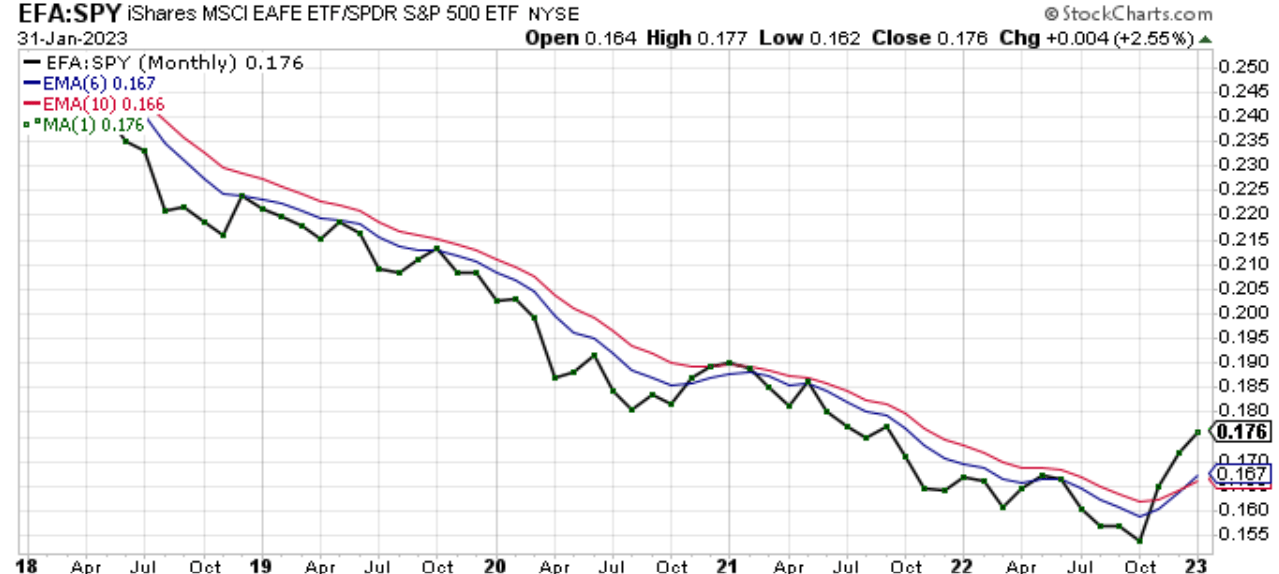
Chart 6 shows that the EFA:SPY ratio gained 2.55% in January. The ratio is now in bullish alignment. Because of this strong performance I will increase my exposure to EFA to 30% of my retirement assets.
Chart 7 - Monthly EFA:IWM Relative Strength
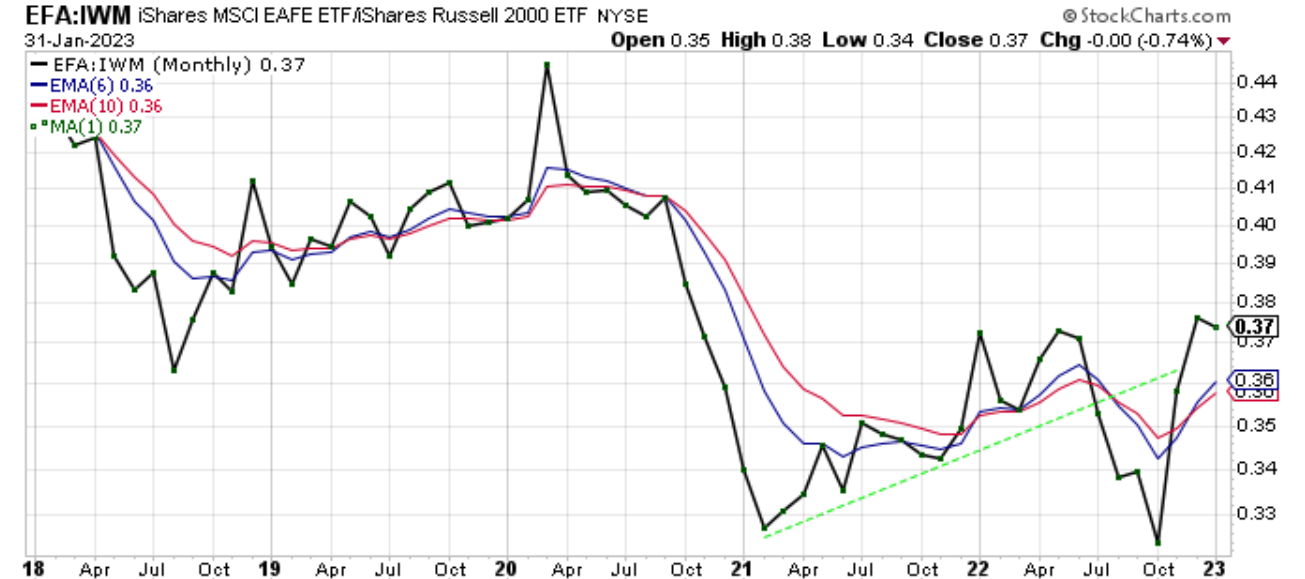
Chart 7 shows that EFA underperformed IWM in January by 0.74%. The ratio closed above the dashed green line and the ratio remains above the highs made earlier this year. These developments are both bullish.
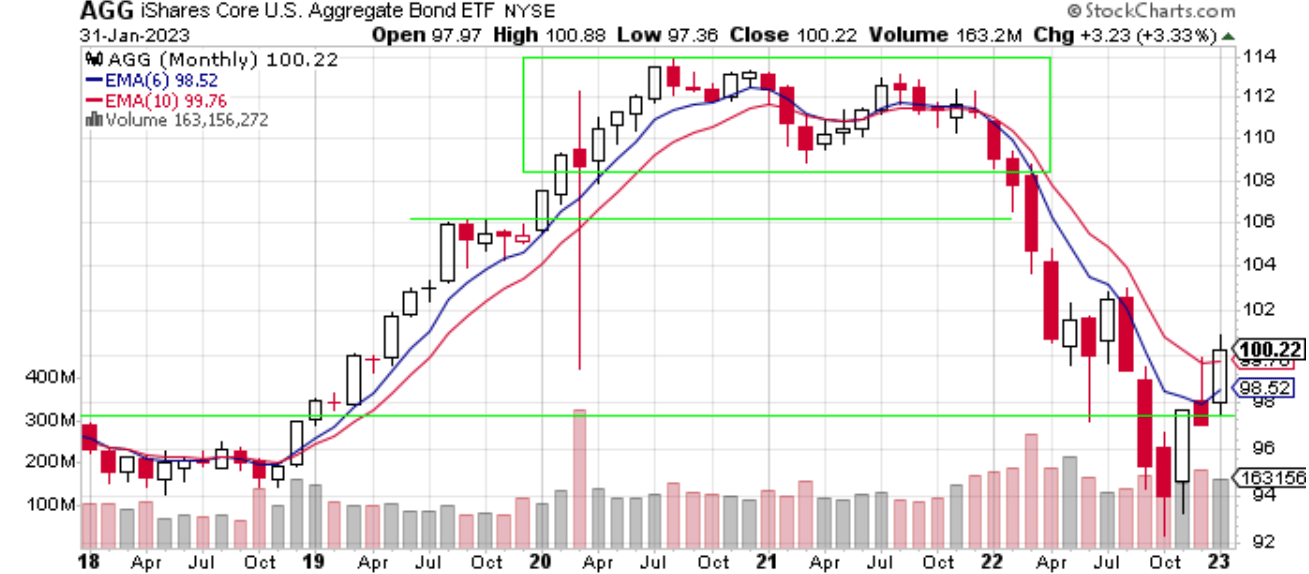
Chart 8 - Monthly AGG with 6/10 Moving Averages
Chart 8 shows that AGG gained 3.33% in January. For the first time in more than a year, AGG has closed above its red 10-month moving average. That is a bullish development. Both moving averages may now be sloping upwards. We will see if this strength continues.
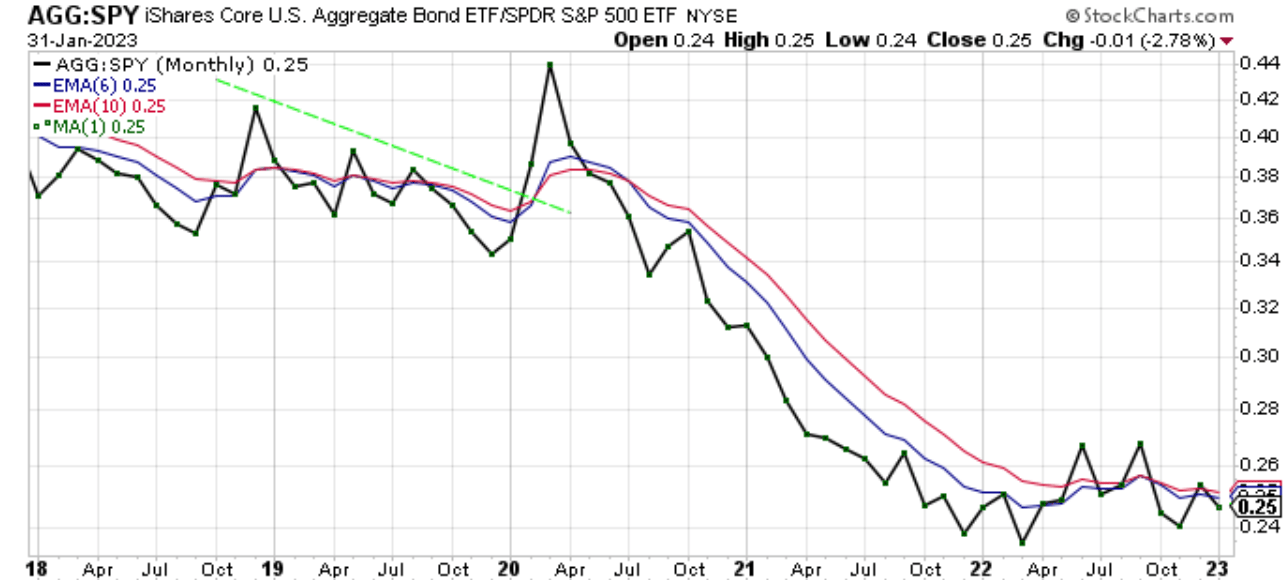
Chart 9 - Monthly AGG:SPY Relative Strength
The AGG:SPY ratio in Chart 9 lost 2.78% as AGG underperformed SPY in January. The ratio is trading in a consolidation pattern, moving sideways since mid-2021. The next step is for the ratio to put in a series of higher highs and higher lows. Then the ratio can get to bullish alignment.
In summary, January was a bullish month for all four asset classes. All the equity ETFs look bullish. Even AGG looks somewhat bullish. These bullish charts warrant more exposure in my opinion. I am increasing my exposure to EFA to 30%, and I am adding a 20% allocation to IWM. I am maintaining my 20% exposure to SPY. I am holding a 30% cash position as SPY and IWM are still not in bullish alignment. Once I see that I would be inclined to have all my money in the market. So far, the new year is starting off bullish. We will see if that bullish behavior can continue in February.
For further details see:
My Current View Of The S&P 500 Index: February 2023 Edition (Technical Analysis)