SPY - My Current View Of The S&P 500 Index: January 2023 Edition (Technical Analysis)
Summary
- Reducing my exposure to SPY.
- Adding exposure to EFA.
- US equities still trending lower.
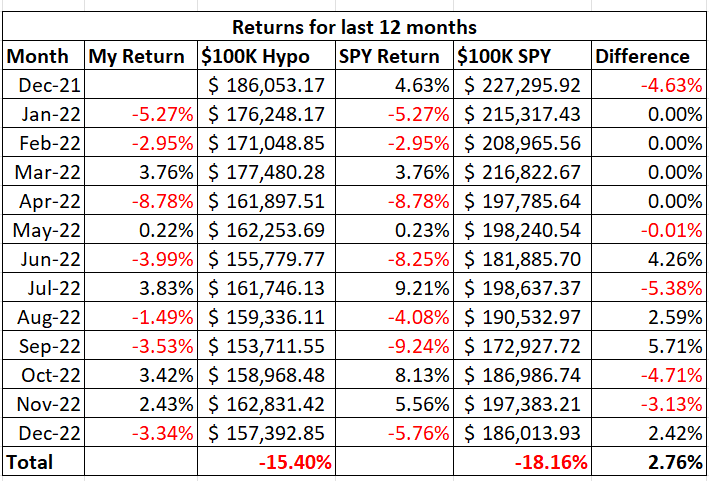
Happy New Year everyone. In this month’s article I outline why I am decreasing my January’s allocation to the SPDR S&P 500 Trust ETF ( SPY ) to 20%, adding 20% to iShares MSCI EAFE ETF ( EFA ), and putting the other 60% of my assets in cash. First let me review my pension plan performance in December. The market, as measured by the S&P 500 index, lost 5.90% for the month. As for my pension plan assets, I outperformed the index as my investment allocation lost -3.34%. My investment objective of preserving my capital was met as I did make money. I did not meet my second investment objective which is beating the S&P 500 index. Table 1 below shows my returns and allocations for the month of November and Table 2 below shows my returns for the past 12 months.
I have made changes to Table 2 below after I received a comment from a reader. Table 2 shows new columns to better (more accurately) reflect my investment results. The third column, $100K Hypo, is what my returns would be if I started my account with $100,000 in my first article of this series and followed the allocation recommendations from my articles. The fifth column, $100K SPY, shows the returns of just investing $100,000 and keeping it all allocated to SPY. The percentage returns in the last row show that my strategy returned a negative 15.40% for the last 12 months and simply investing in SPY would have returned a negative 18.16% for the last 12 months. Therefore, I have outperformed SPY for the last 12 months by 2.76%.
Table 1 – Investment Returns for December
Author
Table 2 – Investment Returns Last 12 Months
To review the purpose of this series of articles, my retirement account only allows me to buy the following four ETFs: iShares Core U.S. Aggregate Bond ETF ( AGG ), SPDR S&P 500 ETF, iShares Russell 2000 ETF ( IWM ), and iShares MSCI EAFE ETF. I can also have my money in cash. The question is how to decide where and when to allocate money to these various ETFs.
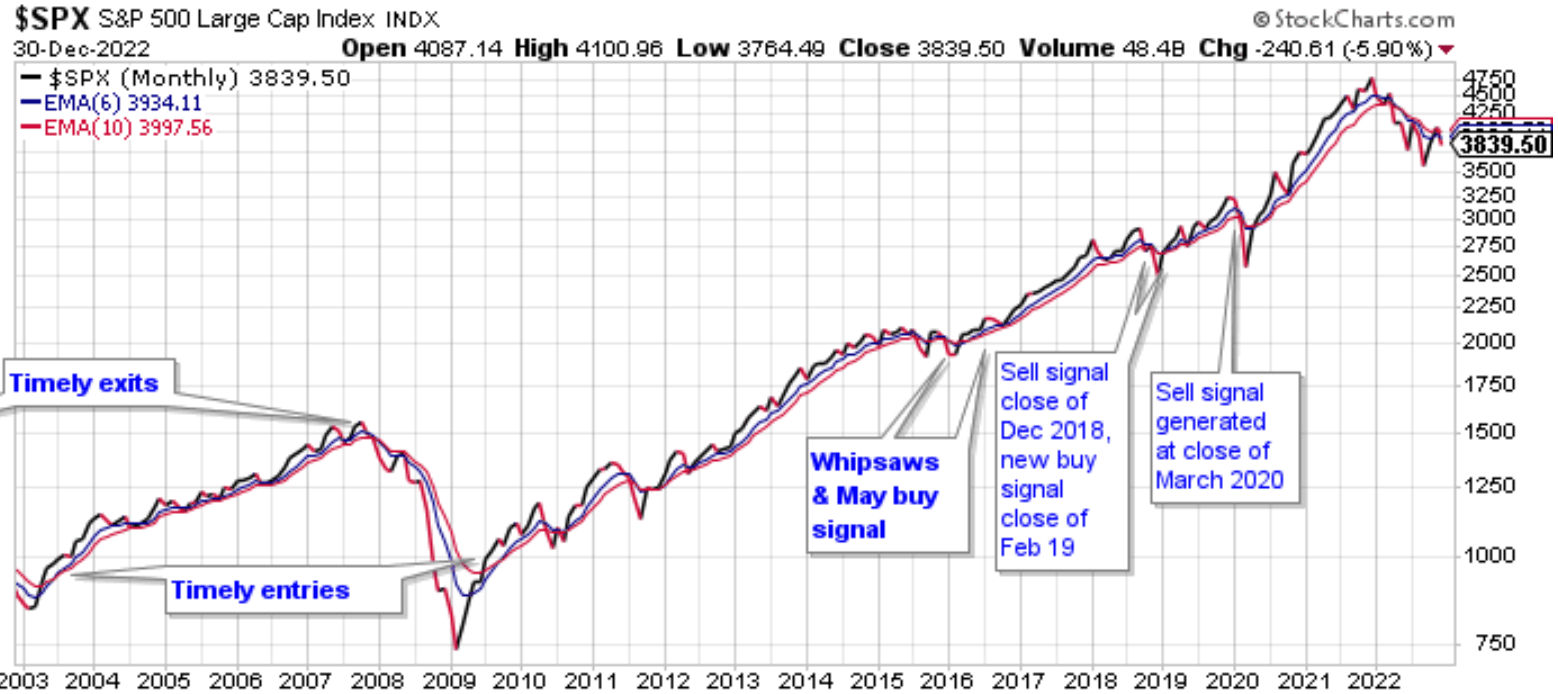
I use my moving average crossover system combined with relative strength charts to determine how to allocate my pension plan assets. My moving average crossover system uses the 6-month and the 10-month exponential moving averages to identify which of the four ETFs are in position to be bought. If the 6-month moving average is above the 10-month moving average, then the ETF is a buy. I call this setup being in bullish alignment. When the 6-month moving average is below the 10-month moving average the setup is referred to as a bearish alignment. When a bearish alignment happens, I don’t want to hold that asset. See Chart 1 below for a long-term look at the S&P 500 index using my moving average crossover system.
Chart 1 – Monthly SP 500 Index with 6/10 Moving Averages
You can see that the moving average crossover system provided some excellent long term buy and sell signals that would have allowed investors to capture long duration moves in the index; while avoiding costly drawdowns. Avoiding these costly drawdowns allows me to meet the objective of capital reservation.
I employ this strategy because I do not want to experience a large drawdown with my pension assets. During the 2008 - 2009 market crash many people didn't even look at their retirement statements because they were afraid of what they would find. I submit that if those people would have used a market strategy like what I outline in this series of articles, they would have been able to avoid much of the decline during the bear market and consequently would have had less emotional stress during that time period.
The following charts show the current status of the ETFs that I am allowed to buy in my retirement account.
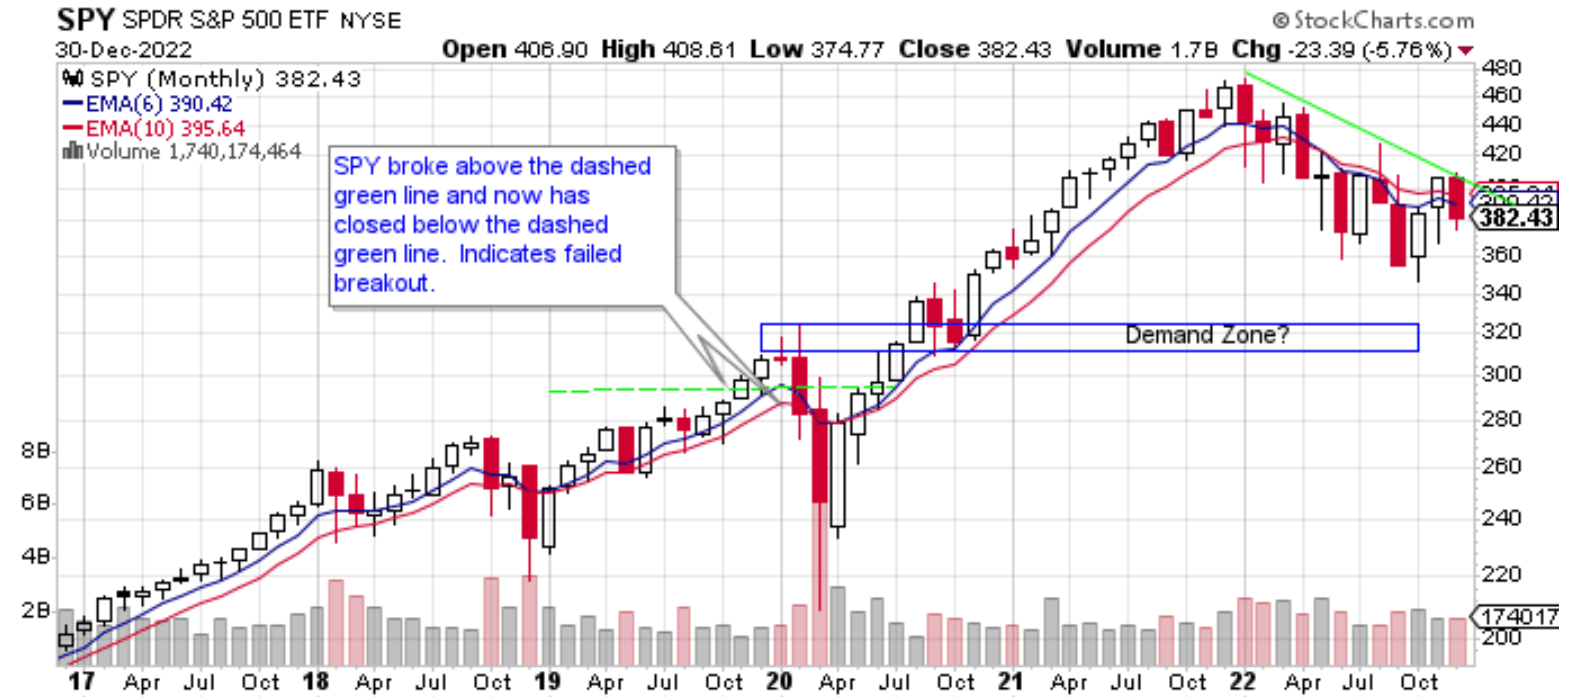
Chart 2 – Monthly SPY with 6/10 Moving Averages
Chart 2 shows that SPY lost 5.76% in December. It negated its gain made in November. Volume was less than last month. SPY tested the green trendline, was rejected, and then closed lower for the month. SPY is in bearish alignment as it closed below both of its moving averages. SPY is bearish which is why I am reducing my exposure to SPY for the month of January to 20%. As I have said in previous articles, I do like to have some exposure to SPY for when the bear market ends, and the next rally starts.
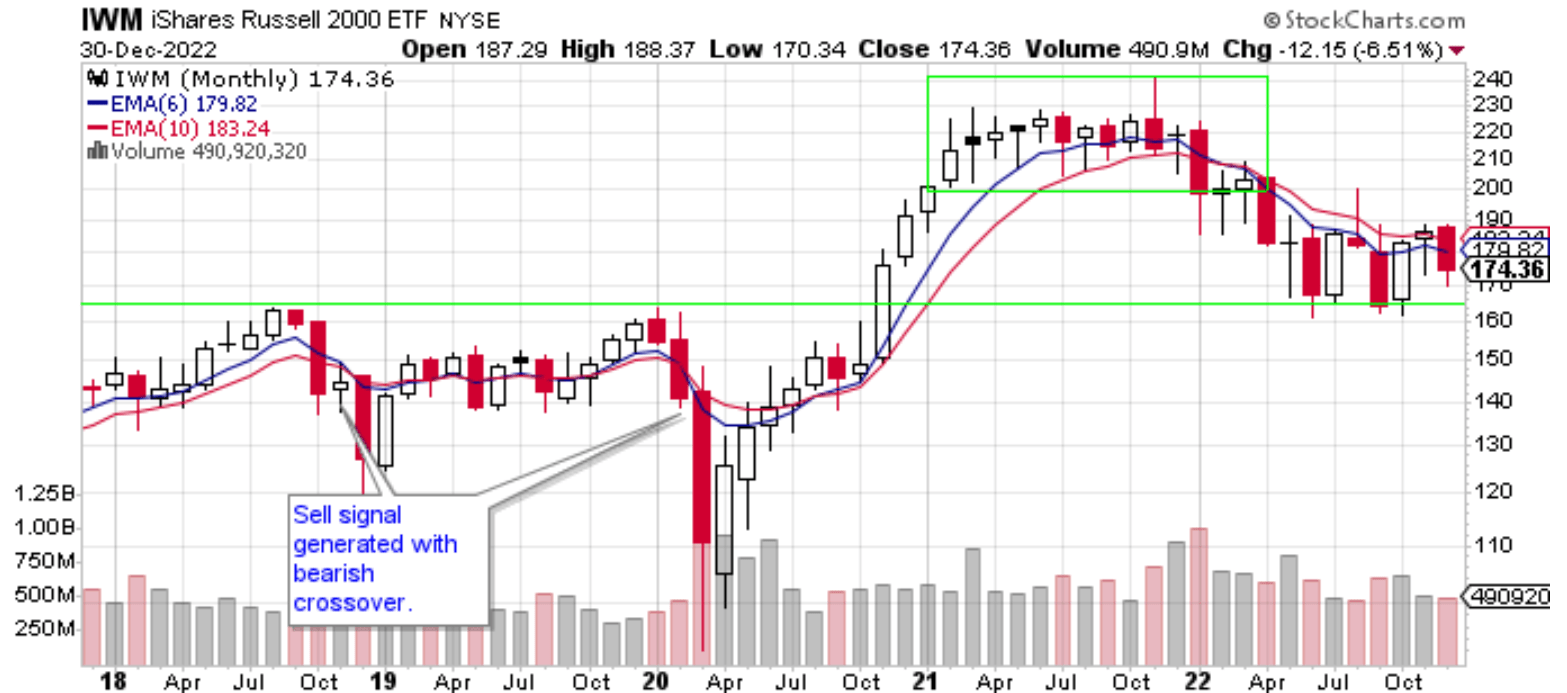
Chart 3 – Monthly IWM with 6/10 Moving Averages
Chart 3 shows that small cap stocks lost 6.51% in December. Volume was less than the previous month. Like SPY above, IWM closed below both its moving averages and is in bearish alignment. It will be interesting to see if IWM can hold above the green line that has acted as support for the last few months. The trend remains down for IWM.
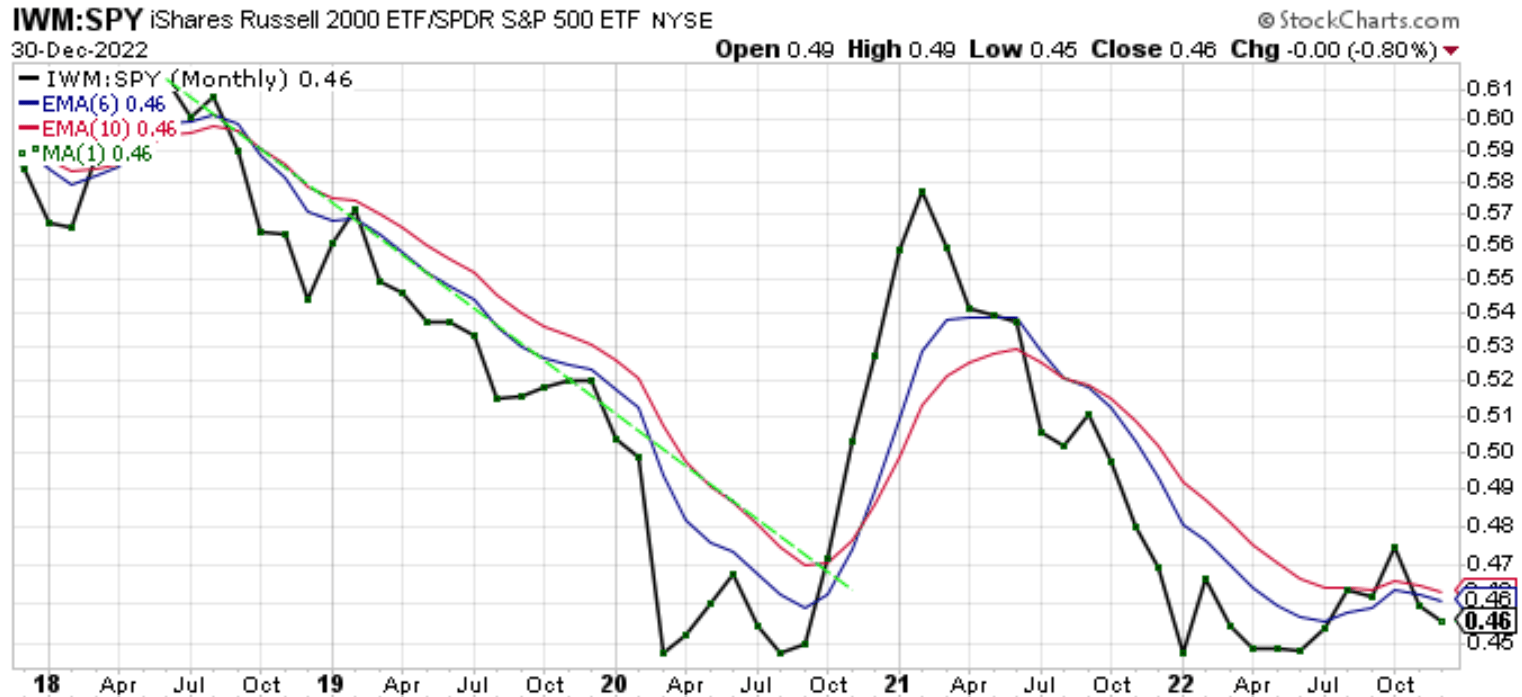
Chart 4 – Monthly IWM:SPY Relative Strength
Chart 4 shows that the IWM:SPY ratio is perhaps bottoming. So far, the bottom made in June has held. The IWM:SPY ratio lost 0.80% in December and remains in bearish alignment. That is the reason I am not allocating money to IWM.
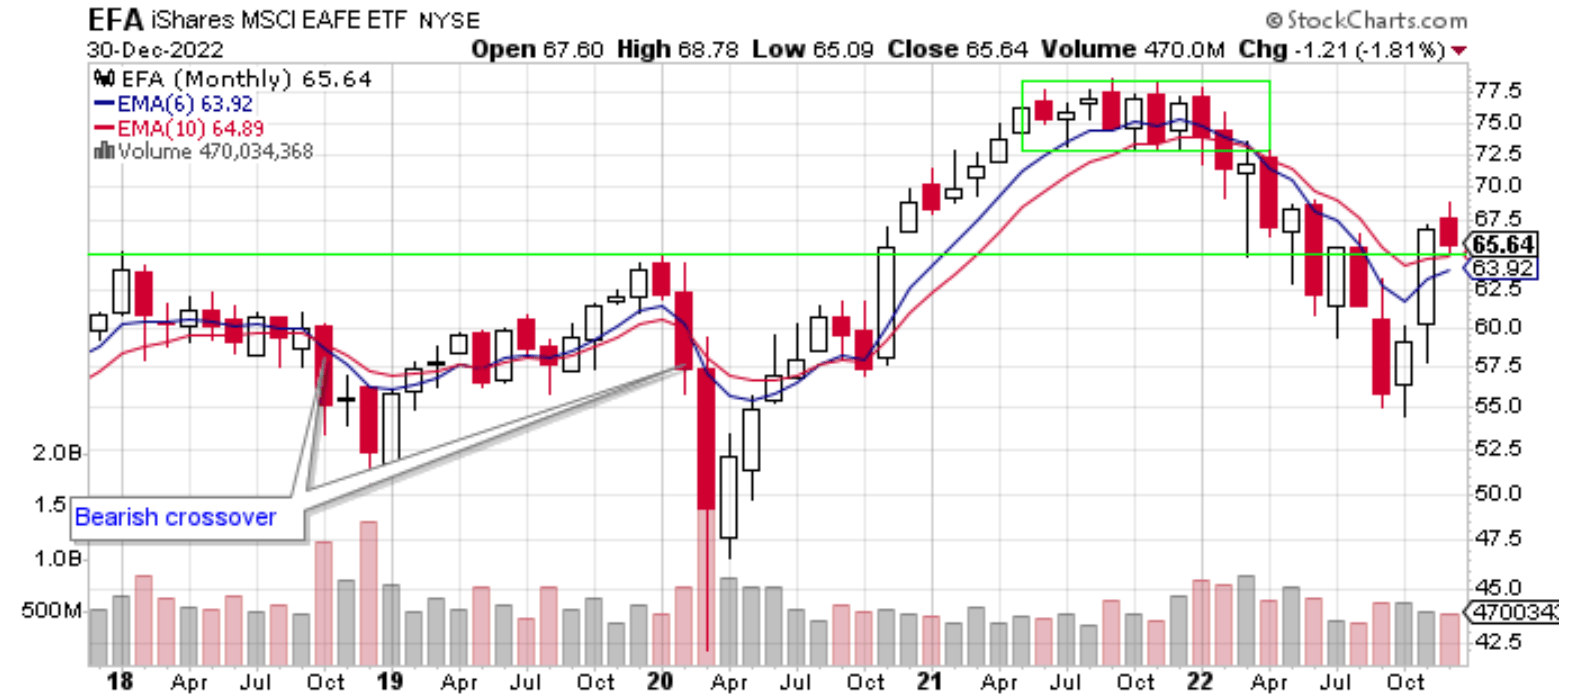
Chart 5 – Monthly EFA with 6/10 Moving Averages
EFA is interesting. Chart 5 shows that EFA lost 1.81% in December. This is a small give back compared to its 11% gain in November. EFA has held above both of its moving averages and the green line which is now acting as support. Both moving averages are trending higher which is bullish. I am interested to see how EFA performs in January.
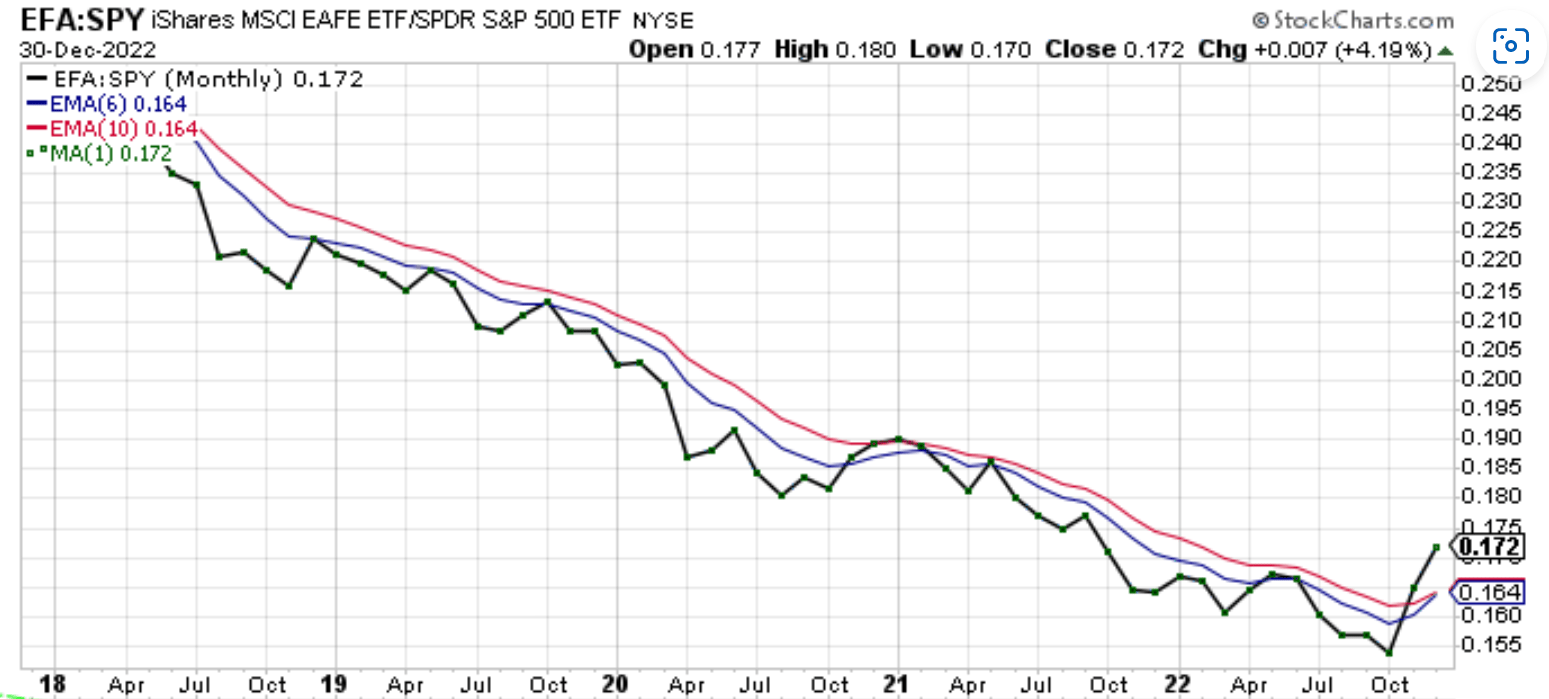
Chart 6 – Monthly EFA:SPY Relative Strength
Chart 6 shows that the EFA:SPY ratio gained 4.19% in December. This adds to its gains from November. The ratio is about to go into bullish alignment. For reasons I don’t know, foreign stocks are outperforming US equites. Chart 5 and Chart 6 tell me I should have some exposure to EFA. I will allocate 20% to EFA in January.
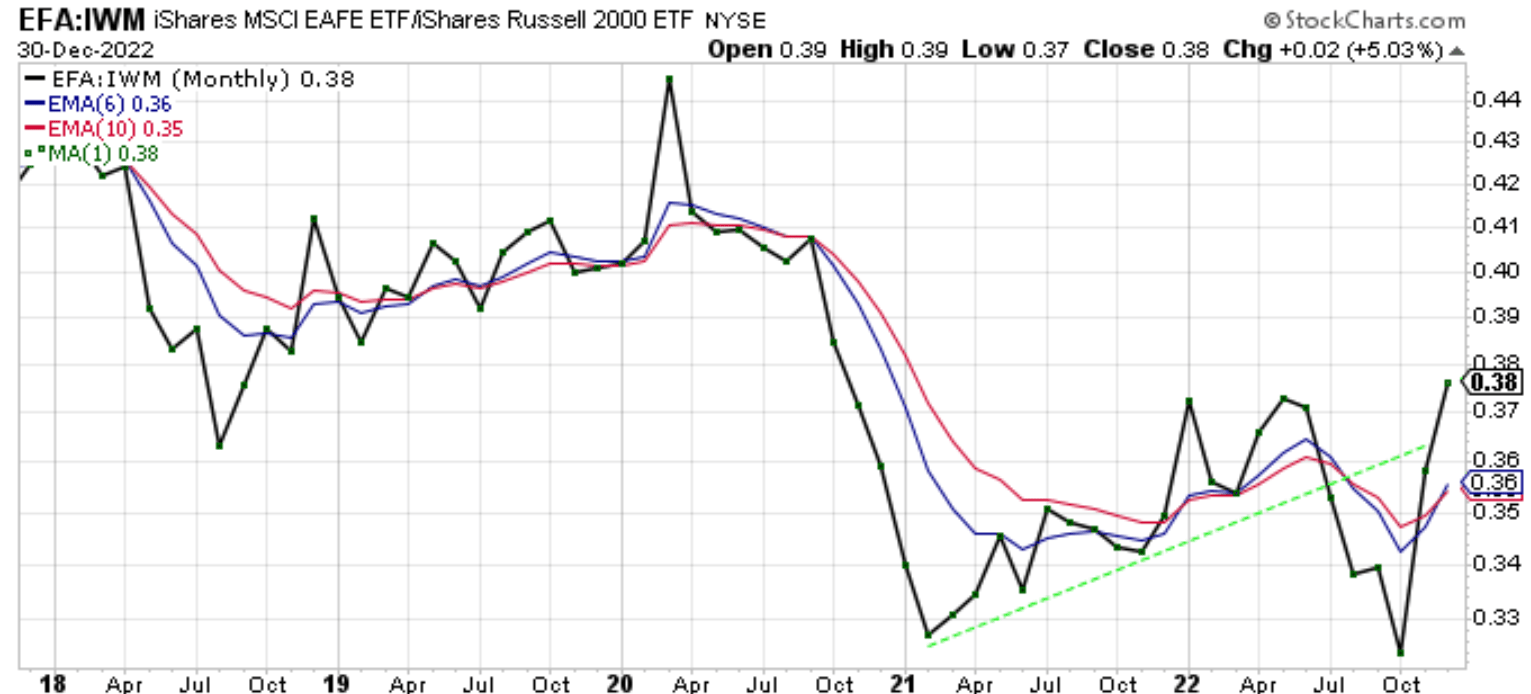
Chart 7 – Monthly EFA:IWM Relative Strength
Chart 7 shows that EFA outperformed IWM in December by 5.03%. The ratio closed above the dashed green line and the ratio has closed above the highs made earlier this year. These developments are both bullish. Speaking of bullish, the EFA:IWM ratio is now in bullish alignment. EFA is outperforming small cap and large cap US stocks. I will continue to watch this chart to see how events unfold.
Chart 8 – Monthly AGG with 6/10 Moving Averages
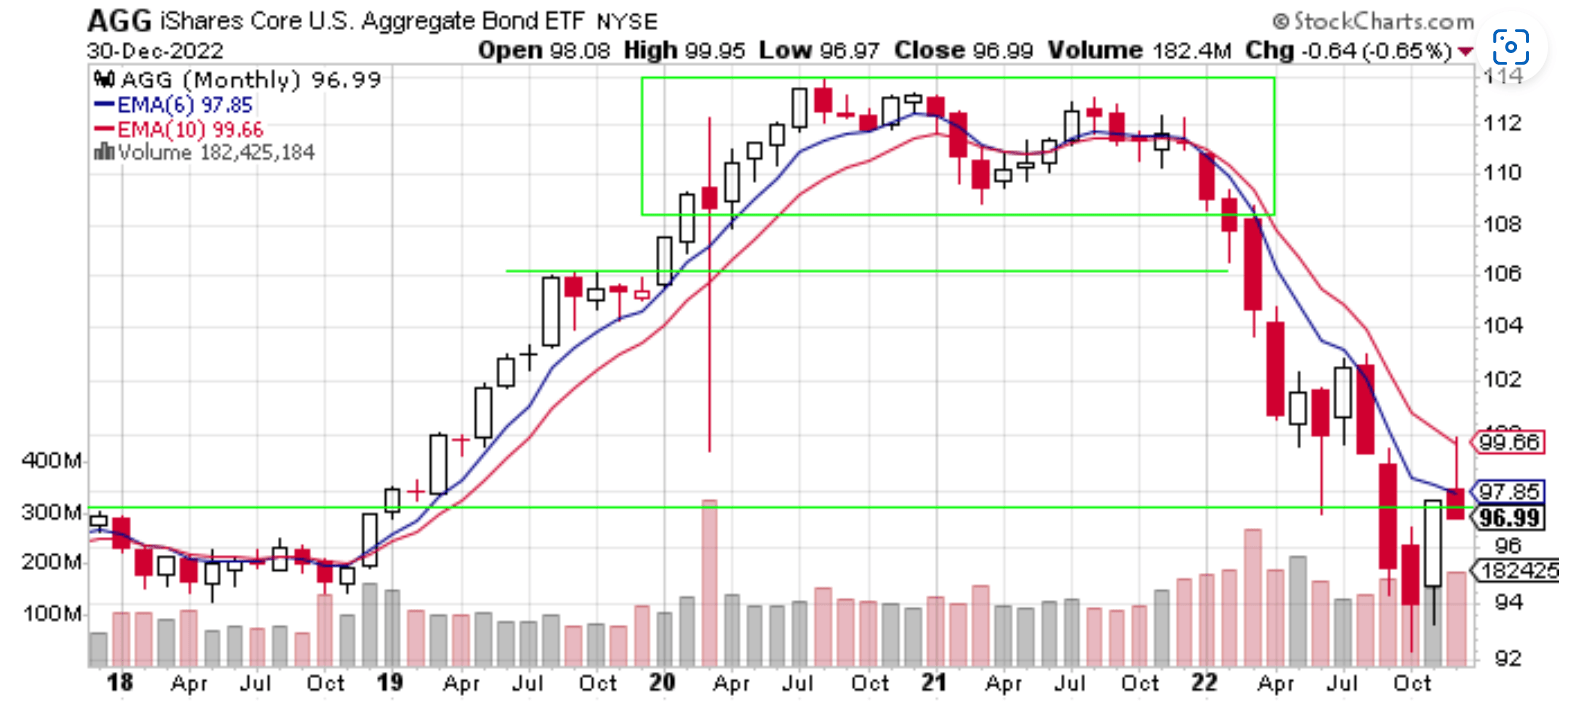
Chart 8 shows that AGG lost 0.65% in December. AGG remains in bearish alignment. December’s candle was a bearish one. It has a long upper wick and closed at the lows of the month. AGG also closed below the green horizontal line. The trend of AGG continues to be down.
Chart 9 – Monthly AGG:SPY Relative Strength
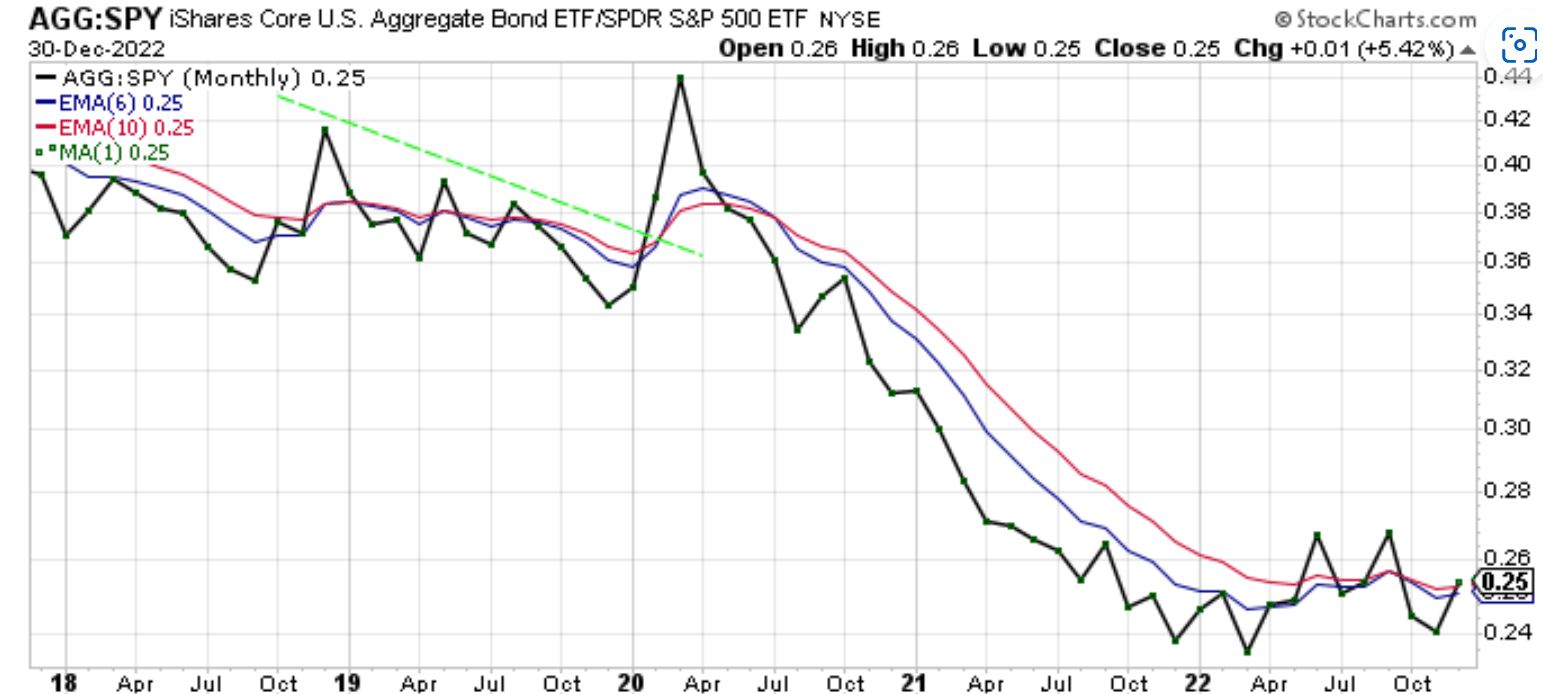
The AGG:SPY ratio in Chart 9 gained 5.42% as AGG outperformed SPY in December. The ratio is again trying to reach bullish alignment.
In summary, December was a down month for all the ETFs I follow. Due to SPY losing its 10-month moving average I am decreasing my allocation to SPY from 40% to 20%. EFA was the only EFT I follow that was able to hold its 10-month moving average. The EFA:SPY ratio is also in bullish alignment. Therefore, I am allocating 20% of my pension assets to EFA. The other 60% of my pension assets will remain in cash. I will be more aggressive when I see the ETFs get into bullish alignment where price is above both moving averages and the blue 6-month moving average is above the red 10-month moving average. I am looking forward to seeing what the markets have in store for 2023. Happy New Year everyone.
For further details see:
My Current View Of The S&P 500 Index: January 2023 Edition (Technical Analysis)