SHEL - My Dividend Stock Portfolio: New February Record - 99 Holdings With 32 Buys And 4 Sales
2023-03-07 09:15:00 ET
Summary
- Inflation and (expected) actions by the Federal Reserve continue to dominate market movements.
- Markets have started the new year with very solid gains following expectations about a more dovish Federal Reserve and a solid earnings season.
- My dividend income in February amounted to roughly $430.
- Gifted Working Time in 2023: Around 37 hours or 4.7 days of active work have been replaced with passive income in 2023 already.
Portfolio Changes in February
Investment activity in February was simply crazy due to two special circumstances:
- My remaining shares of STORE Capital were paid back as the acquisition and going public was formally concluded
- My concerns and above average exposure to Medical Properties Trust ( MPW ) caused me to make the harsh decision to basically cut my stake by 2/3 before buying back portions following better than expected earnings.
Both events meant that I was suddenly getting some sizable cash inflows but also significantly lower dividend income. As I neither like a big cash position nor lower dividend income and as lots of stocks still were boasting attractive prices I redeployed most of these funds during the month.
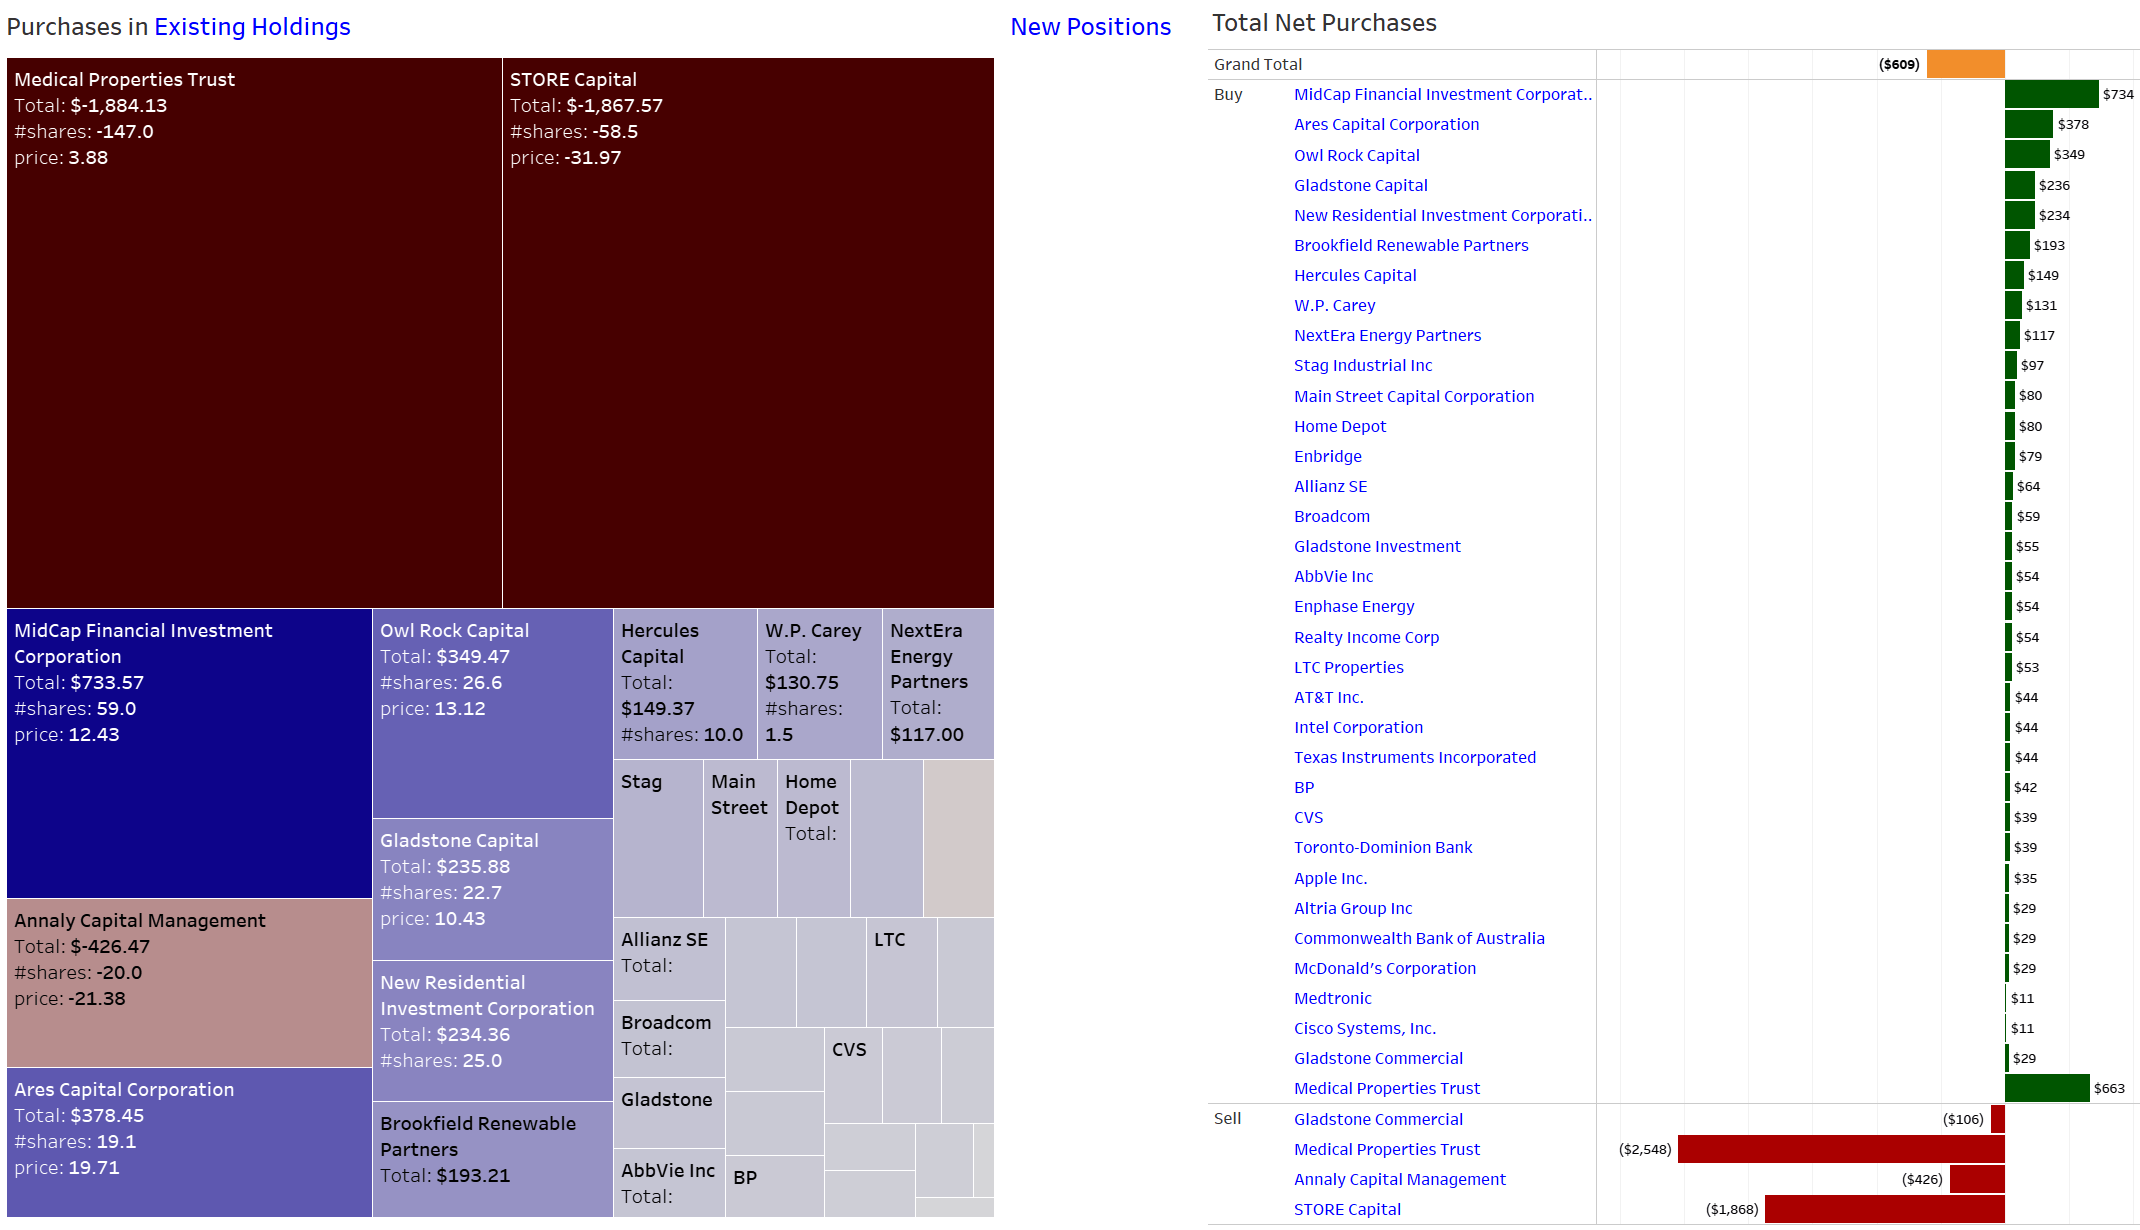
Overall though, I finished the month with negative net investments of -$609 but given I have to pay a big tax payment for 2021 in March this additional money is actually appreciated.
Additionally, to these two big sales I also sold my small position in Annaly Capital Management ( NLY ) as the future dividend is expected to be substantially lower and given that the stock price has not reacted that negatively to that development I was glad to exit this position almost break-even.
All these funds I mainly deployed into various Business Development Companies (BDCs) as in my view all of these stocks were/are valued far too low given the massive boost to their bottom line amid a rising and high interest rate environment.
While I have been adding very aggressively to Hercules Capital Corporation ( HTGC ) ever since September 2022 I have shifted focus in February mainly to MidCap Financial Investment Corporation ( MFIC ), Ares Capital Corporation ( ARCC ) - which is slowly becoming one of my Top 5 portfolio positions -, Owl Rock Capital ( ORCC ) and Gladstone Capital ( GLAD ).
I have been accumulating my stake in Brookfield Renewable Partners ( BEP ) as the stock continues to trade in a price range I cannot understand and deem far too low regardless of the interest rate level. The earnings results were positive and the expected dividend hike was confirmed, however the stock declined slightly after earnings. I plan to further increase my position in March.
Apart from that most of the other purchases were triggered by the almost weekly savings plans or opportunistic and irregular purchases around earnings dates.
Due to the nature of how the monthly investment plan process works, I am investing relatively equally into these stocks at two points of time during the month - at the beginning of the month and mid-month - which breaks down as shown below. Figures are in Euro and show that, for instance, at the beginning of the month, I am investing between 50 and 75 EUR each into Microsoft ( MSFT ), The Home Depot (NYSE: HD ), Visa (NYSE: V ), W. P. Carey ( WPC ), and BP (NYSE: BP ). Mid-month, I am adding between 33 and 40 EUR each into STAG Industrial (NYSE: STAG ), AT&T ( T ), NextEra Energy (NYSE: NEE ), Toronto-Dominion Bank (NYSE: TD ), Main Street Capital (NYSE: MAIN ) and JPMorgan (NYSE: JPM ).
I have added several investment plans starting mid-September 2020 which include AGNC Investment Corp. (NASDAQ: AGNC ), Ares Capital (NASDAQ: ARCC ), Medical Properties Trust (NYSE: MPW ), The Bank of Nova Scotia (NYSE: BNS ) and The Trade Desk (NASDAQ: TTD ). Investments here will be focused on high-yield as well as high-growth stocks in the technology, therapeutic and renewables sectors.
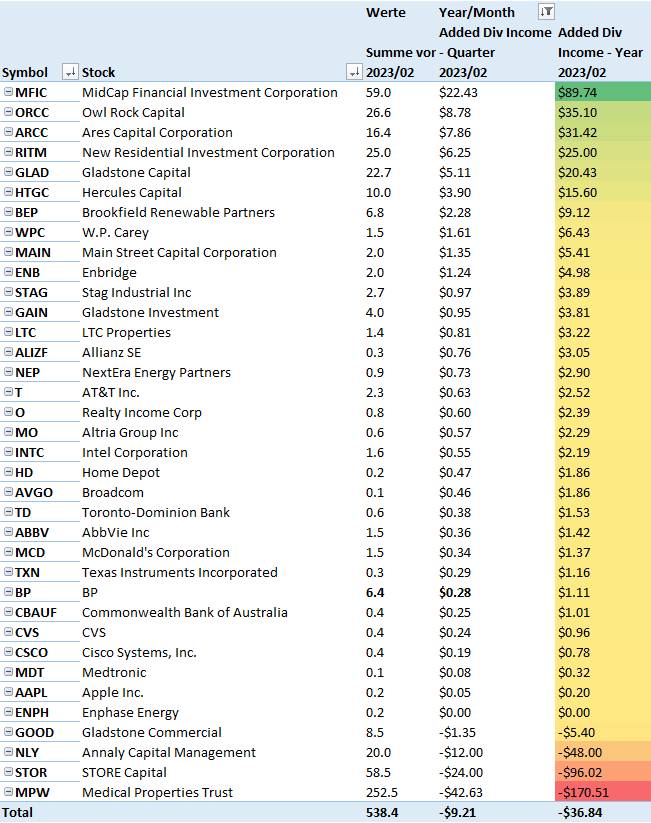
Following the sales of STORE Capital, Medical Properties Trust, Annaly Capital Management and Gladstone Commercial my forward annual dividend income dropped by around $320 and while I was very aggressive in redeploying these funds I came short by around $37. However, in March I expect to add at least $100 to my forward dividend income basis which is my minimum goal every month. All these purchases break down as follows:
Added Dividend Income (Designed by Author)
All net purchases in February can be found below:
Net Purchases (Designed by author)
Dividend Income: What Happened on the Dividend Side?
February is probably the weakest month in terms of dividend income across the entire year and it will take some time to achieve any meaningful growth here. I am regularly buying Texas Instruments ( TXN ), Blackstone ( BX ) and NextEra Energy Partners ( NEP ) as well as monthly dividend payers like Main Street Capital Corporation ( MAIN ), STAG Industrial ( STAG ), Gladstone Capital ( GLAD ), Gladstone Investment ( GAIN ) and Realty Income ( O) but overall the amounts are too small to really make an impact.
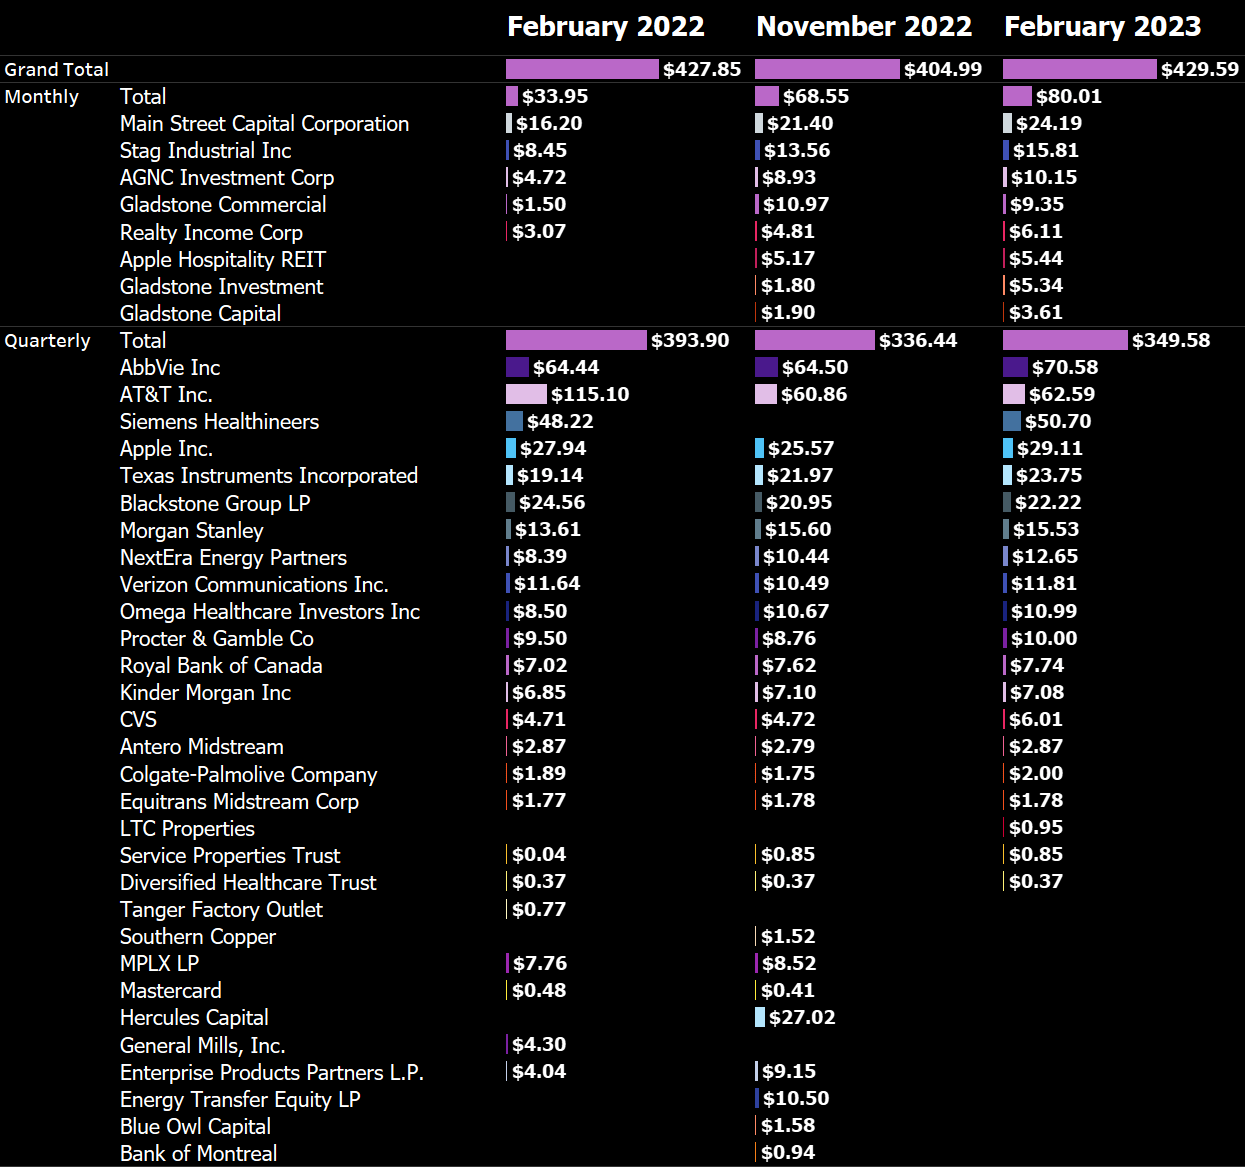
On an annual basis dividend income was pretty much flat and compared to November 2022 it was slightly higher but only due to the annual dividend from Siemens Healthineers. Unfortunately, HTGC which paid me my first dividend in November 2022 for some reason has a different payment pattern and only pays in March. So while that makes the February result pretty poor the March totals will be massive given that I expect that ARCC and HTGC together will already pay me around $200 in net dividends combined.
Dividends from monthly dividend payers have hit $80 and are firmly on their way towards $100. In March that threshold should be cleared for the first time given the huge supplemental dividend from MAIN.
February 2023 Dividend Income (Designed by author)
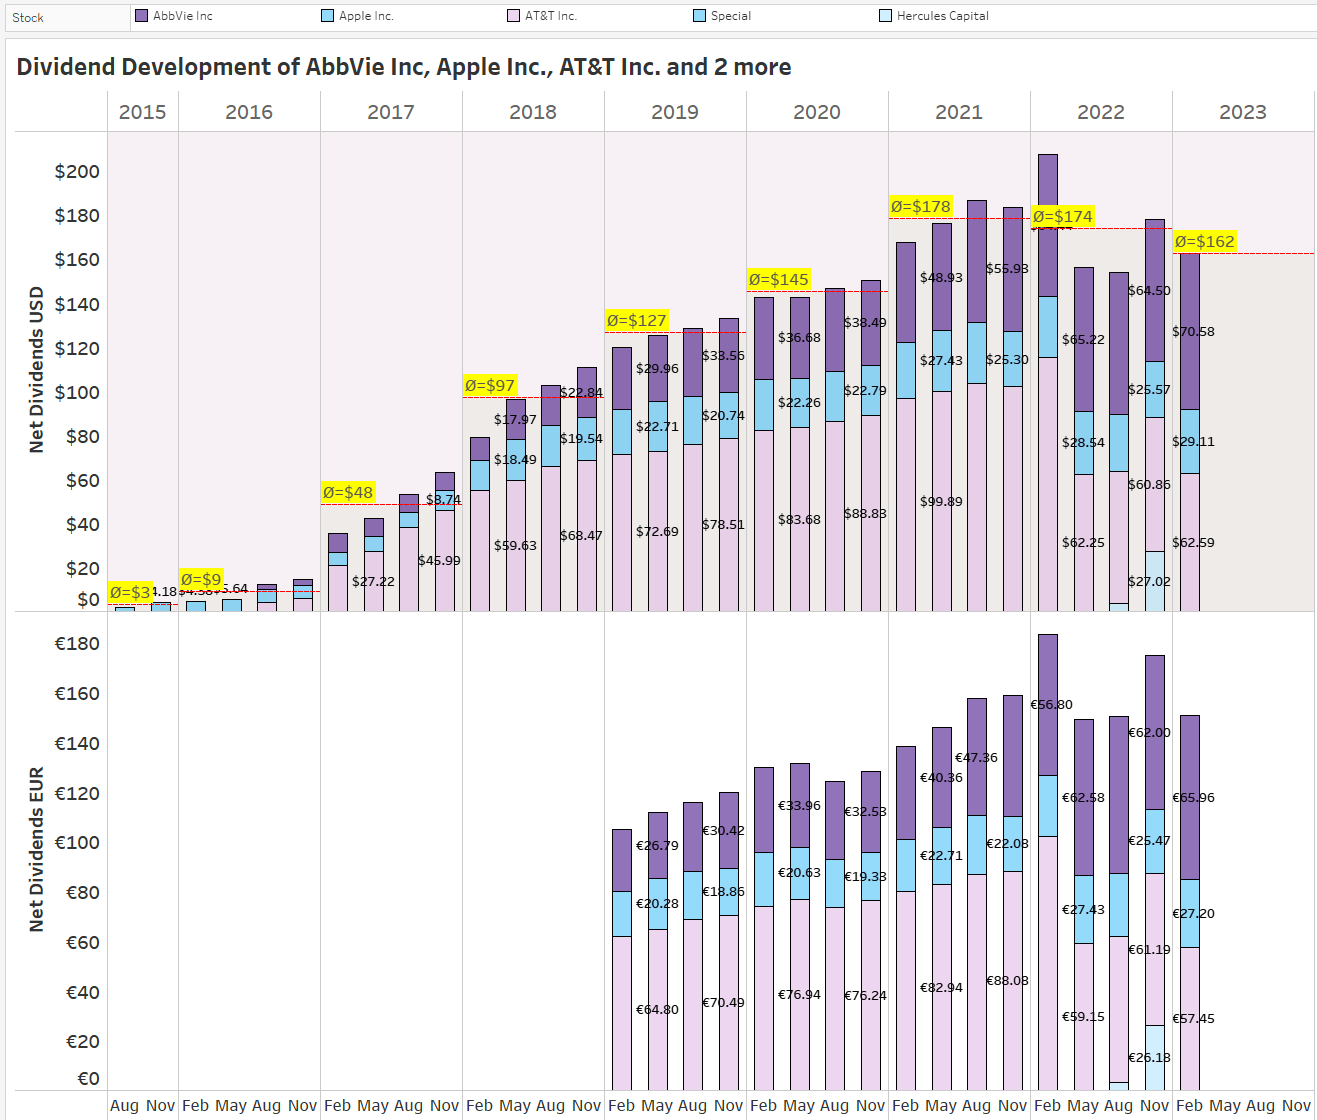
The Top 3 Regular Dividend Payers in February remain AbbVie ( ABBV ), AT&T ( T ) and Apple ( AAPL ) but it won't take long for either MAIN, TXN or BX to get to the #3 spot. Compared to a year ago the huge decrease in dividend income from AT&T becomes blatantly obvious and I still haven't been able to fully replace that loss.
Top 3 Dividend Payers (Designed by author)
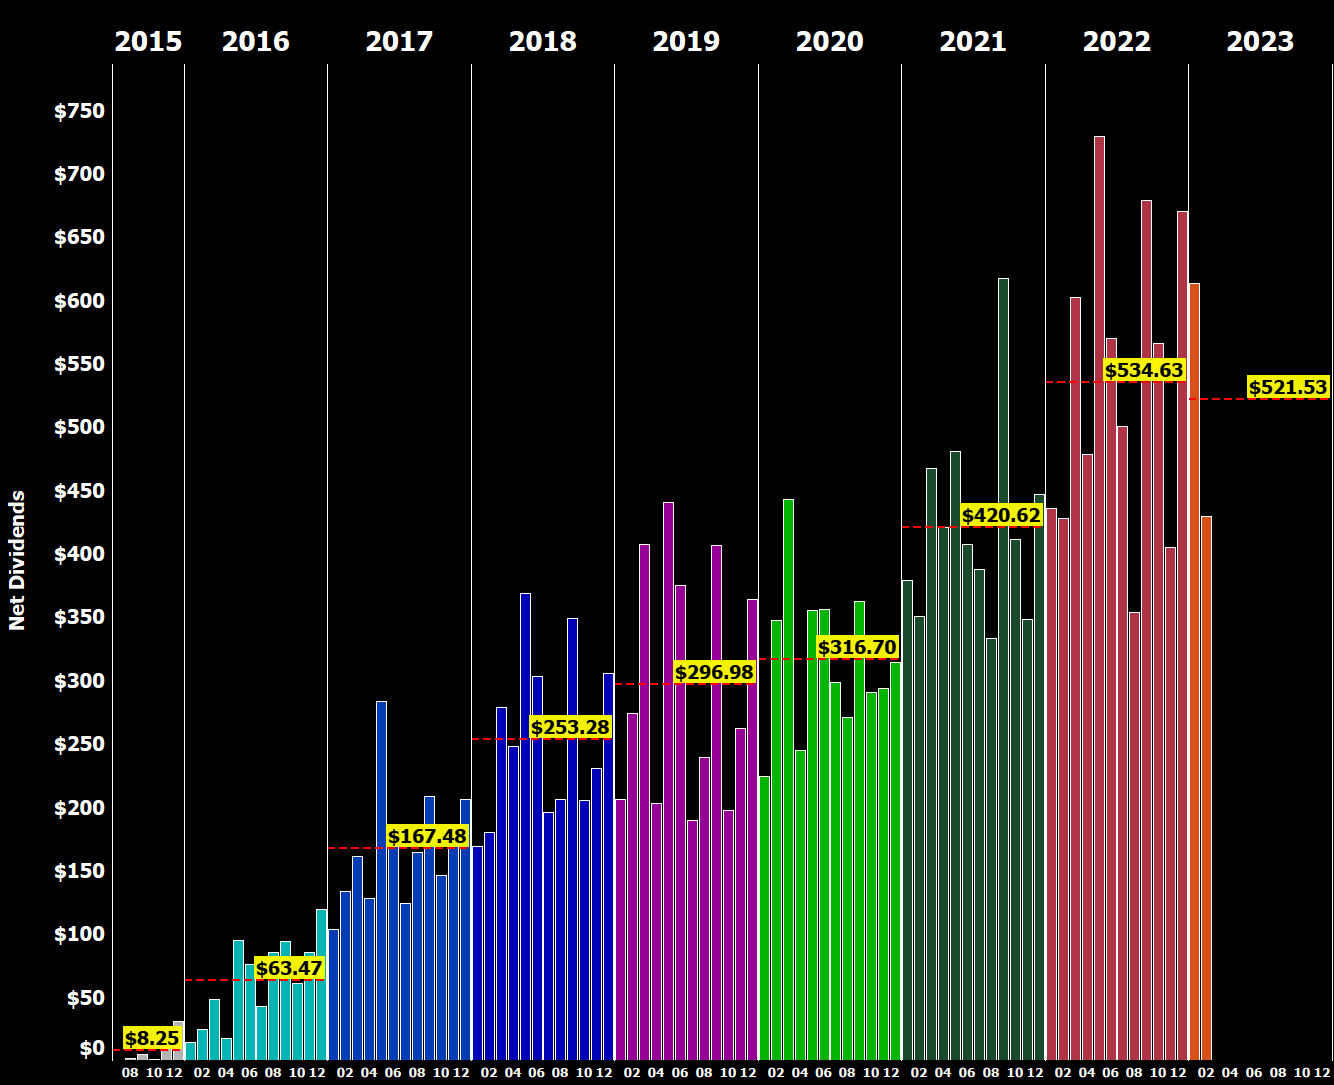
Here is a chart that shows the development of my net dividend income by month over time between 2015 and 2023. You can see the growth of my dividend income and the average annual dividend for each year:
All-time Dividend Development (Designed by author)
This chart is my favorite because it illustrates the progression of my dividend income over time and allows me to easily see the average annual dividend for each year.
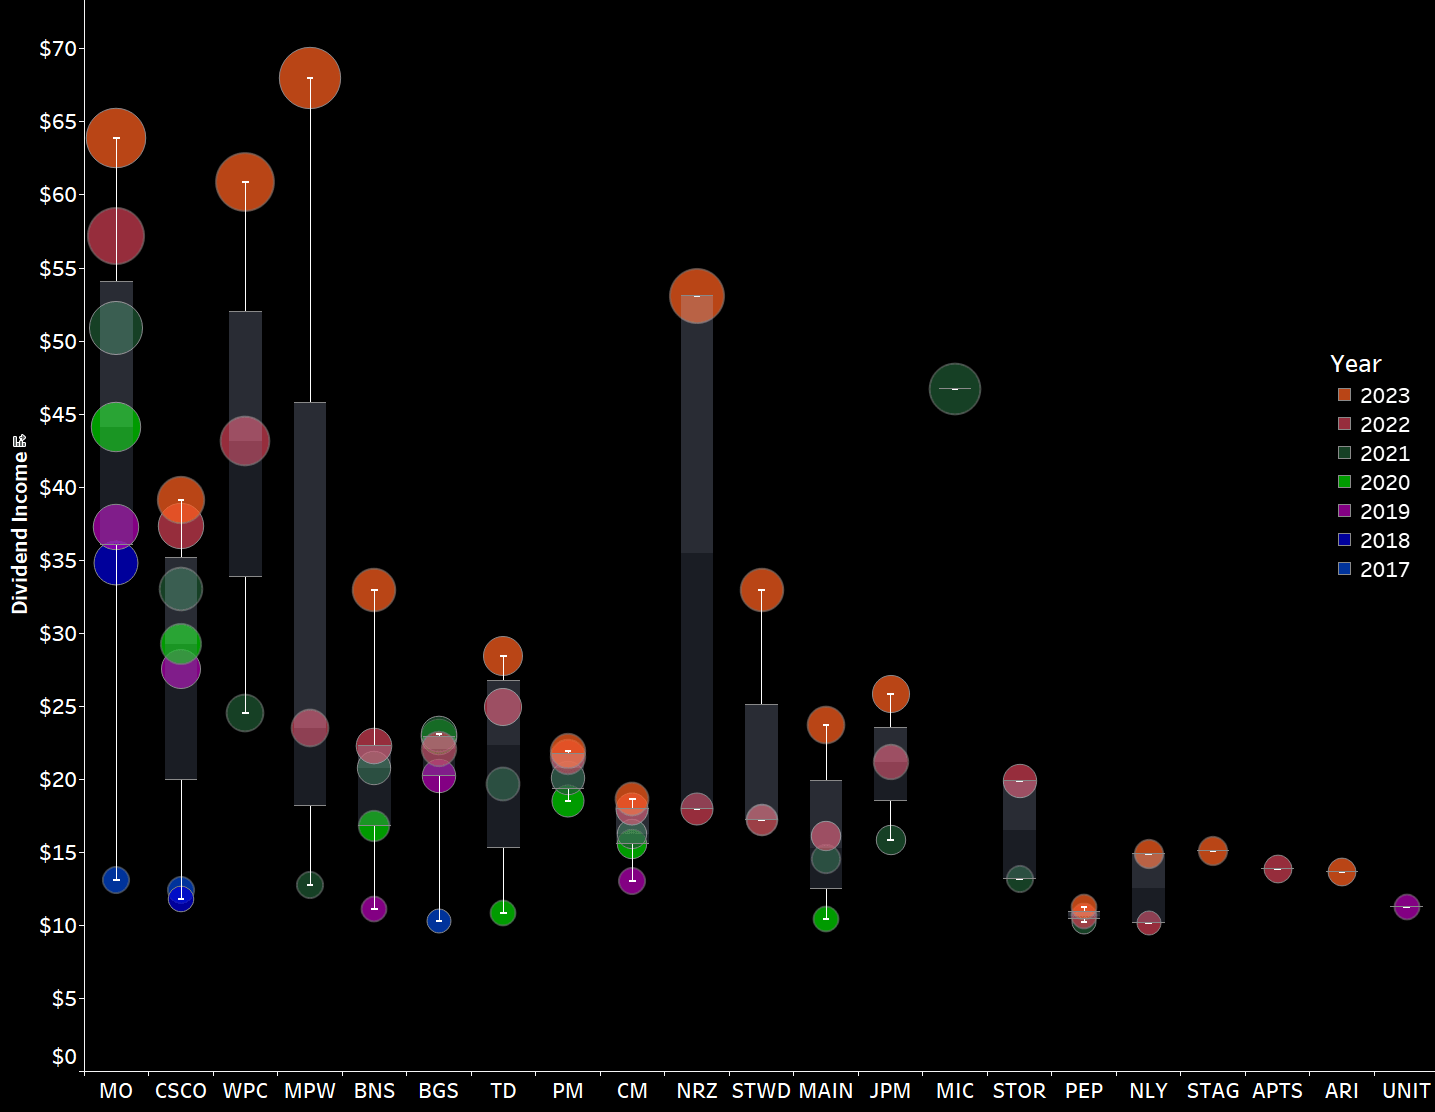
Next, I have plotted all of the individual dividend payments I have received, coloring them by year and arranging the years side by side instead of horizontally as in previous updates. This visualization allows for a more comprehensive analysis of the distribution of my dividend payments over time.
Dividend Payment Bubbles (Designed by author)
By plotting the data in this way, we can easily see the distribution of dividend payments across different years and gain insights into the overall growth of my dividend income over time.
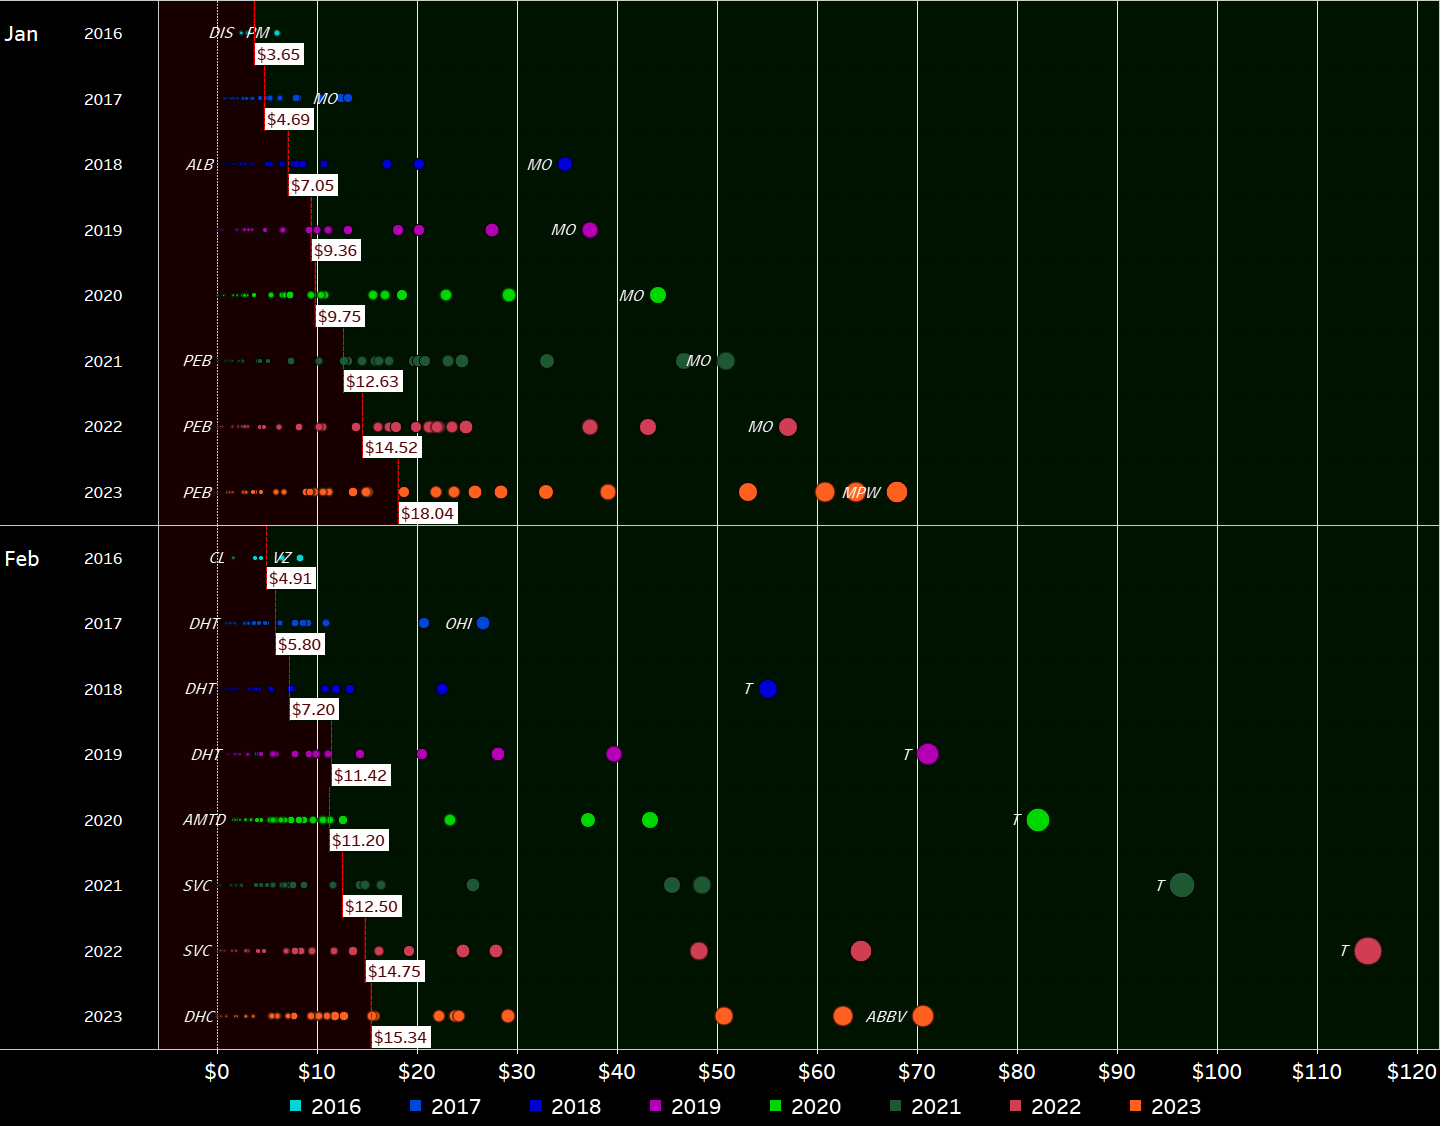
This visualization is initially quite cluttered, but it contains a wealth of information. It shows every individual dividend payment I have received since I began my investment journey in 2015, represented as a circle that is colored and sized according to its contribution. The view is organized by month and year, allowing for a more comprehensive analysis of the development of my dividend income over time. For each year and month, a white rectangle indicates the average monthly dividend. The area where dividends fall below the average is filled in dark red, while the area above the average is colored dark green. I greatly prefer this redesigned version of my old "bubbles chart" because it makes it much easier to identify trends and developments in my dividend income. This type of data visualization allows for a detailed examination of the distribution of my dividend payments over time and enables me to more easily identify trends and patterns in my income growth.
February 2023 Dividends (Designed by author)
Now, zooming in on February , we can immediately see a number of big green circles in a sea of black. The bigger the circle and the bigger the distance to the previous circle for the same stock, the bigger is the change in dividend income compared to the prior years.
Overall, I aim to see as many big neon orange circles at the top of the scale as possible, as this indicates rising dividend income. .
Another way to express the monthly dividend income is in terms of Gifted Working Time (GWT). Assuming an average hourly rate of $32.34 for 2022, my GWT and annual net dividends have been as follows:
- 2018: 121 hours GWT, $3,000 in annual net dividends
- 2019: 142 hours GWT, $3,600 in annual net dividends
- 2020: 152 hours GWT, $3,800 in annual net dividends
- 2021: 180 hours GWT, $5,050 in annual net dividends
- 2022: 229 hours GWT, $6,400 in annual net dividends
- 2023: Targeting at least 216 hours GWT, $7,000 in annual net dividends
I expect overall GWT to decrease in 2023 due to higher calculated hourly rates, as I project a 10% increase in the hourly rate due to inflation.
The overall target for the year with $7,000 in annual net dividends is very conservative but I expect that I will have to take out some risk from my portfolio as mentioned above. Also, the stronger Euro (I am receiving dividends in EUR and then converting those to USD at current exchange rates for these updates) will have adverse impact. Still, as the year unfolds I expect to be able to pass that target and potentially even reach my next milestone of $8,000 as well.
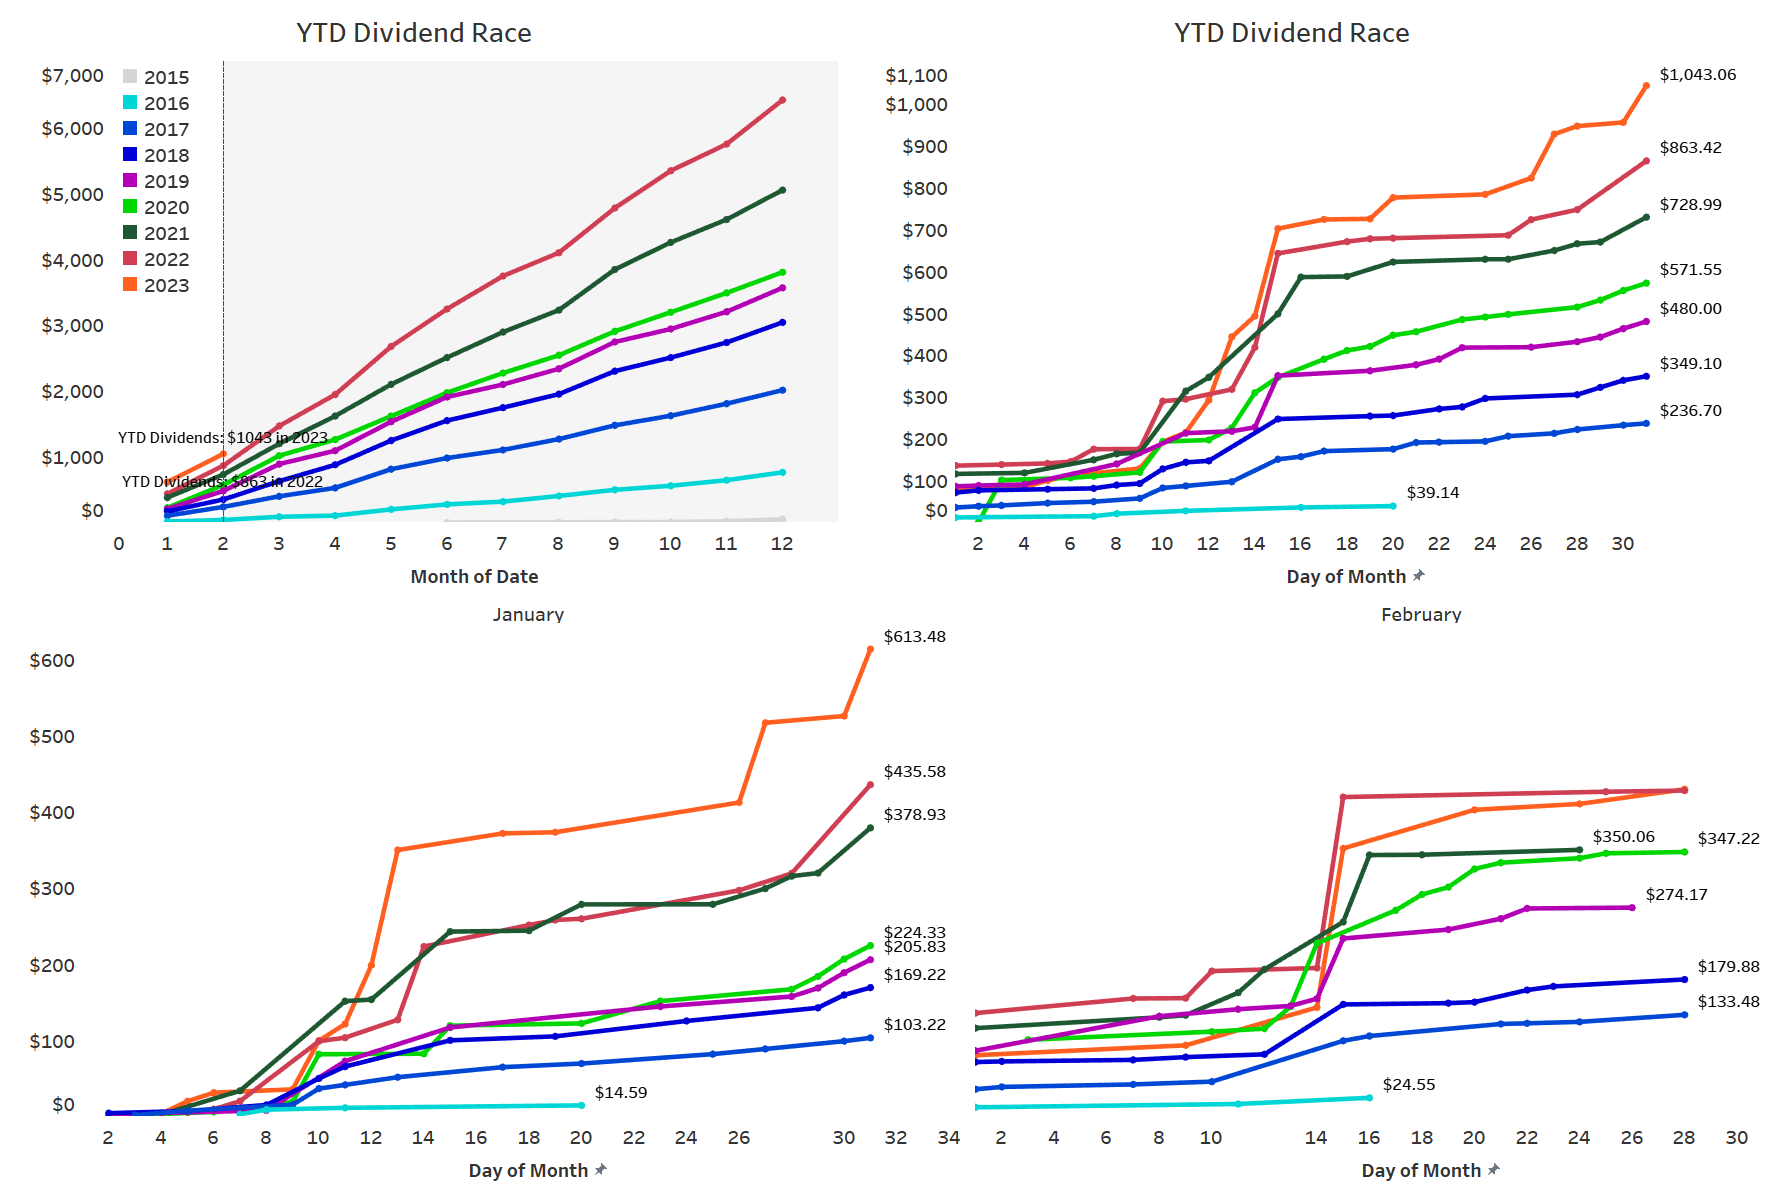
Across the years, my YTD Dividend Race has been as follows:
- 2018: Disappointing
- 2019: Phenomenal, benefiting from a low baseline in the prior year
- 2020: Fairly disappointing
- 2021: Phenomenal
- 2022: Much better than expected fueled by the very weak euro
- 2023: Targeting a conservative low single-digit growth rate
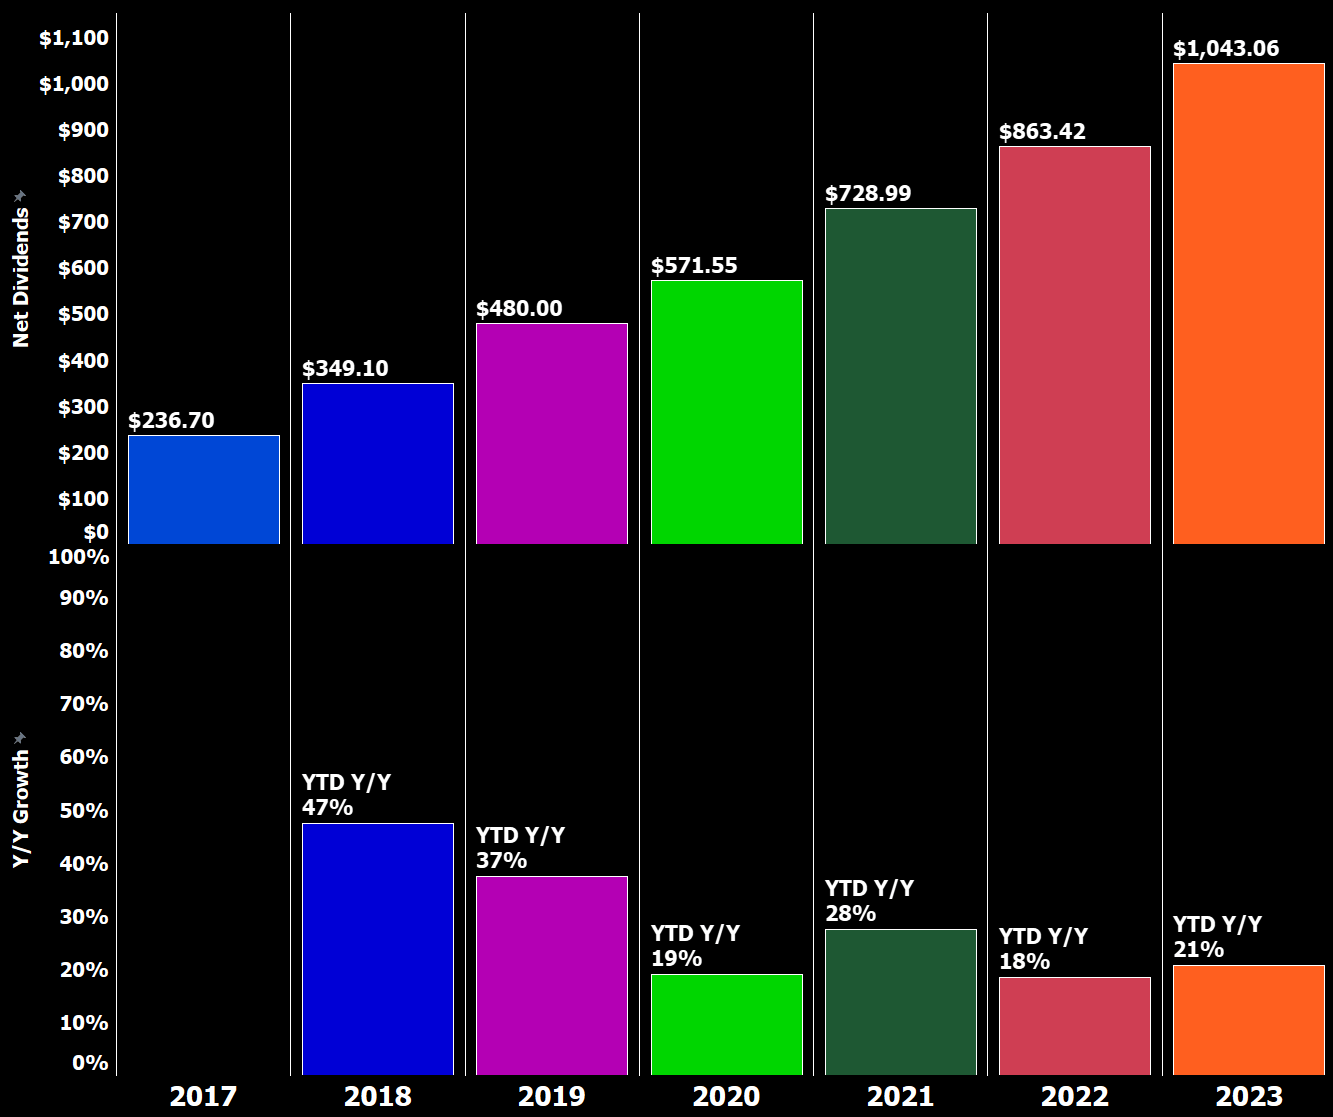
YTD Dividend Growth (Designed by author)
I have updated the YTD Dividend Race chart to show the development of YTD dividend income on a daily basis, allowing us to see that most of my dividend income is generated mid-month and towards the end of the month. The chart also breaks down the development by month for the current year, making it easy to identify significant jumps in income.
YTD Dividend Race (Designed by author)
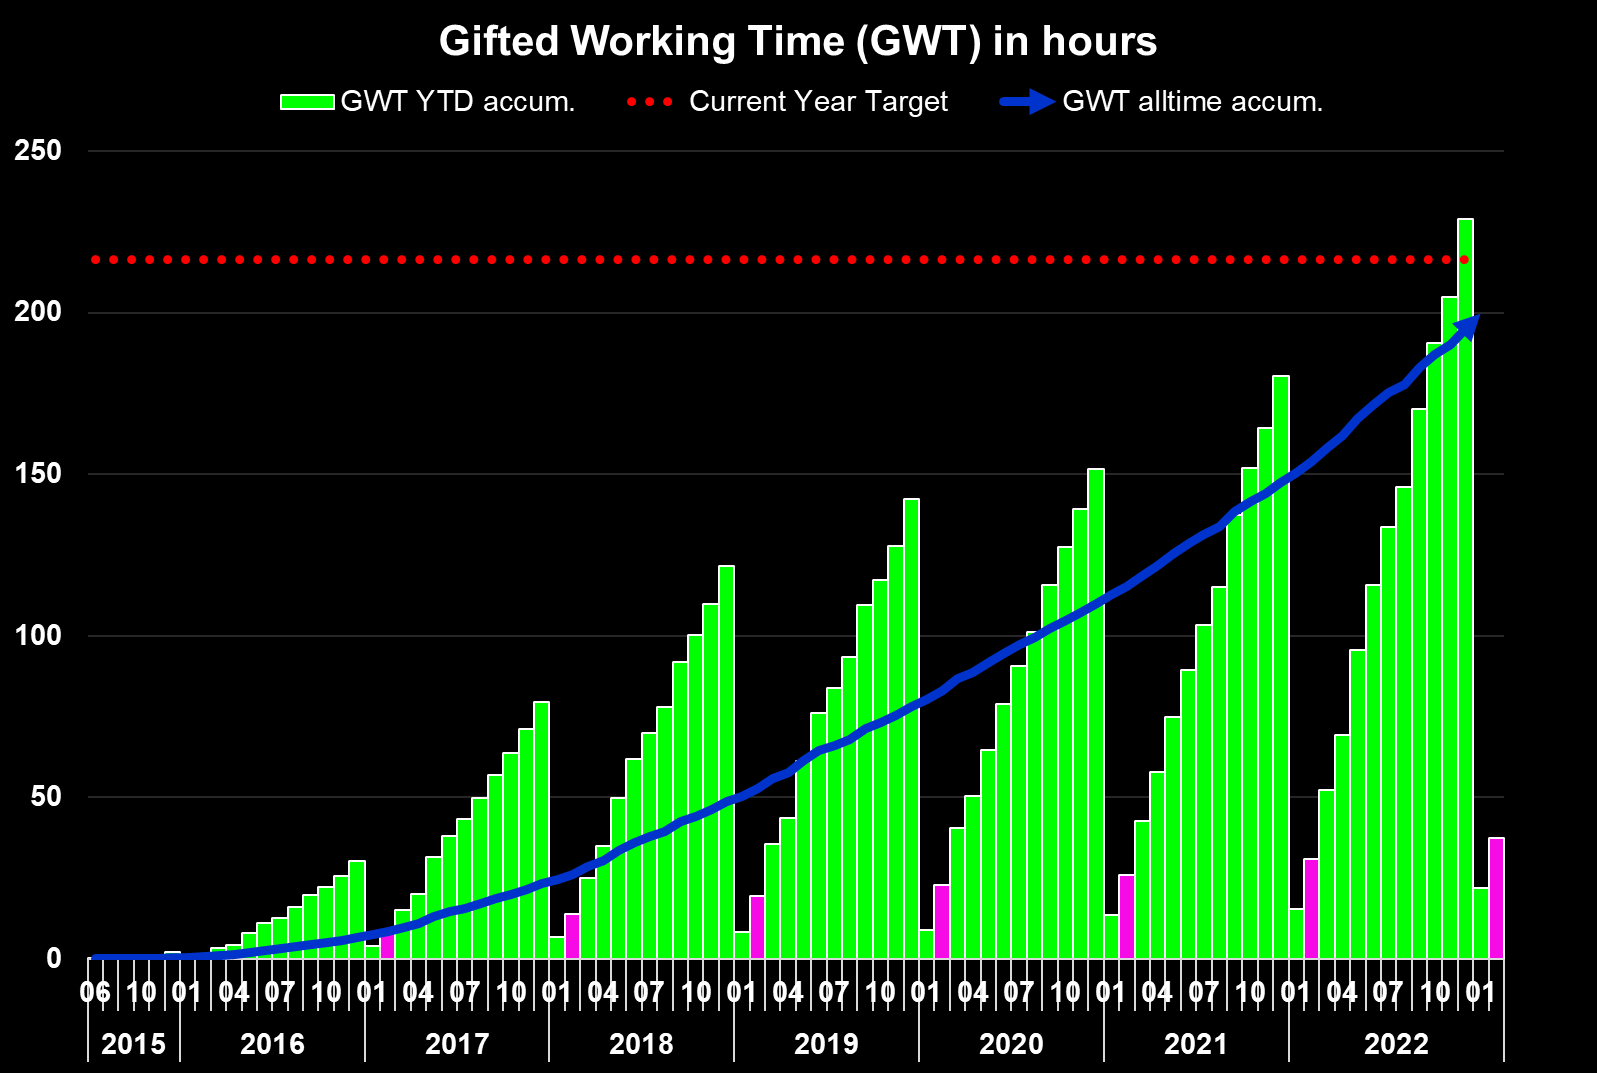
Expressed in GWT, it presents itself as follows:
Gifted Working Time in Hours (Designed by Author)
What this shows is as follows:
- All time (blue area) - Around 973 hours, or 122 days, of active work have been replaced with passive income since the start of my dividend journey. Assuming a five-day workweek, this translates into 24 weeks of vacation funded via dividends.
- Full-year 2023 (green bars) - Around 37.2 hours, or 4.7 days, of active work have been replaced with passive income in 2022 already, which is basically a full-time work week funded with dividends.
- Highlighted in pink is the accumulated YTD total at the end of the current reporting month ( February ).
This visualization allows us to see the overall impact of my dividend income on the amount of active work I am able to replace with passive income. It also enables us to see the progress made year-to-date, as well as the accumulated total at the end of the current reporting month.
Upcoming March Dividends
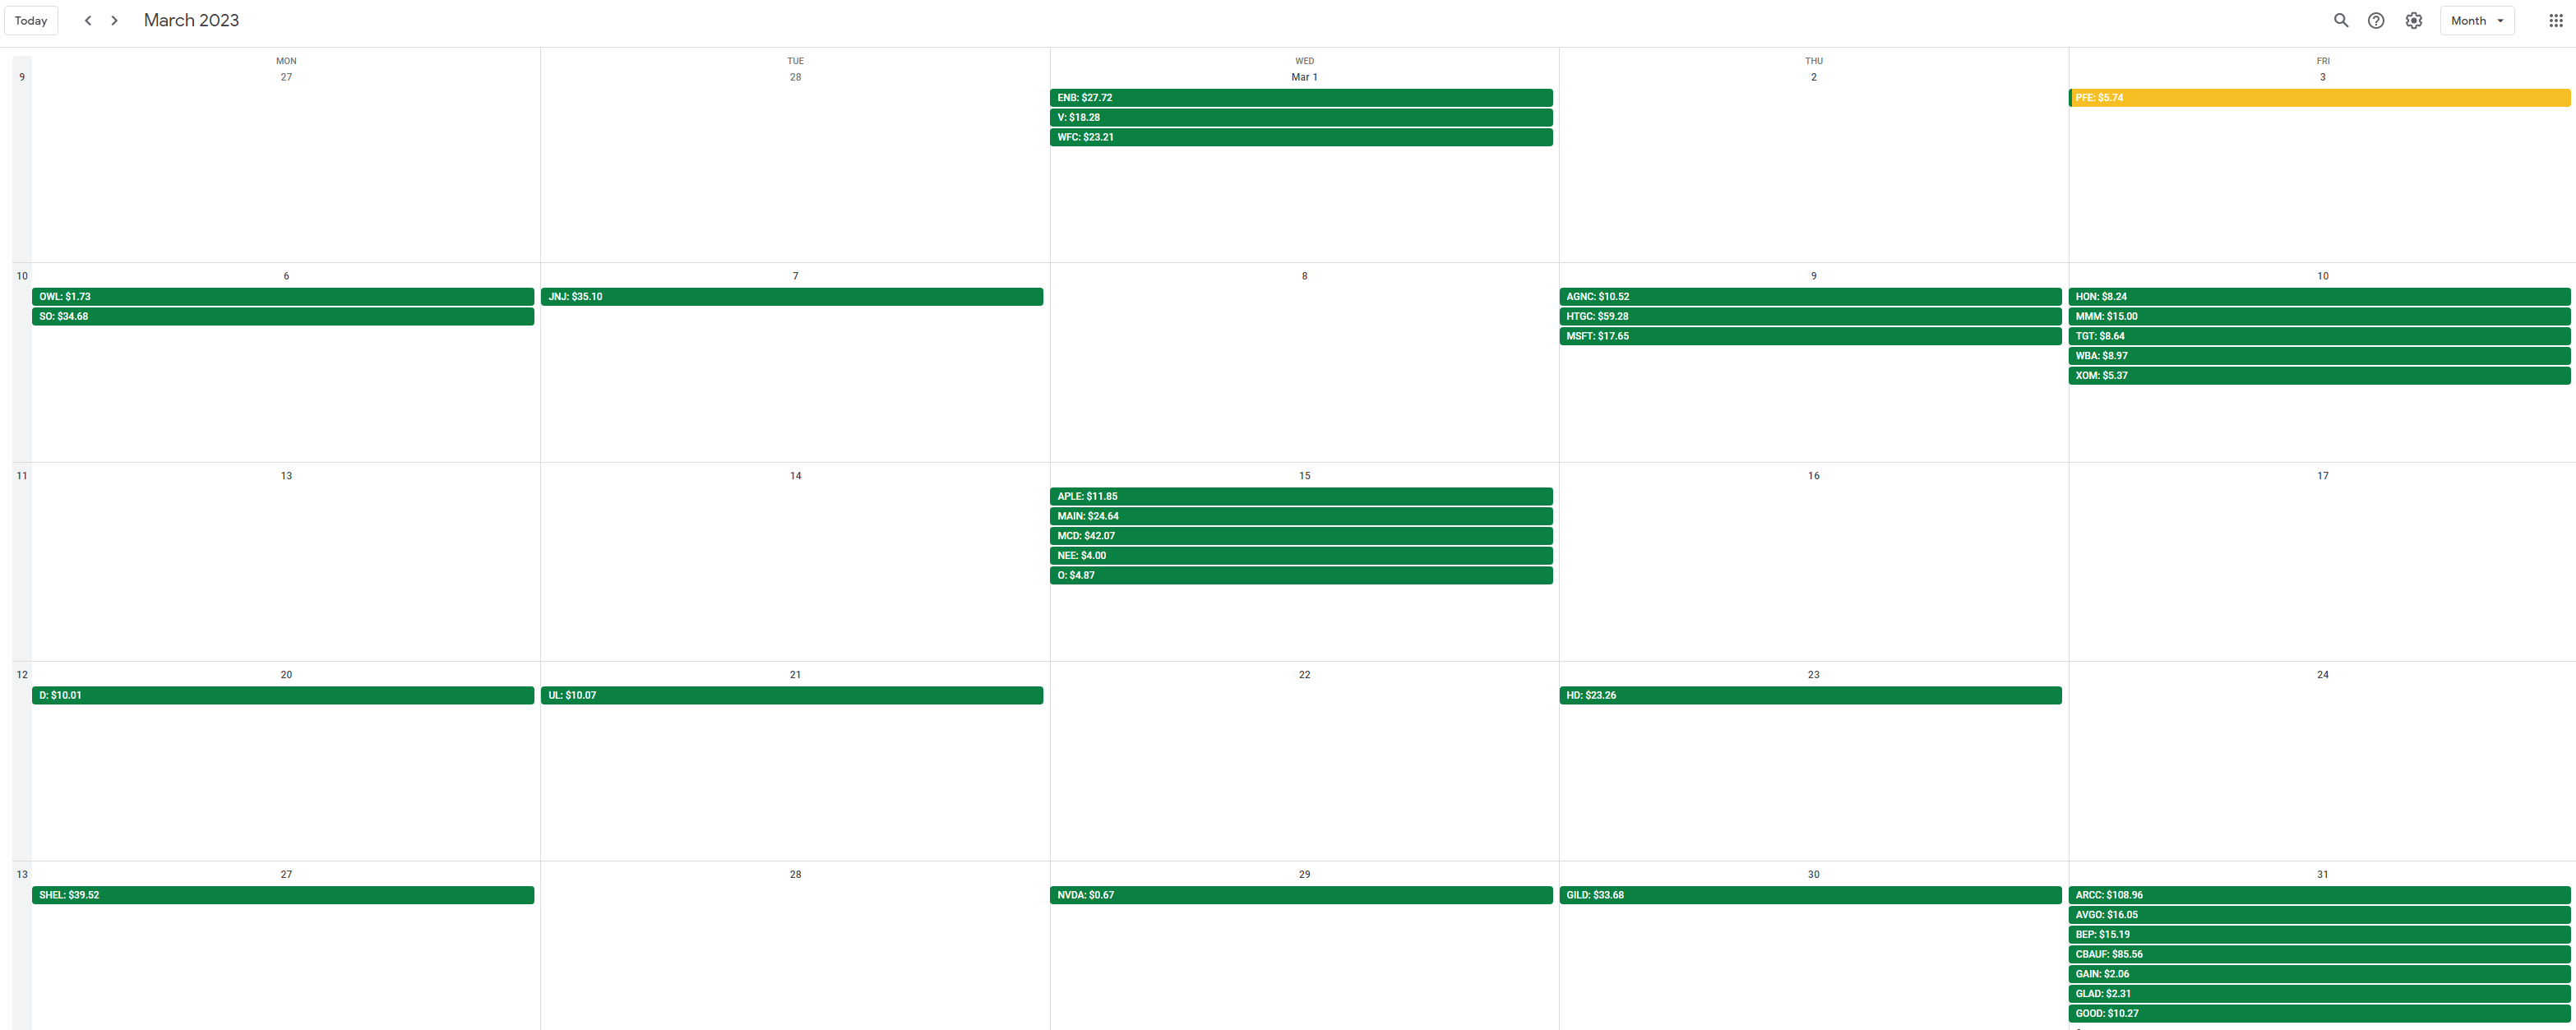
With March marking the end of the quarter, this will traditionally be a strong month in terms of dividend income. Among others, further big dividend payers from my portfolio in March are Royal Dutch Shell ( SHEL ), BP ( BP ), McDonald's (NYSE: MCD ), Johnson & Johnson (NYSE: JNJ ), Southern Company (NYSE: SO ) and Ares Capital Corporation ( ARCC ) of which 4 companies are part of my regular monthly savings plans. On top of that Hercules Capital will pay a very big dividend and the semi-annual dividend from Commonwealth Bank of Australia is also scheduled.
Many of those are part of my monthly savings plans and thus there should be some solid growth in dividend income despite the heavy dividend cuts from Shell, BP and Wells Fargo although all three of them have already reverted back to growing their dividend, especially Wells Fargo which simply doubled its dividend.
The snapshot below is taken from my free-for-all released Dividend Calendar (make sure to follow instructions in the video) and shows my expected dividend payments in March.
My Dividend Calendar (Designed by author)
At the end of February, my dividend portfolio is composed as follows:
| Company Name |
| Ticker |
| % Market Value |
| Market Value (€) |
| Apple Inc. |
| ( AAPL ) |
| 10.69% |
| 21,056 |
| Visa Inc |
| ( V ) |
| 4.33% |
| 8,535 |
| AbbVie Inc |
| ( ABBV ) |
| 4.08% |
| 8,026 |
| McDonald's Corp. |
| ( MCD ) |
| 3.75% |
| 7,377 |
| Microsoft Corporation |
| ( MSFT ) |
| 3.18% |
| 6,261 |
| Cisco Systems, Inc. |
| ( CSCO ) |
| 2.84% |
| 5,590 |
| W.P. Carey |
| ( WPC ) |
| 2.59% |
| 5,098 |
| Ares Capital Corporation |
| ( ARCC ) |
| 2.54% |
| 5,008 |
| AT&T Inc. |
| ( T ) |
| 2.37% |
| 4,671 |
| Main Street Capital Corporation |
| ( MAIN ) |
| 2.36% |
| 4,645 |
| Johnson & Johnson |
| ( JNJ ) |
| 2.28% |
| 4,492 |
| Shell |
| ( SHEL ) |
| 2.26% |
| 4,446 |
| Stag Industrial Inc |
| ( STAG ) |
| 2.22% |
| 4,375 |
| JPMorgan Chase & Co. |
| ( JPM ) |
| 2.05% |
| 4,044 |
| NVIDIA Corporation |
| ( NVDA ) |
| 1.90% |
| 3,737 |
| Texas Instruments Incorporated |
| ( TXN ) |
| 1.89% |
| 3,723 |
| Gilead Sciences, Inc. |
| ( GILD ) |
| 1.74% |
| 3,418 |
| Wells Fargo & Co |
| ( WFC ) |
| 1.73% |
| 3,404 |
| Altria Group Inc |
| ( MO ) |
| 1.73% |
| 3,403 |
| Home Depot |
| ( HD ) |
| 1.69% |
| 3,318 |
| Allianz SE |
| ( OTCPK:ALIZF ) |
| 1.66% |
| 3,266 |
| Toronto-Dominion Bank |
| ( TD ) |
| 1.64% |
| 3,221 |
| Southern Co |
| ( SO ) |
| 1.58% |
| 3,103 |
| Bank of Nova Scotia |
| ( BNS ) |
| 1.40% |
| 2,766 |
| Siemens Healthineers |
| ( OTCPK:SEMHF ) |
| 1.27% |
| 2,500 |
| Blackstone Group LP |
| ( BX ) |
| 1.22% |
| 2,410 |
| Broadcom Inc |
| ( AVGO ) |
| 1.17% |
| 2,301 |
| Commonwealth Bank of Australia |
| ( OTCPK:CBAUF ) |
| 1.12% |
| 2,212 |
| BMW |
| ( OTCPK:BMWYY ) |
| 1.12% |
| 2,206 |
| New Residential Corporation |
| ( RITM ) |
| 1.11% |
| 2,186 |
| Hercules Capital |
| ( HTGC ) |
| 1.11% |
| 2,181 |
| Enbridge |
| ( ENB ) |
| 1.11% |
| 2,176 |
| Morgan Stanley |
| ( MS ) |
| 1.08% |
| 2,123 |
| PepsiCo, Inc. |
| ( PEP ) |
| 0.96% |
| 1,897 |
| BP2 |
| ( BP ) |
| 0.92% |
| 1,821 |
| BP1 |
| ( BP ) |
| 0.88% |
| 1,739 |
| Procter & Gamble Co |
| ( PG ) |
| 0.87% |
| 1,711 |
| Intel Corporation |
| ( INTC ) |
| 0.86% |
| 1,688 |
| Philip Morris International Inc. |
| ( PM ) |
| 0.82% |
| 1,623 |
| Daimler |
| (DTRUY) |
| 0.76% |
| 1,500 |
| Honeywell International Inc. |
| ( HON ) |
| 0.75% |
| 1,478 |
| Bank of America Corp |
| ( BAC ) |
| 0.73% |
| 1,443 |
| Starwood Property Trust, Inc. |
| ( STWD ) |
| 0.70% |
| 1,384 |
| Realty Income Corp |
| ( O ) |
| 0.69% |
| 1,354 |
| Medical Properties Trust |
| ( MPW ) |
| 0.63% |
| 1,247 |
| Target Corporation |
| ( TGT ) |
| 0.63% |
| 1,247 |
| Apollo Investment |
| ( MFIC ) |
| 0.60% |
| 1,183 |
| Gladstone Commercial Corporation |
| ( GOOD ) |
| 0.58% |
| 1,144 |
| Brookfield Renewable Partners |
| ( BEP ) |
| 0.58% |
| 1,144 |
| The Coca-Cola Co |
| ( KO ) |
| 0.56% |
| 1,106 |
| NextEra Energy Partners LP |
| ( NEP ) |
| 0.56% |
| 1,102 |
| Stryker |
| ( SYK ) |
| 0.54% |
| 1,066 |
| 3M Co |
| ( MMM ) |
| 0.53% |
| 1,045 |
| Unilever NV ADR |
| ( UL ) |
| 0.52% |
| 1,030 |
| Apple Hospitality REIT |
| ( APLE ) |
| 0.48% |
| 952 |
| Royal Bank of Canada |
| ( RY ) |
| 0.48% |
| 944 |
| Annaly Capital Management |
| ( NLY ) |
| 0.48% |
| 935 |
| CVS Health Corp |
| ( CVS ) |
| 0.44% |
| 863 |
| Dominion Energy Inc |
| ( D ) |
| 0.40% |
| 788 |
| Verizon Communications Inc. |
| ( VZ ) |
| 0.39% |
| 775 |
| Sino AG |
| (XTP.F) |
| 0.39% |
| 764 |
| Spirit Realty Corporation |
| ( SRC ) |
| 0.38% |
| 743 |
| B&G Foods, Inc. |
| ( BGS ) |
| 0.36% |
| 716 |
| Gladstone Capital |
| ( GLAD ) |
| 0.36% |
| 715 |
| Canadian Imperial Bank of Commerce |
| ( CM ) |
| 0.35% |
| 697 |
| BASF |
| ( OTCQX:BASFY ) |
| 0.35% |
| 688 |
| Gladstone Investment |
| ( GAIN ) |
| 0.35% |
| 686 |
| AGNC Investment Corporation |
| ( AGNC ) |
| 0.34% |
| 677 |
| Medtronic |
| ( MDT ) |
| 0.34% |
| 675 |
| Walgreens Boots Alliance Inc |
| ( WBA ) |
| 0.32% |
| 633 |
| Exxon Mobil Corporation |
| ( XOM ) |
| 0.32% |
| 625 |
| NextEra Energy |
| ( NEE ) |
| 0.30% |
| 593 |
| General Electric Company |
| ( GE ) |
| 0.29% |
| 568 |
| Antero Midstream Corporation |
| ( AM ) |
| 0.28% |
| 558 |
| Pfizer Inc. |
| ( PFE ) |
| 0.27% |
| 541 |
| Kinder Morgan Inc |
| ( KMI ) |
| 0.25% |
| 497 |
| Apollo Commercial Real Est. Finance Inc |
| ( ARI ) |
| 0.25% |
| 490 |
| ZIM Integrated Shipping Services |
| ( ZIM ) |
| 0.25% |
| 484 |
| Sixt |
| ( OTC:SXTSY ) |
| 0.23% |
| 456 |
| Alibaba Group Holding Ltd |
| ( BABA ) |
| 0.21% |
| 421 |
| Mastercard |
| ( MA ) |
| 0.18% |
| 359 |
| Colgate-Palmolive Company |
| ( CL ) |
| 0.18% |
| 347 |
| Bayer AG |
| ( OTCPK:BAYZF ) |
| 0.18% |
| 347 |
| BRT Realty Trust |
| ( BRT ) |
| 0.17% |
| 344 |
| Omega Healthcare Investors Inc |
| ( OHI ) |
| 0.15% |
| 305 |
| Vonovia |
| ( OTCPK:VONOY ) |
| 0.13% |
| 264 |
| Blue Owl Capital |
| ( OWL ) |
| 0.09% |
| 177 |
| Boeing |
| ( BA ) |
| 0.08% |
| 149 |
| Fresenius SE |
| ( OTCPK:FSNUF ) |
| 0.07% |
| 145 |
| Uniti Group Inc |
| ( UNIT ) |
| 0.05% |
| 95 |
| Walt Disney Co |
| ( DIS ) |
| 0.05% |
| 95 |
| Bank of Montreal |
| ( BMO ) |
| 0.05% |
| 90 |
| Equitrans Midstream Corporation |
| ( ETRN ) |
| 0.04% |
| 82 |
| Newtek Business Services |
| ( NEWT ) |
| 0.04% |
| 74 |
| Fresenius Medical Care |
| ( FMS ) |
| 0.04% |
| 73 |
| Diversified Healthcare Trust |
| ( DHC ) |
| 0.03% |
| 67 |
| The GEO Group Inc |
| ( GEO ) |
| 0.03% |
| 60 |
| Owl Rock Capital Corporation |
| ( ORCC ) |
| 0.03% |
| 58 |
| Service Properties Trust |
| ( SVC ) |
| 0.03% |
| 53 |
For further details see:
My Dividend Stock Portfolio: New February Record - 99 Holdings With 32 Buys And 4 Sales