CA - My Top 10 Dividend Growth Stocks To Invest In For June 2023
2023-05-30 18:00:00 ET
Summary
- I will introduce you to 10 dividend growth companies that I believe could be excellent choices for dividend growth investors right now.
- The 10 selected picks have shown an Average Dividend Growth Rate [CAGR] of 15.48% over the past 5 years.
- Furthermore, the companies provide investors with an Average Dividend Yield [FWD] of 2.17%.
Investment Thesis
Dividend growth companies are attractive due to being able to raise their dividend to a significant amount year over year. This is particularly attractive for investors that plan to invest with a long-term horizon.
In today’s article, I will present you with 10 dividend growth companies that I believe are attractive for investors for different reasons: all of these picks have a Valuation which I consider to be at least fair, they have shown strong Dividend Growth over the past years (on Average, their Dividend Growth Rate [CAGR] over the past 5 years stands at 15.48%), and I believe they are attractive when it comes to Profitability and Growth.
All of these factors make me believe that these companies can be excellent choices when investing over the long term in order to continuously benefit from their increasing dividend payments.
First, I would like to explain the selection process for my top dividend growth stocks of the month of June. Since I have already explained this selection process in a previous article , you can skip the following description written in italics, if you are already familiar with the selection process.
First step of the Selection Process: Analysis of the Financial Ratios
In a first step, companies must meet the following requirements to be part of a pre-selection among which I will select the top dividend growth stocks of the month:
- Market Capitalization > $10B [changed from $15B]
- Payout Ratio < 60%
- Average Dividend Growth Rate over the past 5 Years > 5%
- Dividend Yield [FWD] > 0%
- P/E [FWD] Ratio < 50
- EBIT Margin [TTM] > 5% or Net Income Margin [TTM] > 5%
- Return on Equity > 5% [changed from 8%]
I consider these metrics mentioned above important in order to help you to make well founded investment decisions and to increase the probability of making good investment decisions.
A relatively low Payout Ratio ensures that the company still has sufficient room for future dividend enhancements. This is particularly important for dividend growth investors that aim to invest with a long investment horizon. At the same time, a relatively low Payout Ratio contributes to the fact that the probability of a future dividend cut is lower. A dividend cut could make the stock price decline significantly in a short period of time.
A relatively high Dividend Growth Rate of more than 5% over the past 5 years ensures to increase the probability that the company will be able to raise its Dividend to a significant amount in the following years.
A P/E [FWD] Ratio of less than 50 contributes to the fact that the growth expectations that are priced into the stock price of the company you aim to invest in are not extraordinarily high. This helps you that you run less risk of the share price decreasing significantly in s short-period of time in case that growth expectations for the company are not met. This can contribute to help you to protect you from losing a significant amount of money in a short period of time.
An EBIT Margin or Net Income Margin of more than 5% and a Return of Equity of more than 5% [changed from 8%] help to filter out companies that are profitable.
Second step of the selection process: Analysis of the Competitive Advantages
In a second step, the companies’ competitive advantages (for example: brand image, innovation, technology, economies of scale, etc.) are analyzed in order to make an even narrower selection. I consider it to be particularly important for companies to have strong competitive advantages in order to stand against the competition in the long term. Companies without strong competitive advantages have a higher probability to go bankrupt one day, representing a strong risk for investors to lose their invested money.
Third step of the selection process: The Valuation of the companies
In the third step of the selection process, I will dive deeper into the Valuation of the companies.
In order to conduct the Valuation process of the companies, I use different methods and criteria, for example, the companies’ current Valuation as according to my DCF Model, the expected compound annual rate of return as according to my DCF Model and/or a deeper analysis of the companies’ P/E [FWD] Ratio. These metrics should serve as an additional filter to select only companies that currently have an attractive Valuation, helping you to identify companies that are at least fairly valued.
The Fourth and final step of the selection process: Diversification over Industries and Countries
In a fourth and last step of the selection process, I have established the following rules for my top picks of the months selection: in order to help you to diversify your investment portfolio, a maximum of 2 companies should be from the same industry. In addition to that, there should be at least one pick that is from a company that is based outside of the United States, serving as an additional geographical diversification.
New Companies when compared to the list of the previous month
- BlackRock (NYSE: BLK )
- Canadian Natural Resources Limited (NYSE: CNQ )
- Goldman Sachs (NYSE: GS )
- Nasdaq (NASDAQ: NDAQ )
- Union Pacific Corporation (NYSE: UNP )
My Top 10 Dividend Growth Companies to invest in for June 2023
Below you can find the 10 dividend growth companies that I have selected. I consider each of them to be particularly attractive to invest in at this moment in time:
- Apple (NASDAQ: AAPL )
- BlackRock
- Canadian Natural Resources Limited
- Goldman Sachs
- JPMorgan (NYSE: JPM )
- Mastercard (NYSE: MA )
- Microsoft (NASDAQ: MSFT )
- Nasdaq
- The Charles Schwab Corporation (NYSE: SCHW )
- Union Pacific Corporation
Overview of the selected Dividend Growth Stocks to invest in June 2023
| Company Name |
| Sector |
| Industry |
| Country |
| Dividend Yield [TTM] |
| Dividend Yield [FWD] |
| Dividend Growth 5Y |
| P/E [FWD] Ratio |
| Return on Equity |
| Apple |
| Information Technology |
| Technology Hardware, Storage and Peripherals |
| United States |
| 0.54% |
| 0.56% |
| 7.26% |
| 29.22 |
| 145.61% |
| BlackRock |
| Financials |
| Asset Management and Custody Banks |
| United States |
| 2.97% |
| 3.02% |
| 13.60% |
| 18.88 |
| 12.32% |
| Canadian Natural Resources Limited |
| Energy |
| Oil and Gas Exploration and Production |
| Canada |
| 4.12% |
| 4.48% |
| 21.83% |
| 10.475 |
| 27.06% |
| JPMorgan Chase & Co. |
| Financials |
| Diversified Banks |
| United States |
| 2.93% |
| 2.93% |
| 12.91% |
| 9.49 |
| 14.27% |
| Mastercard |
| Financials |
| Transaction & Payment Processing Services |
| United States |
| 0.57% |
| 0.61% |
| 17.66% |
| 30.44 |
| 154.10% |
| Microsoft |
| Information Technology |
| Systems Software |
| United States |
| 0.84% |
| 0.86% |
| 10.02% |
| 32.81 |
| 38.60% |
| Nasdaq |
| Financials |
| Financial Exchanges and Data |
| United States |
| 1.47% |
| 1.62% |
| 9.57% |
| 20.01 |
| 18.70% |
| The Charles Schwab Corporation |
| Financials |
| Investment Banking and Brokerage |
| United States |
| 1.78% |
| 1.89% |
| 21.16% |
| 15.89 |
| 17.49% |
| The Goldman Sachs Group |
| Financials |
| Investment Banking and Brokerage |
| United States |
| 2.94% |
| 3.09% |
| 25.93% |
| 9.95 |
| 9.01% |
| Union Pacific Corporation |
| Industrials |
| Rail Transportation |
| United States |
| 2.65% |
| 2.65% |
| 14.83% |
| 17.38 |
| 57.48% |
| 2.08% |
| 2.17% |
| 15.48% |
| 19.45 |
| 49.46% |
Source: The Author
Apple
At Apple’s stock price of $171.25, the company has a Dividend Yield [TTM] of 0.54% and a Dividend Yield [FWD] of 0.56%.
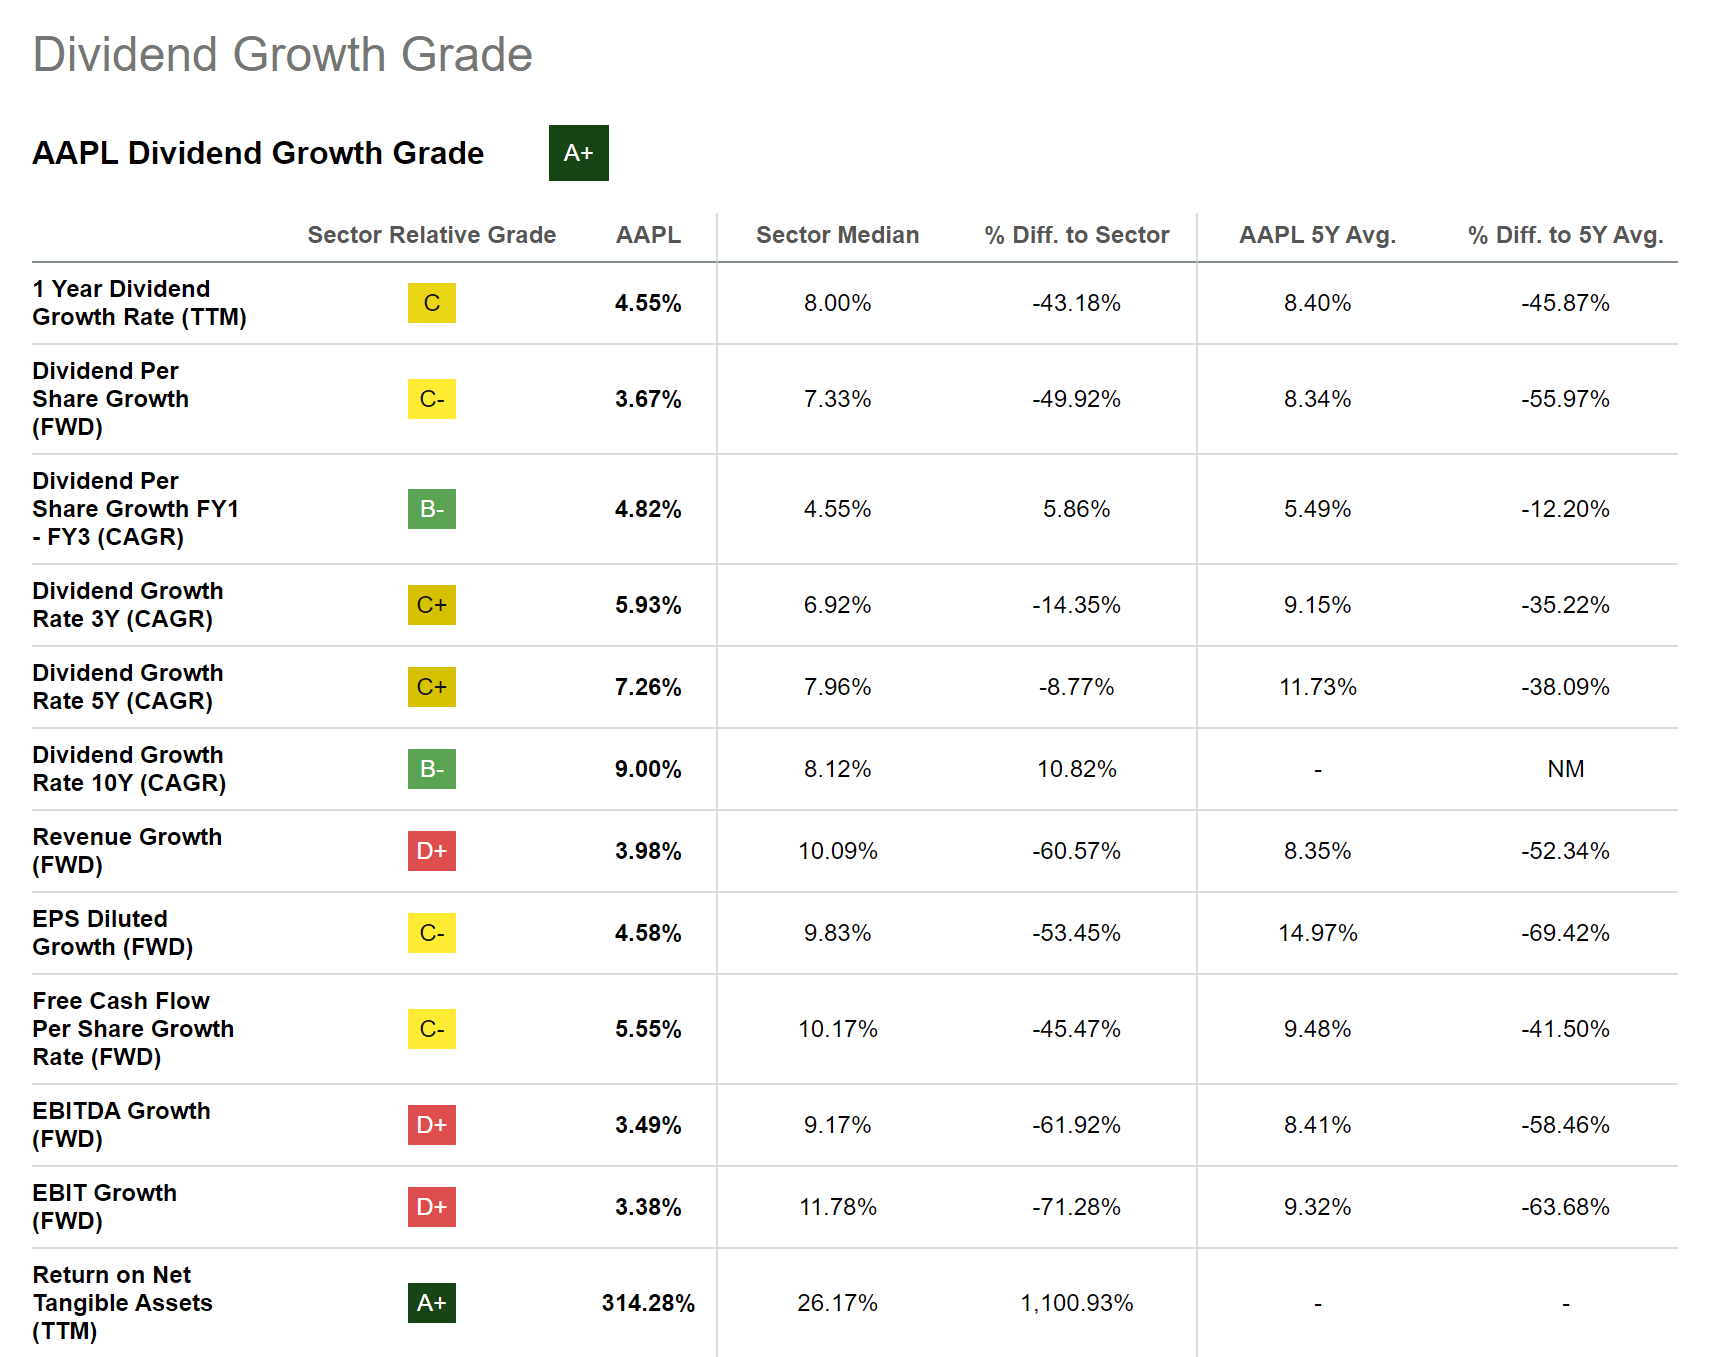
Apple has shown a Dividend Growth Rate [CAGR] of 9.00% over the past 10 years and 7.26% over the past 5 years. The company’s metrics in terms of Dividend Growth give me belief that it's an attractive fit for dividend growth investors, even though its recent Dividend Growth Rates have been slightly lower than in the years before.
Apple’s Average EBIT Growth Rate [FWD] over the past 5 years stands at 9.32% and its Average Free Cash Flow Per Share Growth Rate [FWD] over the past 5 years is at 9.48%. These figures suggest that the company is well positioned to deliver substantial dividend growth to shareholders in the near future. Below you can find the Seeking Alpha Dividend Growth Grades for Apple, which underlines this theory.
Source: Seeking Alpha
In addition to that, it can be highlighted that Apple provides investors with an attractive Free Cash Flow Yield [TTM] of 3.53% from which they can benefit over the long term. This is because shareholders won’t only benefit from Apple’s increasing dividend payments, but also from its share buyback program.
Furthermore, I consider Apple to currently have a fair Valuation. My opinion is based on the fact that its current P/E [FWD] Ratio of 29.23 lies only slightly above the Sector Median of 24.09. Due to Apple’s strong competitive advantages, such as its strong brand image, its high customer loyalty and its own ecosystem, I strongly believe that the company should be rated with a premium as compared to its peer group.
BlackRock
BlackRock currently has a Dividend Yield [TTM] of 2.97% and a Dividend Yield [FWD] of 3.02%. But it’s not only the company’s dividend income that is attractive; I consider BlackRock to also be an excellent choice when it comes to dividend growth.
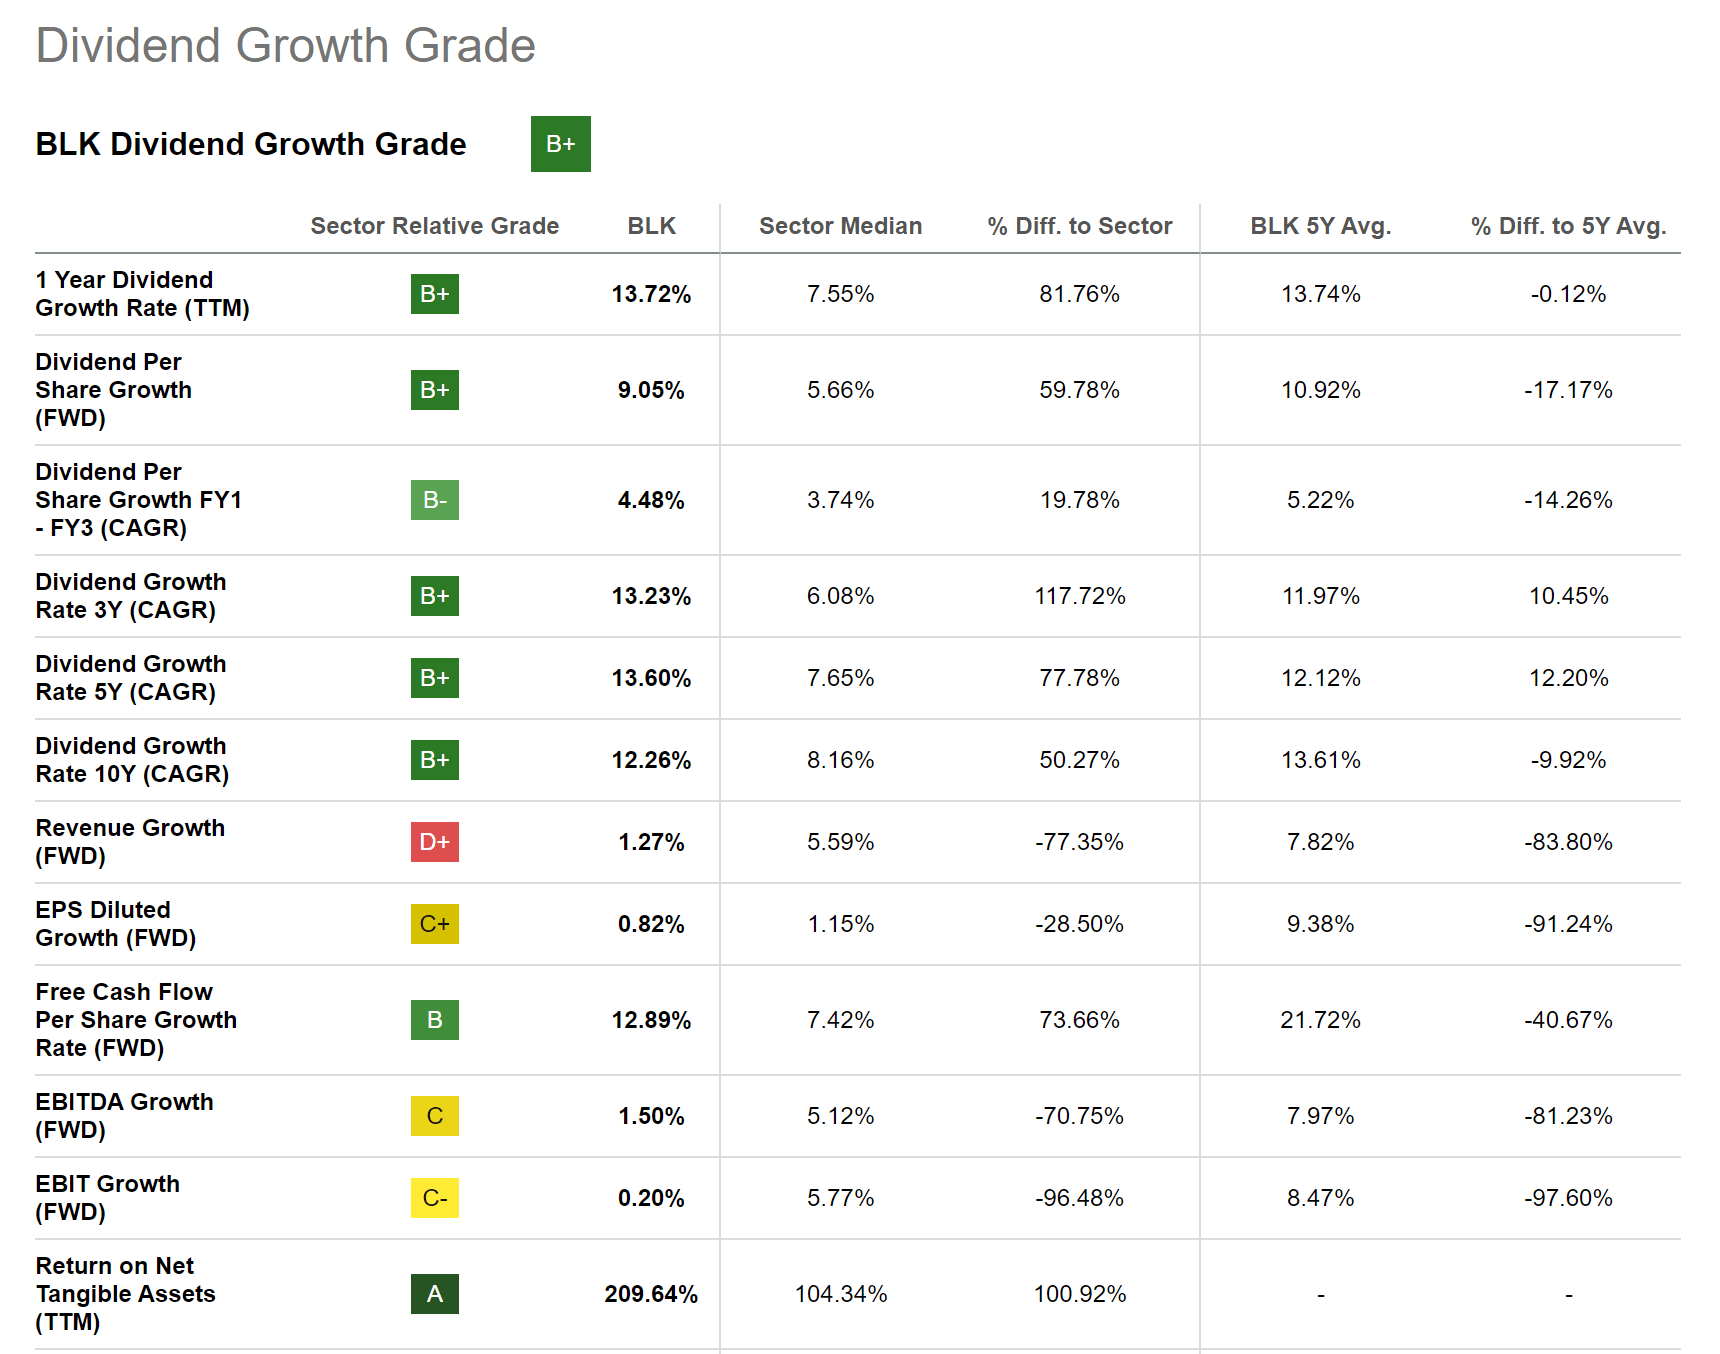
BlackRock has demonstrated a Dividend Growth Rate [CAGR] of 12.26% over the past 10 years and of 13.60% over the past 5 years. In addition to that, the company has exhibited a Free Cash Flow Per Share Growth Rate [FWD] of 12.89%, which gives me confidence that the company is a perfect fit for those investors that would like to combine dividend income with dividend growth.
Below you can find the Seeking Alpha Dividend Growth Grade for BlackRock, which once again demonstrates the company’s excellent dividend growth perspective.
Source: Seeking Alpha
At this moment of writing, I believe that BlackRock is fairly valued: this is due to the fact that its P/E [FWD] Ratio of 19.06 lies 0.60% below its Average over the past 5 years.
Canadian Natural Resources
Canadian Natural Resources sells crude oil, natural gas, and natural gas liquids. The company was founded in 1973 and has 10,035 employees.
I believe that Canadian Natural Resources is currently fairly valued. This is due to the fact that its P/E Non-GAAP [FWD] Ratio lies at 10.04, which is 1.15% below its Average from over the past 5 years. Furthermore, the company’s Price / Sales [FWD] Ratio of 2.39 lies 0.43% below its Average over the past 5 years, which can be interpreted as an additional indicator that it is currently fairly valued.
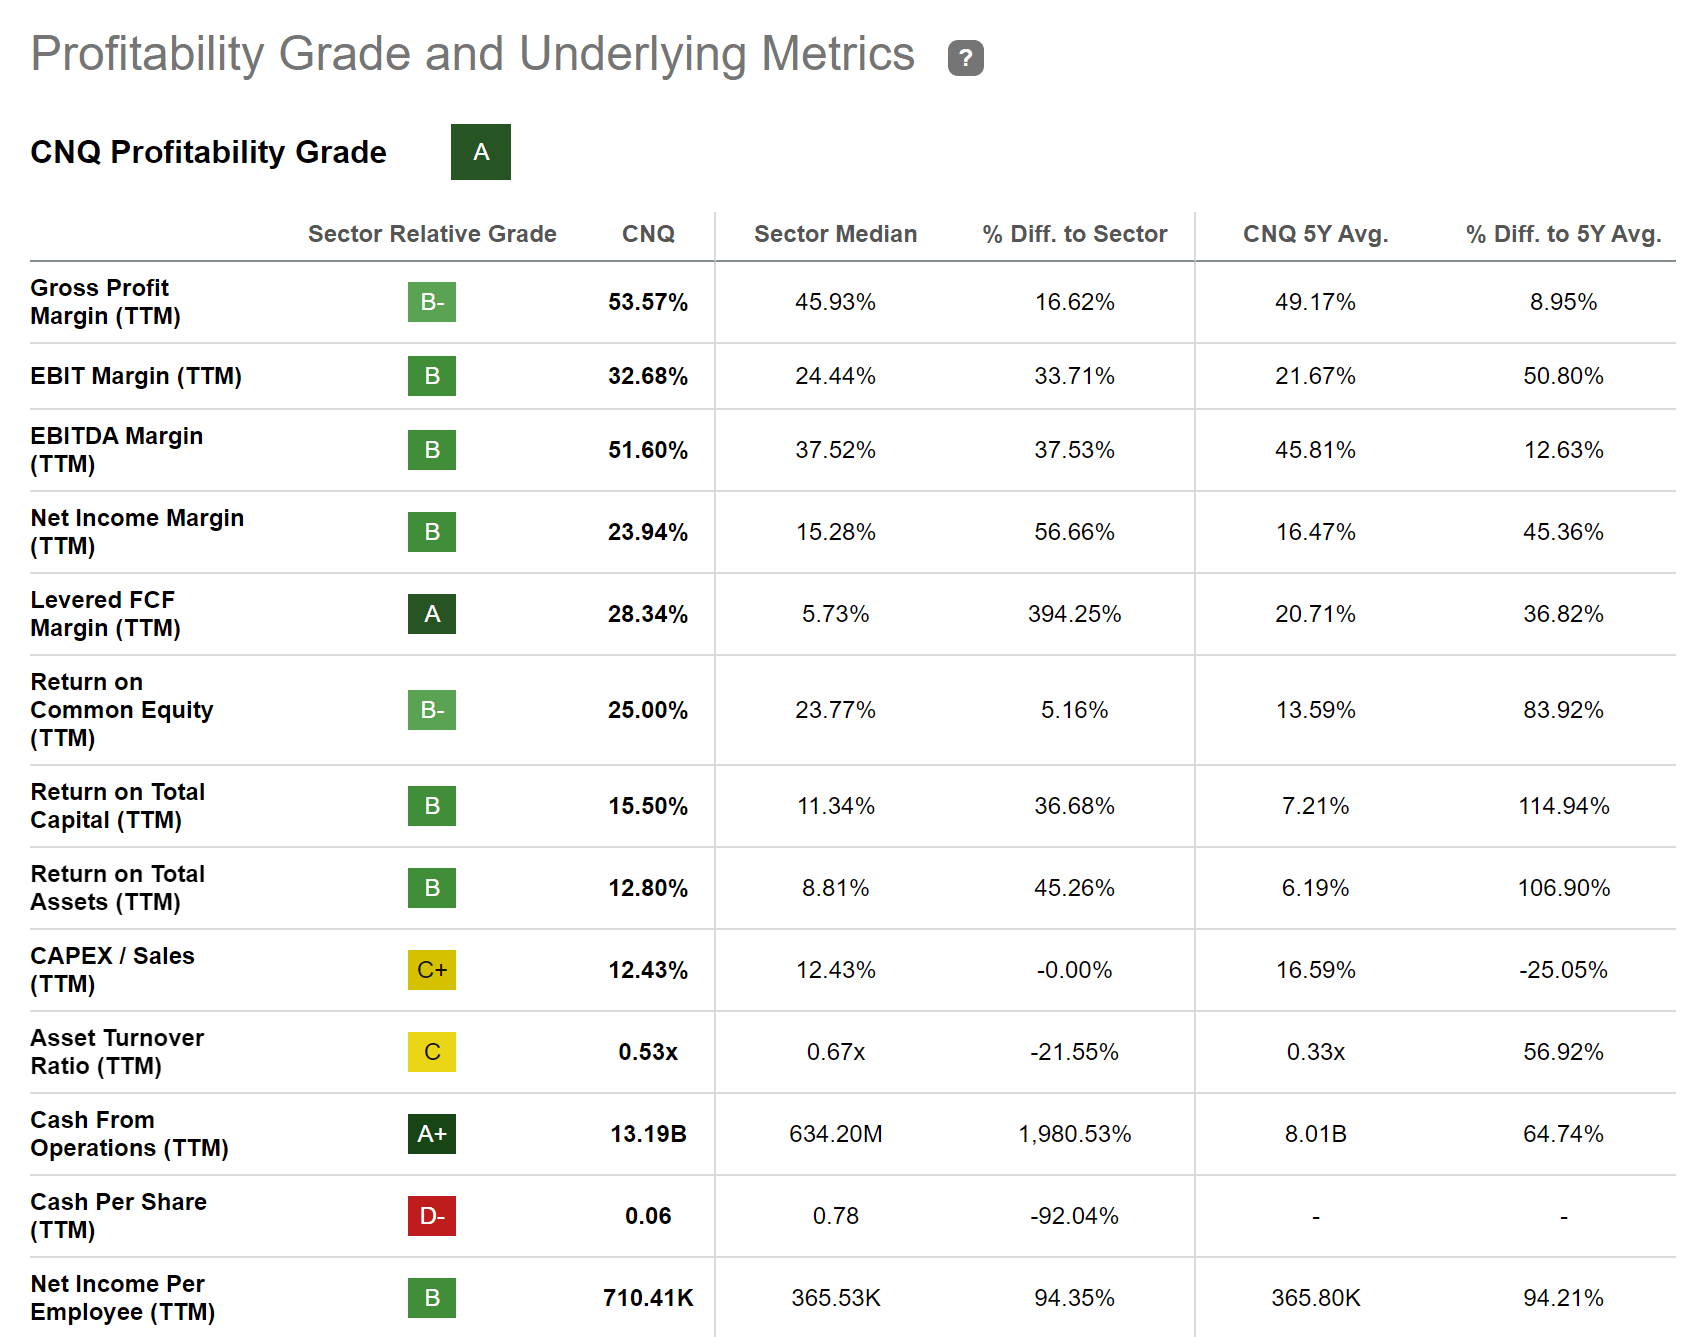
The company also seems to be a good choice in terms of Profitability: its EBIT Margin [TTM] lies at 32.68%, which stands 33.71% above the Sector Median of 24.44%. Its high Profitability is also reflected in the company's Return on Common Equity of 25.00% (lying 5.16% above the Sector Median).
Below you can find the Seeking Alpha Profitability Grade, which further supports my theory that the company offers excellent Profitability Metrics.
Source: Seeking Alpha
Goldman Sachs
Goldman Sachs was founded in 1869 and currently boasts a Market Capitalization of $104.79B.
I believe that the bank is currently at least fairly valued. The reason being is that its Price / Book [FWD] Ratio of 1.00 stands 6.39% below its Average over the past 5 years (1.07).
Moreover, it is worth emphasizing that the bank’s current P/E [FWD] Ratio of 10.11 stands only 6.07% above the Average from the past 5 years (9.53), underlying my thesis that the U.S. bank is currently at least fairly valued.
At the bank’s current stock price of $320.91, Goldman Sachs pays a Dividend Yield [FWD] of 3.09%. It is also worth emphazising that its Payout Ratio stands at a relatively low level (33.82%). For this reason, I consider the dividend to be relatively safe.
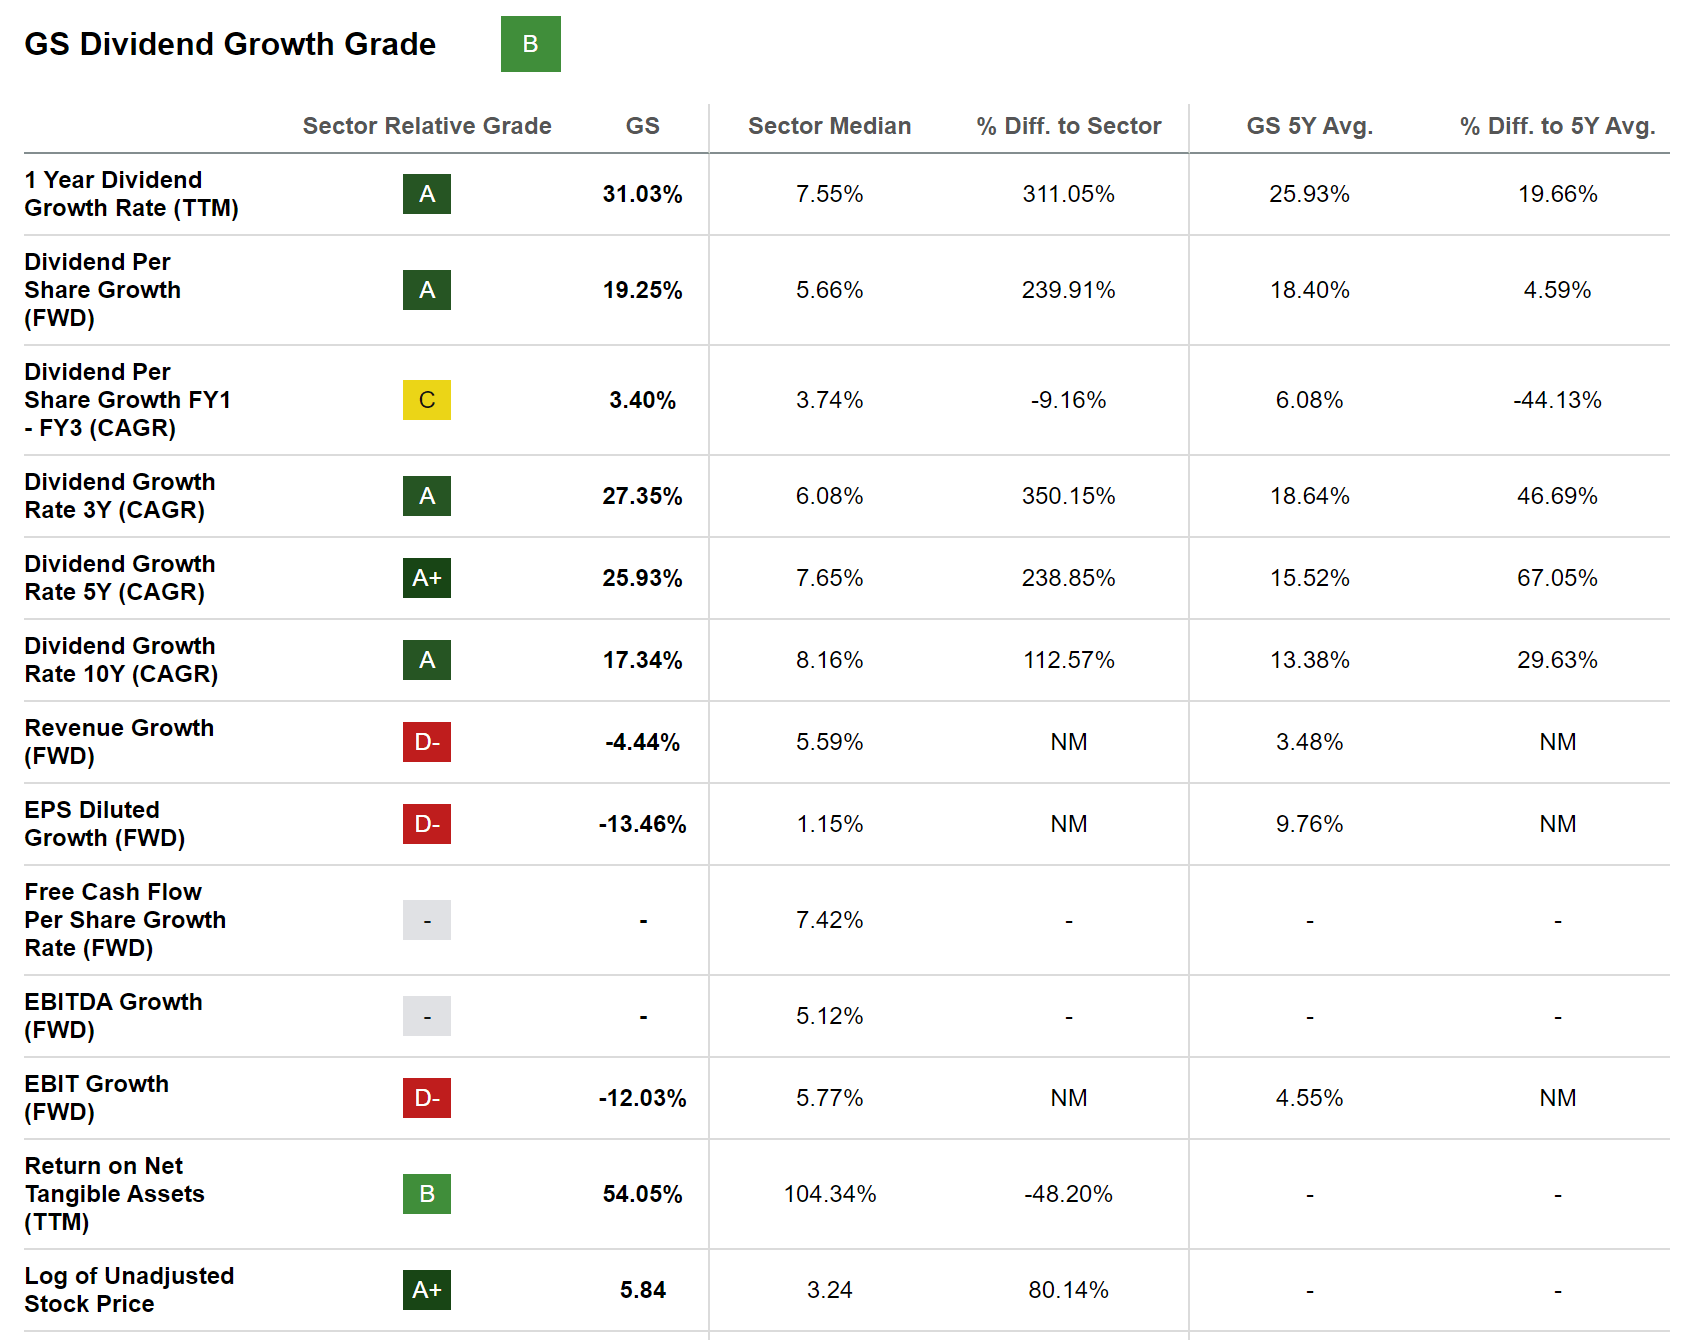
What makes the U.S. bank even more attractive for dividend income investors is not only its Dividend Yield [FWD] of 3.09%, but also the Dividend Growth Rate [CAGR] of 17.34% that it has shown over the past 10 years.
Below you can find the Seeking Alpha Dividend Growth Grade for Goldman Sachs, which confirms that the U.S. bank is an excellent fit when it comes to Dividend Growth.
Source: Seeking Alpha
JPMorgan
At the time of writing, I believe that JPMorgan is undervalued: this is because the company’s P/E [FWD] Ratio of 9.46 lies 23.12% below its Average over the past 5 years (12.30).
In addition to that, it is worth mentioning that the bank’s Dividend Yield [TTM] of 2.93% lies 4.92% above its Average Dividend Yield [TTM] from the past 5 years (which is 2.79%), strengthening my belief that the bank is undervalued at this moment of time.
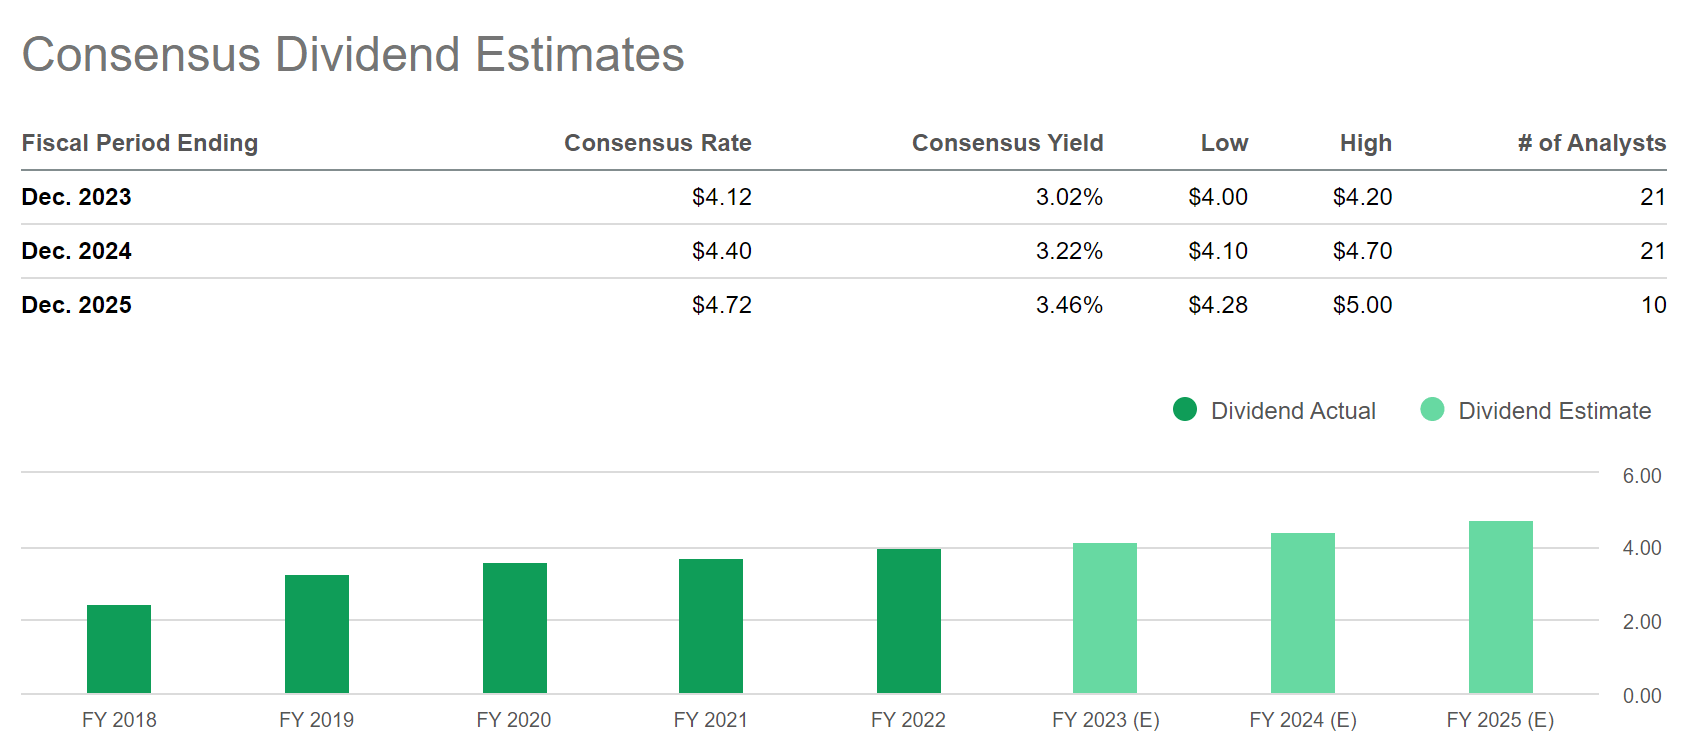
Below you can find the Consensus Dividend Estimates for JPMorgan. The Consensus Yield lies at 3.02% for 2023, at 3.22% for 2024, and at 3.46% for 2025, thus justifying JPMorgan’s inclusion in this list of dividend growth companies to invest in.
Source: Seeking Alpha
Moreover, I would like to mention that I see JPMorgan as being ahead of most of its competitors when it comes to Dividend Growth: JPMorgan’s Dividend Growth Rate [CAGR] over the past 5 years stands at 12.91% while Citigroup’s (NYSE: C ) is 9.77%, Royal Bank of Canada’s (NYSE: RY ) is 6.26% and Wells Fargo’s (NYSE: WFC ) is -5.11%.
JPMorgan has also shown more Consecutive Years of Dividend Growth (12 years) when compared to these competitors: Royal Bank of Canada has shown 7 Consecutive Years of Dividend Growth, Wells Fargo 1 Consecutive Year, and Citigroup has not reported any Consecutive Years of Dividend Growth.
Mastercard
I consider Mastercard’s Valuation to be particularly attractive at this moment in time: first, the company’s P/E [FWD] Ratio of 31.38 stands 16.86% below its Average over the past 5 years (37.74). Second, its current Price / Sales [FWD] Ratio of 14.06 is 15.37% below the Average it has shown in the past 5 years (16.62). And third, Mastercard’s Price / Cash Flow [FWD] Ratio of 29.64 stands 18.42% below its Average from over the past 5 years (36.33).
Mastercard has shown 15 Consecutive Years of Dividend Payments and 11 Consecutive Years of Dividend Growth. The graphic below underlines my theory of considering Mastercard an appealing dividend growth company.
Source: Seeking Alpha
Mastercard’s EBIT Growth Rate [FWD] of 18.14% and its Free Cash Flow Per Share Growth Rate [FWD] of 15.31% further increase my confidence that the company is an excellent fit for those investors looking for dividend growth.
In addition to the above, I would like to highlight that Mastercard has shown a higher Revenue Growth Rate [FWD] (14.89%) than competitors such as Visa (NYSE: V ) (Revenue Growth Rate [FWD] of 14.47%, Block (NYSE: SQ ) (10.04%) or PayPal (NASDAQ: PYPL ) (8.31%). This indicates that the company is an excellent pick when considering Growth.
Mastercard also exhibits a higher Return on Equity than these competitors, underlying the company’s strength in terms of Profitability: while Mastercard’s Return on Equity stands at 154.10%, Visa’s is 42.35%, PayPal’s is 13.37% and Block’s is -2.09%.
Microsoft
Despite Microsoft’s elevated Valuation (the company’s P/E [FWD] Ratio of 33.16 is 11.54% higher than its Average from the past 5 years), I have retained my strong buy rating for the company. Moreover, I believe that it continues to be attractive for dividend growth investors.
A number of different metrics underline my theory that Microsoft should contribute to provide your investment portfolio with dividend growth in the coming years: the company has shown a Dividend Per Share Growth Rate [FWD] of 8.61%, which lies 17.36% above the Sector Median. In addition to that, it can be highlighted that Microsoft has shown a Dividend Growth Rate [CAGR] of 10.16% over the past 3 years.
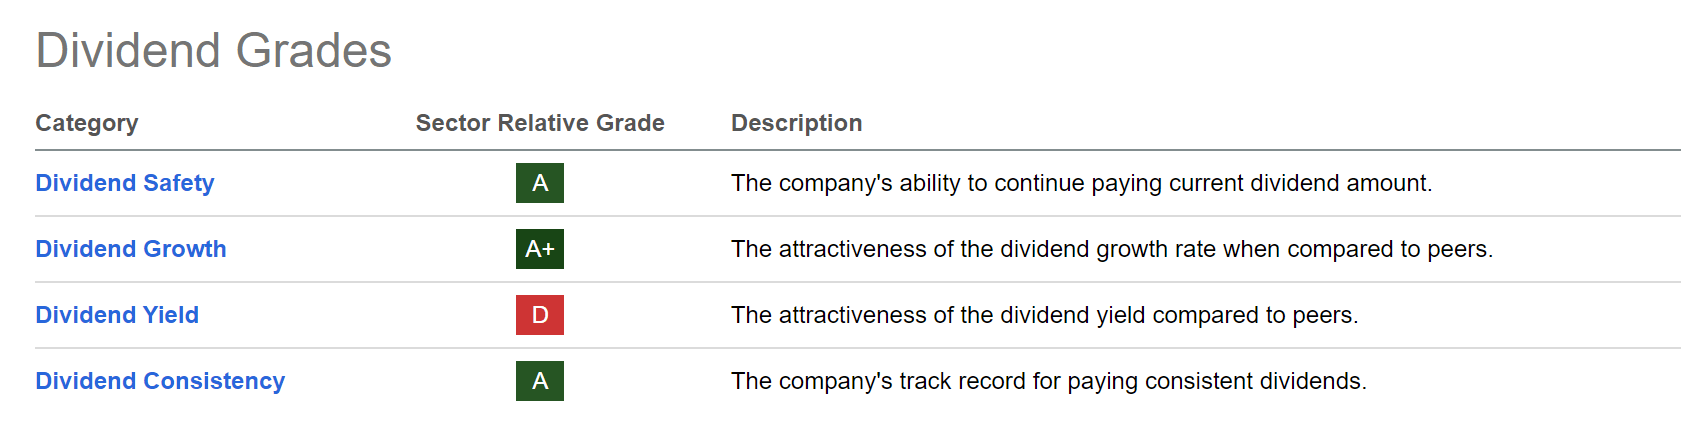
The Seeking Alpha Dividend Grades further confirm the company’s attractiveness when it comes to Dividend Growth: Microsoft receives an A+ rating for Dividend Growth, as well as an A rating for both Dividend Safety and Dividend Consistency.
Source: Seeking Alpha
Nasdaq
I consider Nasdaq to currently be fairly valued. This is because its P/E [FWD] Ratio of 22.17 stands 5.69% below its Average from over the past 5 years (23.51). Moreover, its Price / Sales [FWD] Ratio of 7.21 lies 1.98% below the Average it has shown over the past 5 years (which is 7.36).
The company’s Valuation is significantly lower than the one of its peer group: while Nasdaq’s P/E [FWD] Ratio is at 22.17, MSCI’s (NYSE: MSCI ) is 38.40 and S&P Global’s (NYSE: SPGI ) is 37.34, thus demonstrating that Nasdaq is the most adequate pick when it comes to Valuation.
When considering the company’s current stock price of $53.80, we can see that it pays a Dividend Yield [FWD] of 1.62%. Meanwhile, its Payout Ratio stands at a low level (29.63%), indicating that there is enough room for future dividend enhancements.
The company has shown a Dividend Growth Rate [CAGR] of 9.57% over the past 5 years, which supports my theory that Nasdaq is an outstanding option for dividend growth investors.
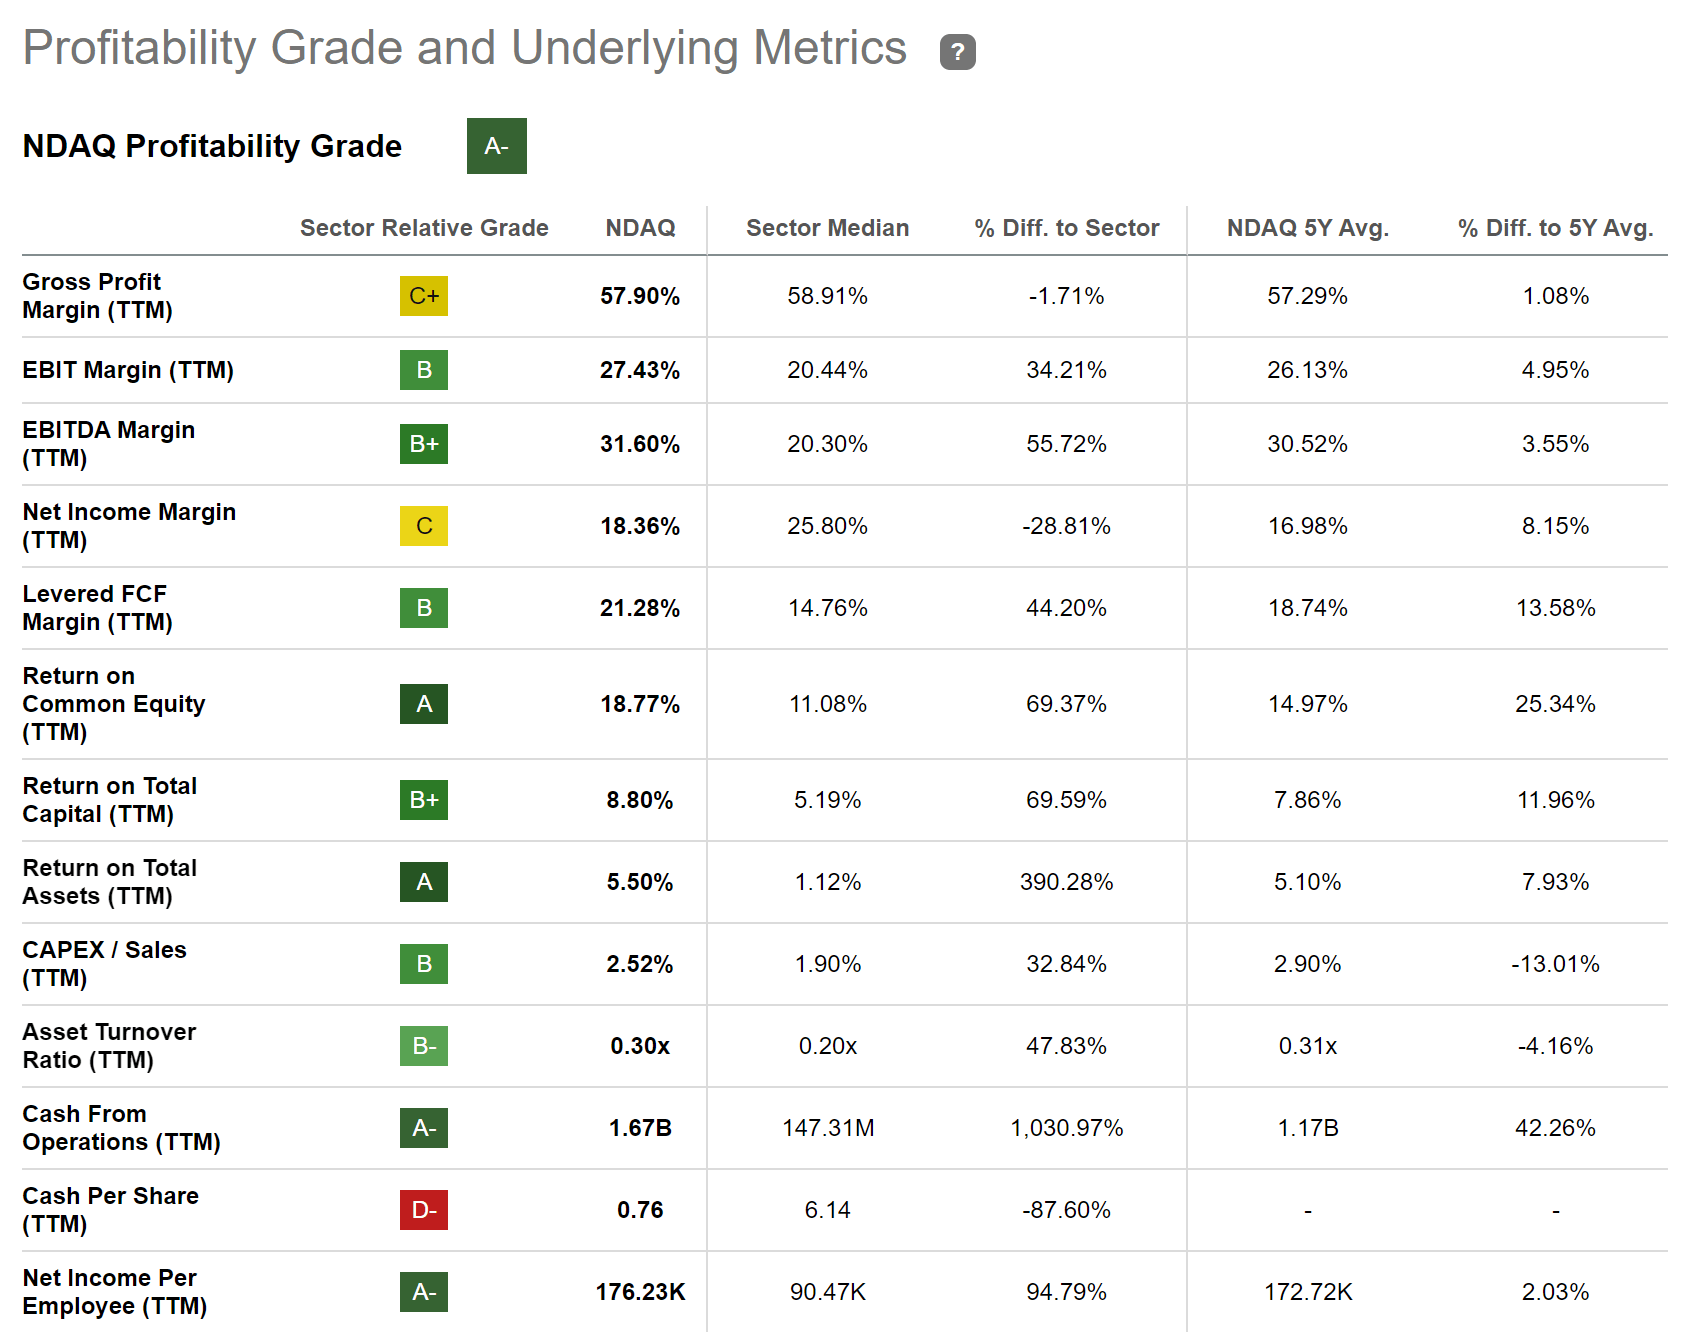
Furthermore, it is worth noting that Nasdaq has an EBIT Margin [TTM] of 27.43%, which lies 32.23% over the Sector Median (20.74%). Moreover, the company’s Return of Equity of 18.77% is 69.02% above the Sector Median, once again this underlines that the company is an excellent pick when it comes to Profitability. The same is confirmed when looking at the Seeking Alpha Profitability Grade for Nasdaq, which you can find below.
Source: Seeking Alpha
The Charles Schwab Corporation
The stock price of The Charles Schwab Corporation is still down by 18.56% within the past 12-month period.
At this moment of writing, the company pays investors a Dividend Yield [FWD] of 1.89%, while its Payout Ratio stands at a relatively low level of 21.87%.
In terms of Growth, The Charles Schwab Corporation has recently shown excellent results, which is underlined by its Revenue Growth Rate [YoY] of 14.77%.
When it comes to Valuation, I believe that the company continues to be undervalued: this is because its P/E [FWD] Ratio of 17.80 stands 12.90% below its Average over the past 5 years (20.43).
Below you can find the Seeking Alpha Profitability Grade for The Charles Schwab Corporation, which further confirms that the company has excellent financial ratios: its Return on Common Equity of 21.34% stands 92.22% above the Sector Median and its Return on Total Assets [TTM] of 1.38% is 22.87% higher than the Sector Median (which is 1.12%).
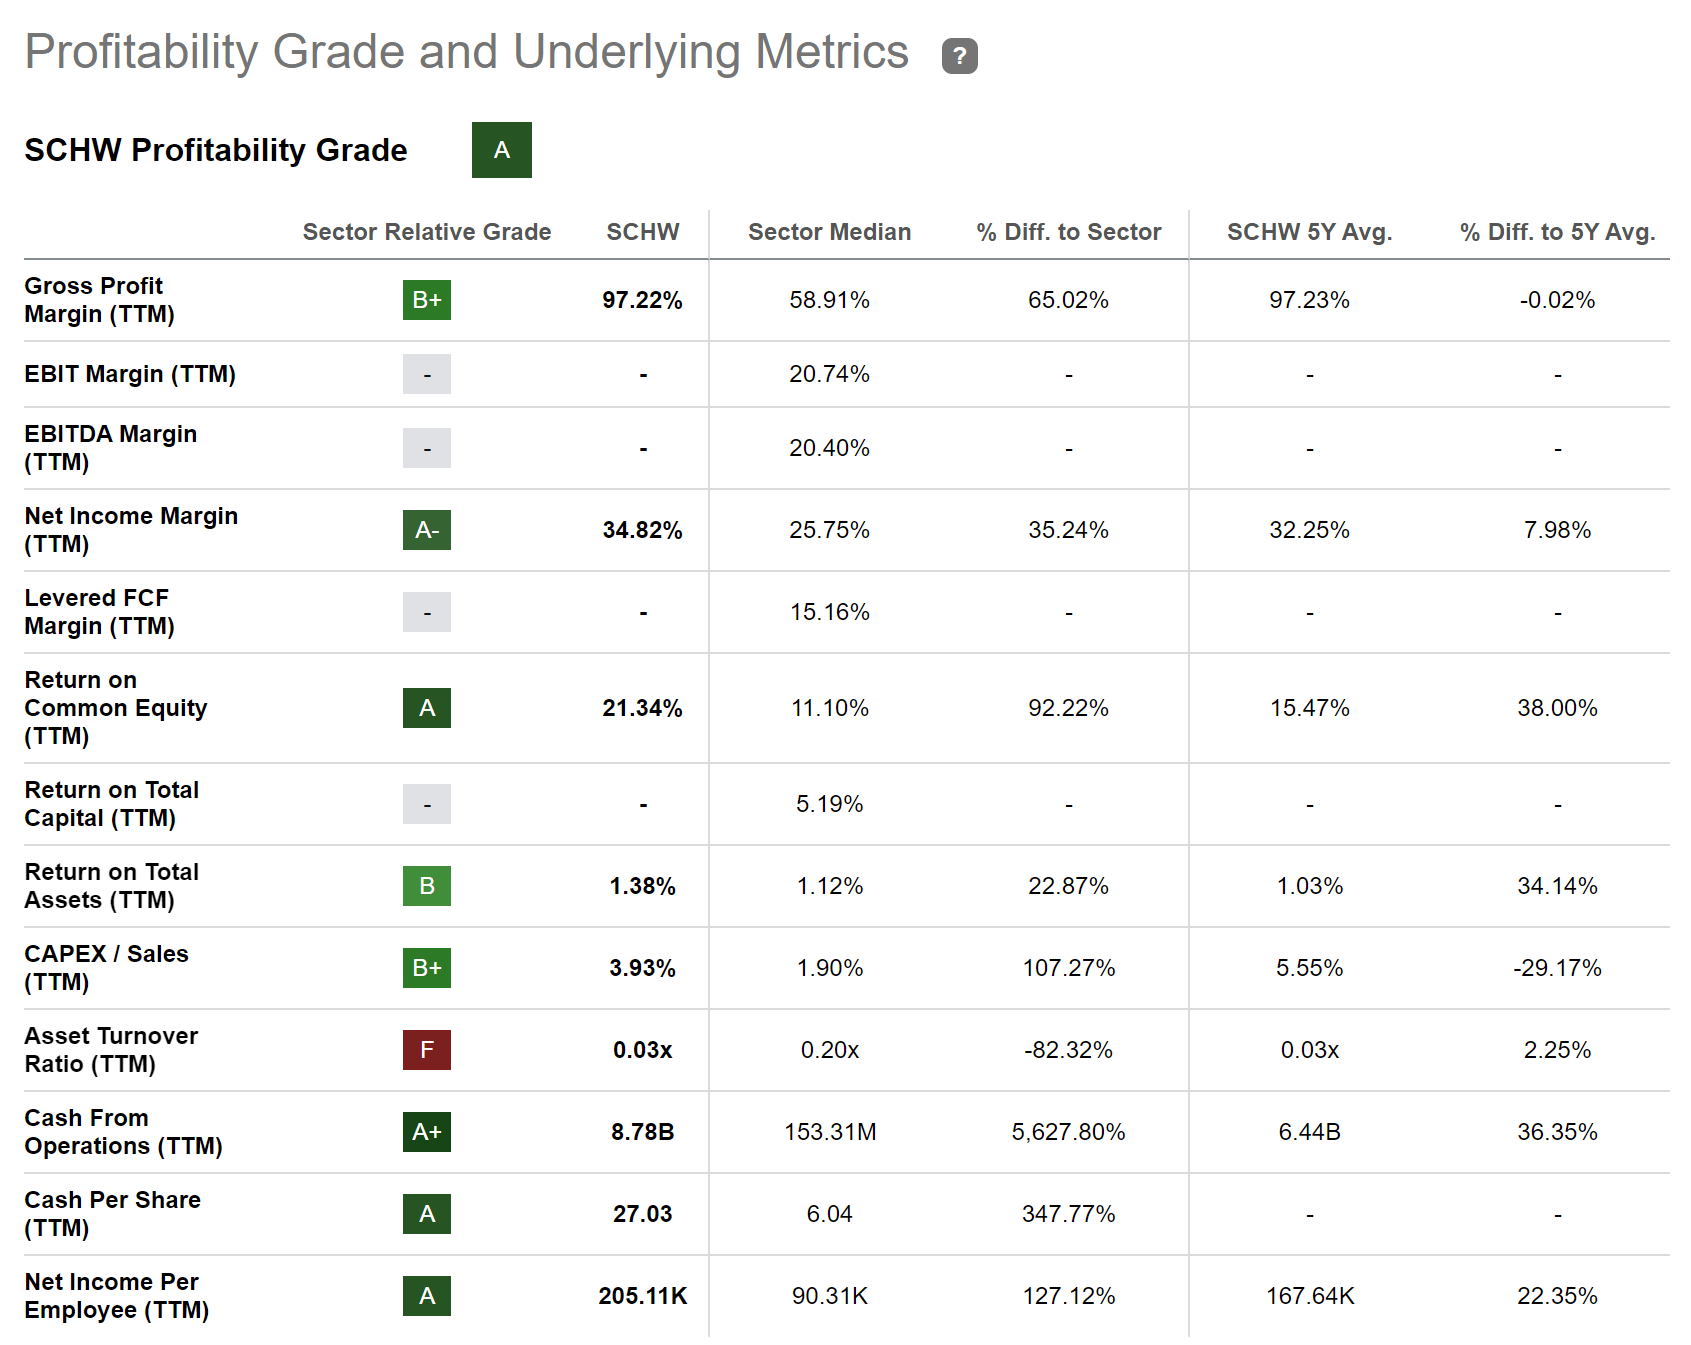
Source: Seeking Alpha
Union Pacific Cooperation
Union Pacific Corporation offers transportation services . The company has 31,471 employees and was founded back in 1862.
Union Pacific Corporation currently pays a Dividend Yield [FWD] of 2.71%. In addition to that, it fulfils several characteristics as an attractive dividend growth company from my point of view: it has shown a Dividend Growth Rate [CAGR] of 14.83% over the past 5 years and of 14.96% over the past 10 years. Furthermore, the company’s Dividend Per Share Growth Rate [FWD] lies at an attractive level of 8.91%.
These characteristics make me believe that Union Pacific Corporation has the potential to deliver substantial dividend growth to shareholders within the next nears.
In addition to the points mentioned above, it can be stated that the company has shown 33 Consecutive Years of Dividend Payments and 16 Consecutive Years of Dividend Growth, underlying its Dividend Consistency.
The Seeking Alpha Dividend Grades, which you can find below, once again demonstrate that the company is an appealing pick for those investors seeking dividend income and dividend growth. Union Pacific Corporation is rated with an A+ for Dividend Consistency, an A for Dividend Growth and an A- for Dividend Safety.
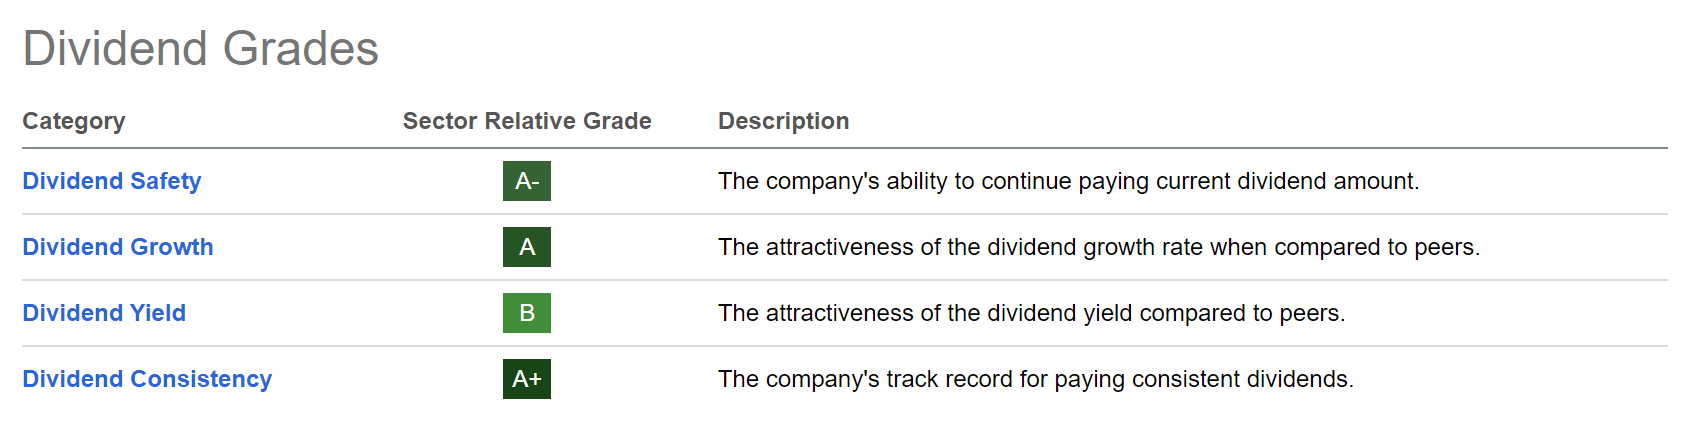
Source: Seeking Alpha
Moreover, I believe that the company’s current Valuation is attractive for investors: my opinion is based on the fact that its P/E [FWD] Ratio stands at 16.94, which is 16.83% below its Average from over the past 5 years. Moreover, its current P/E [FWD] Ratio lies 6.11% below the Sector Median (18.04), once again indicating that the company is currently undervalued.
Conclusion
The longer your investment horizon, the greater the potential positive impact that dividend growth companies can have. The reason for this is that dividend growth companies can help enormously when it comes to raising the Dividend at an attractive growth rate year over year.
In this article, I have listed 10 companies that I currently consider to be particularly attractive for dividend growth investors. This is due to the fact they share different metrics: the selected companies have robust competitive advantages, are at least fairly valued, have a strong financial health as well as a track record of significant dividend growth within the past years.
Their Average Dividend Growth Rate [CAGR] over the past 5 years stands at an attractive level of 15.48%. These metrics lead me to firmly believe that they should provide your investment portfolio with significant Dividend Growth in the years to come.
Author’s note: I would appreciate hearing your opinion on this selection of dividend growth companies. Do you own any of these picks or plan to acquire them? What are currently your favorite dividend growth stocks to buy?
For further details see:
My Top 10 Dividend Growth Stocks To Invest In For June 2023