VZ - My Top 10 Growth Companies For June 2023
2023-06-22 17:00:00 ET
Summary
- Growth companies can provide your investment portfolio with excellent returns.
- However, they can come attached with elevated risk factors due to high growth expectations often being priced into the companies’ stock prices.
- In this article, I will introduce you to 10 growth companies that are attractive right now, particularly due to their significant competitive advantages and strong financial health.
Investment Thesis
Although growth companies can potentially offer investors excellent returns, it is crucial to have in mind that they often come along with high risk factors.
I have selected in this article 10 growth companies that I currently consider to be attractive for investors. The reason for this is that they have significant competitive advantages, a strong financial health, and have recently shown impressive results in terms of growth.
However, you should be aware of the risk factors that come along with these investments, especially when selecting growth companies with a high Valuation. This is because a high Valuation implies that high growth expectations have been priced into their stock price and therefore the downside risks are relatively high. This is the case because their stock price can decrease significantly if growth expectations are not met.
Therefore, I suggest limiting the number of growth companies relative to your total investment portfolio. This strategy helps to reduce its risk level and to increase the chances of obtaining excellent investment results over the long term.
Below you can find the selection process of the 10 growth companies that I have selected for the month of June. I described this process in a previous article . So, if you are already familiar with this process, you can skip the following description written in italics.
First step of the Selection Process: Analysis of the Financial Ratios
In order to identify attractive growth companies, I have used a filter process to make a pre-selection. From this pre-selection, I then select my top 10 growth companies of the month. The companies should fulfil the following requirements in order to become part of the pre-selection:
- Market Capitalization > $5B
- P/E [FWD] Ratio < 100
- Average Revenue Growth Rate over the past 3 years > 6% [changed from 8%]
- Average EBITDA Growth Rate over the past 3 years > 6% [changed from 8%]
- EBIT Margin [TTM] > 0% or Net Income Margin [TTM] > 0
You may wonder why the P/E [FWD] Ratio should not be below 100 when selecting attractive growth companies. If this maximum P/E Ratio was significantly lower, it would lead to the exclusion of companies that have historically had a very high P/E Ratio, and could still turn out to be excellent long-term investments. An example would be Amazon (NASDAQ: AMZN ) , which has shown an Average P/E [FWD] Ratio of 194.07 over the last 5 years. Nevertheless, the Valuation of the majority of the final selected companies is well below this P/E [FWD] Ratio of 100.
The Average Revenue Growth Rate and EBITDA Growth Rate of more than 6% [changed from 8%] contribute to only selecting companies that have shown significant growth within the past years and therefore justify their designation as a growth stock.
An EBIT Margin of more than 0% helps to only select those growth stocks that are profitable. This contributes to reducing the risk level of your investment and to decrease the probability of losing the money you invest.
Second step of the selection process: Analysis of the Competitive Advantages
In a second step, the companies’ competitive advantages (for example: brand image, innovation, technology, economies of scale, etc.) are analyzed in order to make an even narrower selection. I consider it to be particularly important for companies to have strong competitive advantages in order to stand out against the competition in the long term. Companies without strong competitive advantages have a higher probability of going bankrupt one day, thus representing a strong risk for investors to lose their invested money.
Third step of the selection process: The Valuation of the companies
In the third step of the selection process, I will dive deeper into the Valuation of the companies.
In order to conduct the Valuation process, I use different methods and criteria, for example, the companies’ current Valuation as according to my DCF Model, the expected compound annual rate of return as according to my DCF Model and/or a deeper analysis of the companies’ P/E [FWD] Ratio. These metrics should serve as an additional filter to only select companies that currently have an attractive Valuation, which helps you to identify companies that are at least fairly valued.
The Fourth and final step of the selection process: Diversification over Industries and Countries
In the fourth and final step of the selection process, I have established the following rules for choosing my top picks: in order to help you diversify your investment portfolio, a maximum of two companies should be from the same industry. In addition to that, there should be at least one pick that is from a company that is based outside of the United States, serving as an additional geographical diversification.
New Companies compared to the previous month
- Palo Alto Networks (NASDAQ: PANW )
- PayPal (NASDAQ: PYPL )
- T-Mobile (NASDAQ: TMUS )
- The Trade Desk (NASDAQ: TTD )
- XP (NASDAQ: XP )
My Top 10 Growth Companies to Invest in for June 2023
These are the selected 10 companies for June:
- Adobe (NASDAQ: ADBE )
- Alphabet (NASDAQ: GOOG ) (NASDAQ: GOOGL )
- Amazon
- Palo Alto Networks
- PayPal
- Salesforce (NYSE: CRM )
- T-Mobile
- Tesla (NASDAQ: TSLA )
- The Trade Desk
- XP
Overview of the Selected Growth Companies for June 2023
| Company Name |
| Sector |
| Industry |
| Country |
| P/E FWD Ratio |
| Revenue Growth 3Y |
| Adobe |
| Information Technology |
| Application Software |
| United States |
| 31.52 |
| 15.57% |
| Alphabet |
| Communication Services |
| Interactive Media and Services |
| United States |
| 23.14 |
| 19.53% |
| Amazon |
| Consumer Discretionary |
| Broadline Retail |
| United States |
| 81.32 |
| 21.00% |
| Palo Alto Networks |
| Information Technology |
| Systems Software |
| United States |
| 57.03 |
| 25.75% |
| PayPal |
| Financials |
| Transaction & Payment Processing Services |
| United States |
| 13.44 |
| 15.41% |
| Salesforce |
| Information Technology |
| Application Software |
| United States |
| 28.42 |
| 20.87% |
| T-Mobile |
| Communication Services |
| Wireless Telecommunication Services |
| United States |
| 18.31 |
| 20.65% |
| Tesla |
| Consumer Discretionary |
| Automobile Manufacturers |
| United States |
| 74.17 |
| 48.97% |
| The Trade Desk |
| Communication Services |
| Advertising |
| United States |
| 62.90 |
| 32.91% |
| XP |
| Financials |
| Investment Banking and Brokerage |
| Brazil |
| 14.82 |
| 30.04% |
Source: The Author
Adobe
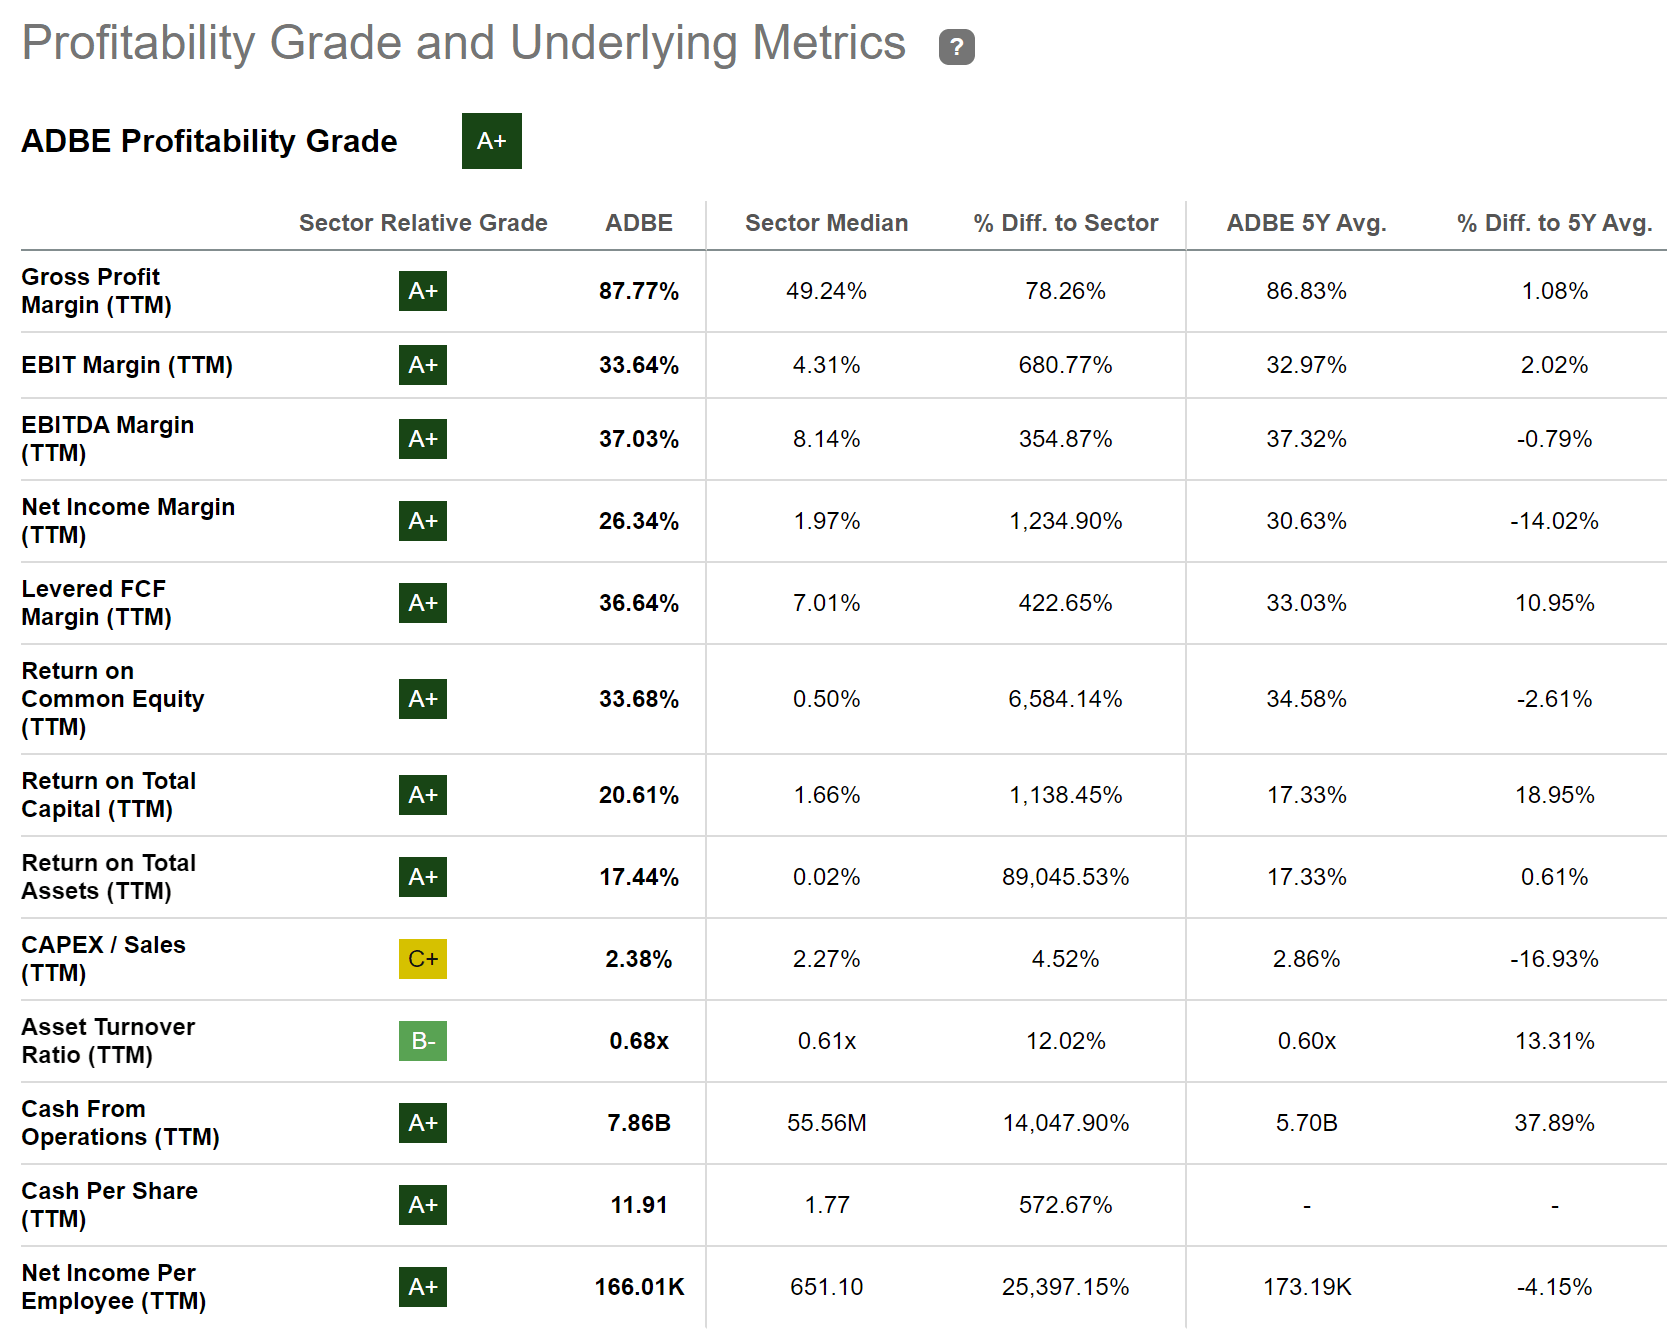
Among Adobe’s competitive advantages are its strong brand image, its loyal customer base, its focus on innovation and its cloud-based subscription models, which help to provide the company with an economic moat over competitors.
Adobe has shown attractive results when it comes to Growth: the company’s Revenue Growth Rate [FWD] is 11.12% and its EBIT Growth Rate [FWD] stands at 10.57%.
Adobe is also an excellent choice in terms of Profitability. The company has an EBITDA Margin [TTM] of 37.03%, which lies clearly above the Sector Median of 8.14%. Adobe’s Return on Equity of 33.68% further confirms its high Profitability.
Below you can find the Seeking Alpha Profitability Grade, which further underlines my investment thesis.
Alphabet
Alphabet currently has a Market Capitalization of $1.57T. I believe that its competitive advantages will help the company to stand out against its competitors in the years ahead. Among the company’s most significant competitive advantages, I count the high amount of data it has collected over the last decades, its enormous financial health (its Total Cash & ST Investments are $115,102M) as well as its strong brand image.
Alphabet’s current Valuation is below its Average from over the past 5 years: while the company’s current P/E [FWD] Ratio stands at 23.10, its Average over the past 5 years has been 26.67. These metrics show us that Alphabet’s current Valuation lies 13.39% below its Average from over the past 5 years.
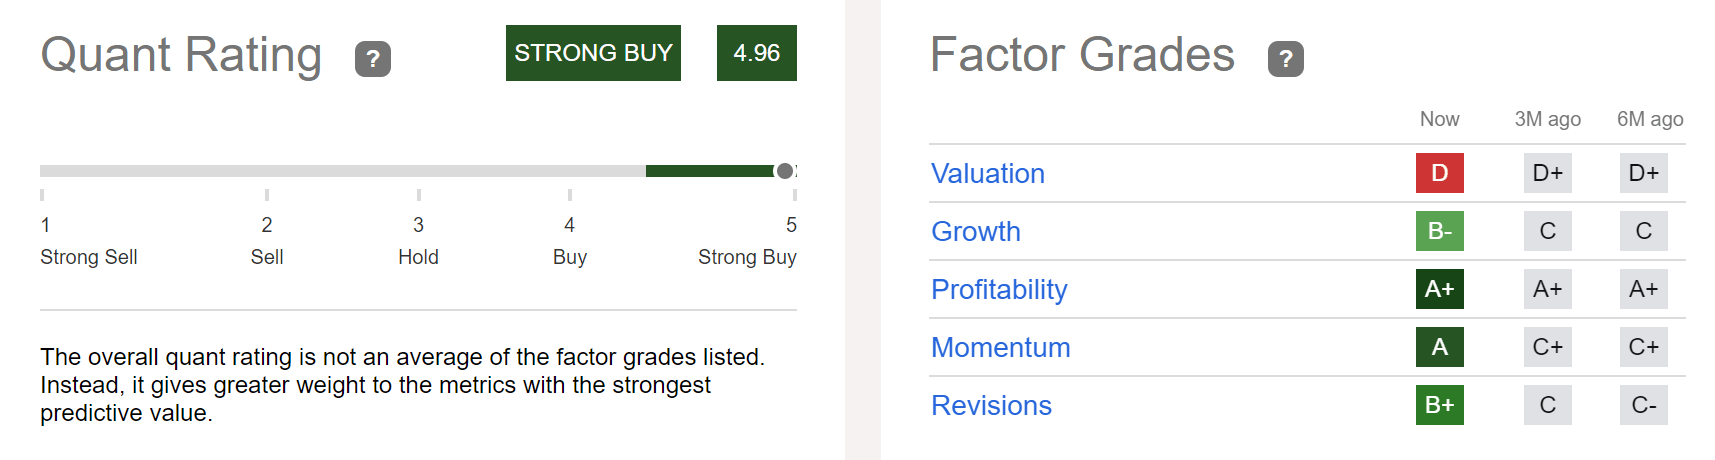
Below you can see the results of the Seeking Alpha Quant Rating, which indicates Alphabet to currently be a strong buy. Considering the Seeking Alpha Factor Grades, it can be highlighted that Alphabet is rated with an A+ in terms of Profitability, an A for Momentum, a B+ for Revisions and a B- for Growth. Only for Valuation is Alphabet rated with a D.
Amazon
Amazon’s current Market Capitalization stands at $1.29T. I believe that Amazon will continue its growth story due to the large amount of competitive advantages the company has, which includes: its strong custumer focus (which has contributed to their loyal customer base), the company’s continuous focus on innovation, its strong brand image, its large amount of customer data as well as its broad logistics network.
Amazon’s P/E Non-GAAP [FWD] Ratio currently lies at 80.22 (it has been at 190.87 on Average over the past 5 years). This serves as a clear indicator that an investment in Amazon comes along with lower risk factors compared to the past, since the growth expectations that are priced into the company’s stock price are not as high as they had been before.
However, it should be mentioned that its P/E Non-GAAP [FWD] Ratio of 80.22 indicates that the company’s growth expectations are still relatively high, which suggests that its stock price could decline significantly if those growth expectations cannot be fulfilled.
Therefore, I would limit the Amazon position to a maximum of 5% of your overall portfolio. The reason for not limiting the position to a lower percentage in order to reduce the risk level even further, is that I believe the reward (the compound annual rate of return) for Amazon investors can still be very attractive when having a long investment horizon.
In terms of Growth, I continue to see Amazon as being on track: this is underlined by the company’s Revenue Growth Rate [FWD] of 10.10% and its EBIT Growth Rate [FWD] of 10.67%.
Palo Alto Networks
Palo Alto Networks offers cybersecurity solutions on a global basis. It has 13,979 employees and a current Market Capitalization of $75.40B.
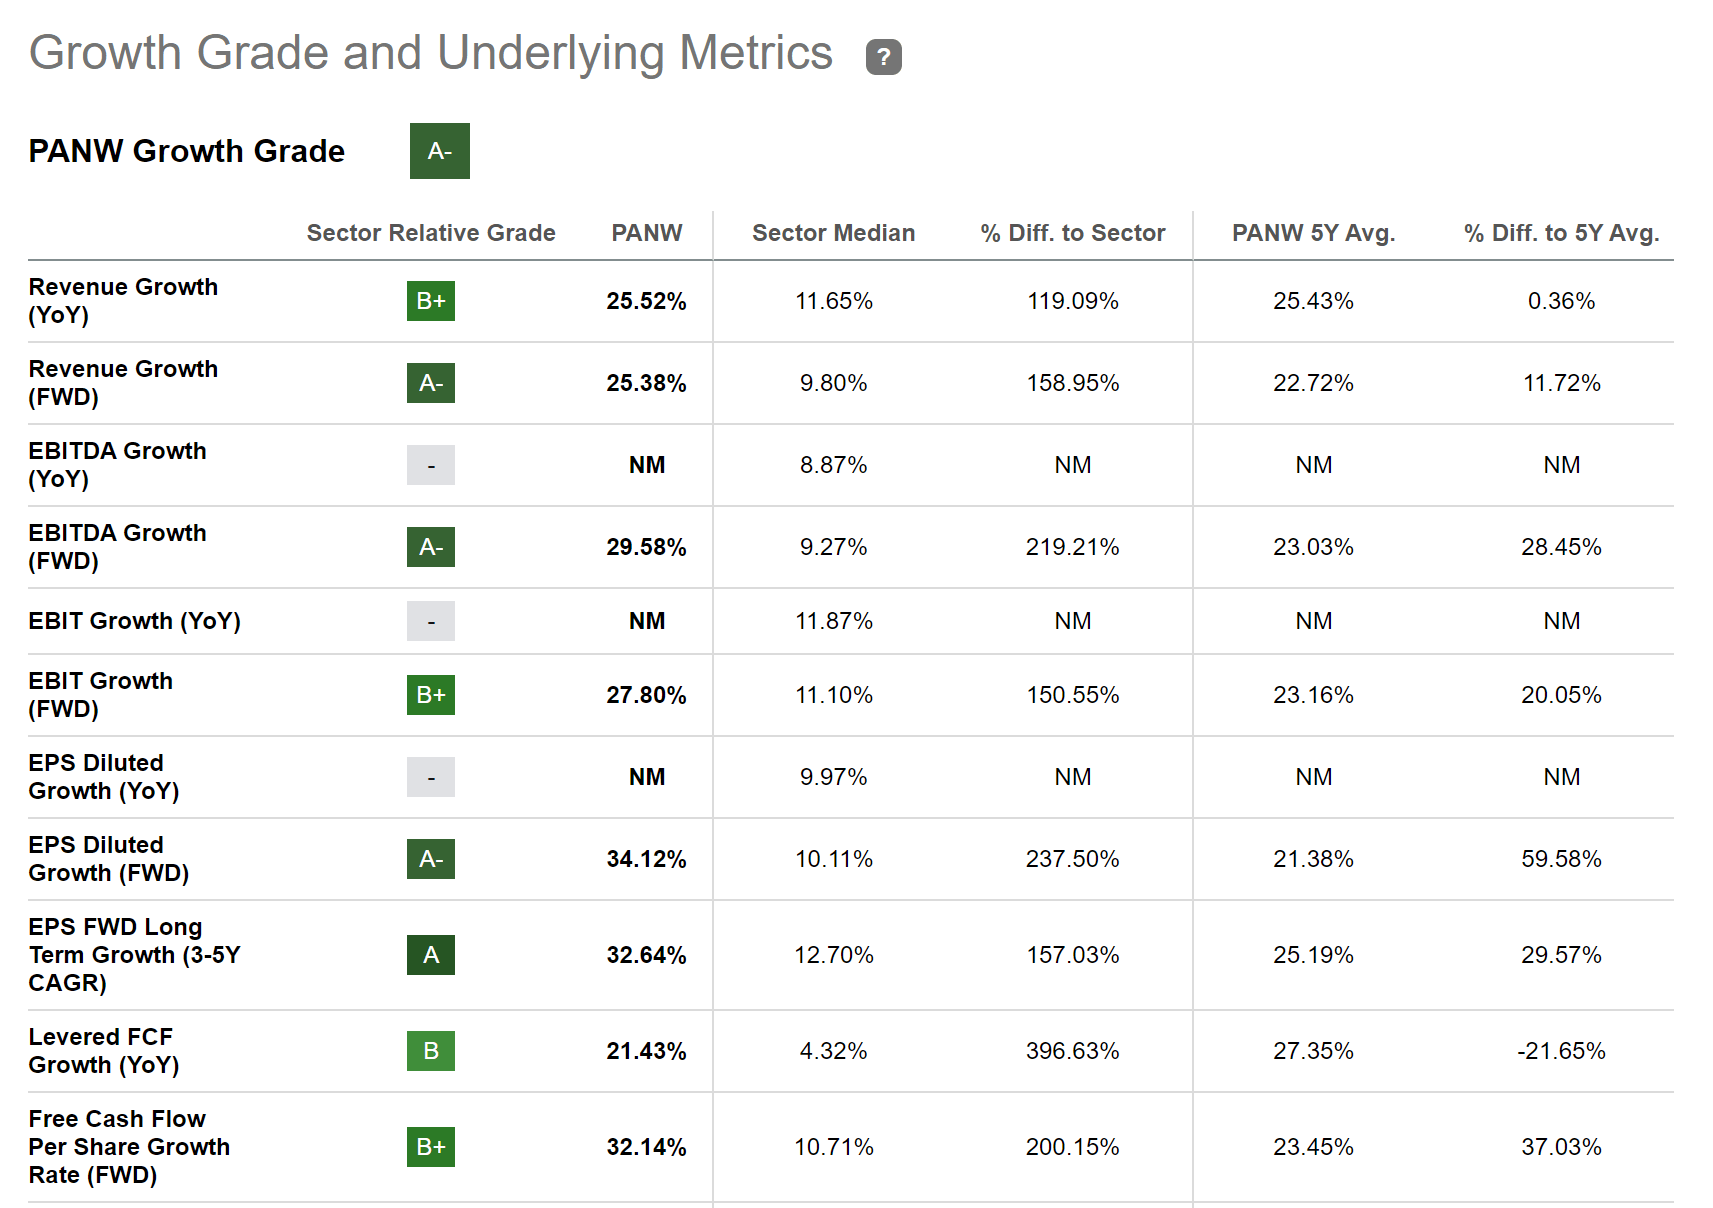
Lately, the company has shown impressive growth rates: its Revenue Growth Rate [FWD] stands at 25.38%, which is significantly above the Sector Median of 9.80%, and its EBIT Growth Rate [FWD] of 27.80% is also well above the Sector Median (11.10%).
However, you should be aware of the fact that the company’s Valuation is high. Palo Alto Networks has a P/E Non-GAAP [FWD] Ratio of 57.66, which is slightly above its Average from the past 5 years (52.48). Due to this high Valuation, I suggest limiting the proportion of Palo Alto Networks to a maximum of 1% of your overall portfolio in the case that you decide to include it. This will help you to reduce the downside risk of your investment portfolio and therefore increase the probability of achieving excellent investment results over the long term.
Below you can find the Seeking Alpha Growth Grade for Palo Alto Networks which further underlines the company’s excellent growth perspective.
PayPal
It is true that PayPal has lately not shown similar growth in comparison to the past: the company’s Revenue Growth Rate [FWD] stands at 8.30% while it has been 16.77% on Average over the past 5 years. Its EBIT Growth Rate [FWD] has been 6.05% (it has been 19.12% on Average over the past 5 years).
PayPal’s lower growth rates have contributed to the fact that its current Valuation is significantly lower than previous times: the company’s P/E GAAP [FWD] Ratio stands at 19.65, which is 64.87% below its Average from over the past 5 years.
PayPal’s current Valuation is significantly lower than the Valuation of competitors such as Visa (NYSE: V ) (P/E [FWD] Ratio of 27.52) or Mastercard (NYSE: MA ) (31.66). However, it should also be mentioned that the growth rates of Visa (Revenue Growth Rate [FWD] of 14.66%) and Mastercard (14.88%) have been above PayPal’s (8.30%). I further believe that both Visa and Mastercard’s economic moat (to which their strong brand image, financial health and their large amount of debit and credit cards contribute) is higher than PayPal’s, thus indicating that their higher Valuation is justified. Nevertheless, I consider PayPal to currently be undervalued at the company’s current price level.
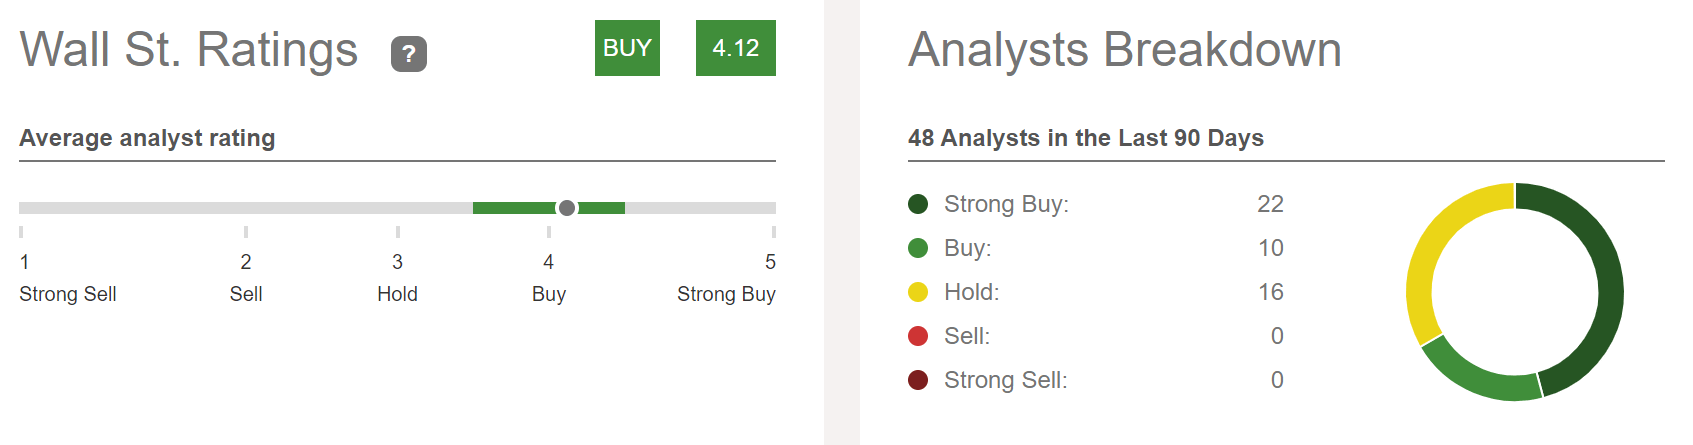
Below you can find the Wall Street Rating, which underlines my own buy rating for the company: 22 Analysts rate PayPal as a strong buy and 10 Analysts rate it as a buy.
Salesforce
Salesforce offers Customer Relationship Management technology in order to unite companies and their customers. The company was founded in 1999.
Salesforce has shown excellent metrics in terms of growth, which has contributed to me including it in this list of growth companies to buy in June 2023.
The company has shown a Revenue Growth Rate [FWD] of 13.16% that stands significantly above the Sector Median of 9.80%, and an EPS Diluted Growth Rate [FWD] of 23.58%, which is also well above the Sector Median of 10.11%.
Salesforce’s P/E Non-GAAP [FWD] Ratio of 28.42 stands 45.10% below its Average from over the past 5 years, which serves as an indicator that the company is undervalued at this moment in time.
The Seeking Alpha Quant Rating further strengthens my belief that Salesforce is an excellent pick for investors: the company is currently ranked 5 th out of 206 within the Application Software Industry, it is ranked 10 th out of 586 within the Information Technology Sector and 50 th out of 4700 in the Overall Ranking.
Source: Seeking Alpha
T-Mobile
T-Mobile provides mobile communications services and currently has 71,000 employees. The company has a P/E [FWD] Ratio of 18.31, which lies 54.68% below its Average from the past 5 years (40.41). This metric clearly indicates that it is undervalued. T-Mobile’s current Price / Cash Flow [TTM] of 9.25, which lies 35.39% below its Average from over the past 5 years, indicates the same.
The Seeking Alpha Growth Grade further strengthens my belief that the company is an excellent fit for investors when it comes to growth: T-Mobile’s EBIT Growth Rate [FWD] of 38.09% lies significantly above the Sector Median (4.52%). This is also the case for the company’s EPS Diluted Growth Rate [FWD] of 59.47%, which also lies significantly above the Sector Median (3.96%).
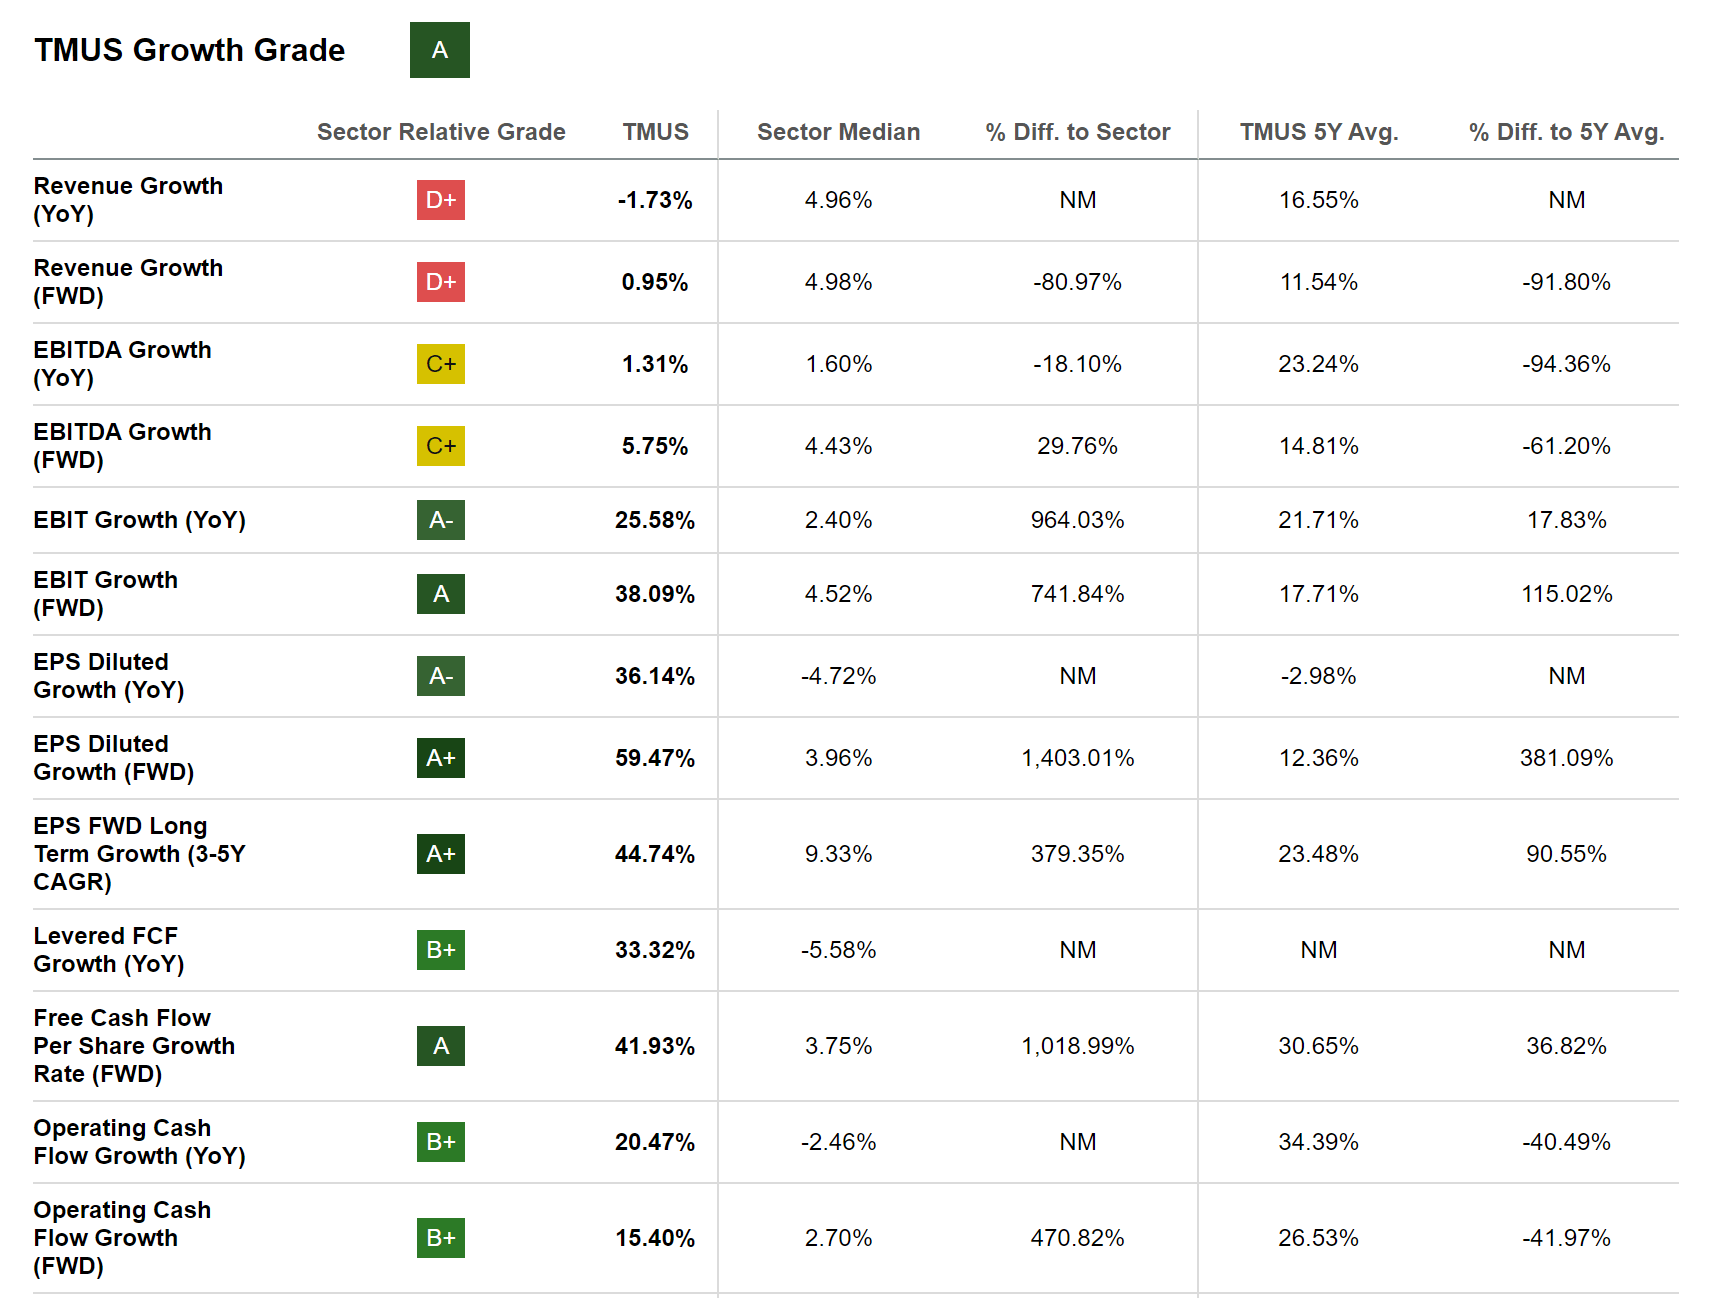
In terms of Growth, I see T-Mobile being clearly ahead of competitors such as AT&T (NYSE: T ) or Verizon (NYSE: VZ ): while T-Mobile has shown a Revenue Growth Rate [CAGR] of 13.79% over the past 5 years, AT&T’s is -5.32% and Verizon’s is 1.25%. The same is confirmed when having a look at the company’s EBIT Growth Rate: while T-Mobile’s EBIT Growth Rate [CAGR] over the past 3 years is at 27.35%, AT&T’s is -0.40% and Verizon’s is -0.69%. All these metrics indicate that T-Mobile is in front of AT&T and Verizon in terms of growth.
The Seeking Alpha Quant Ranking further confirms that T-Mobile is an excellent pick for investors: The company is ranked 3 rd out of 19 within the Wireless Telecommunication Services Industry, 15 th out of 253 within the Communication Services Sector and 320 th out of 4700 in the Overall Ranking.
Source: Seeking Alpha
Tesla
Within the past 12-month period, Tesla has shown a performance of 22.26%. At this moment of writing, the company has a Market Capitalization of $825.78B.
Tesla has shown a Revenue Growth [YoY] of 38.34%, which is much higher than the Sector Median of 6.85% and has contributed to it being included in this list of growth companies. The company’s EPS Diluted Growth Rate [FWD] of 30.58% also contributed to this.
Below you can find the Seeking Alpha Growth Grade for the company, which further strengthens my investment thesis to include Tesla in this list of growth companies.
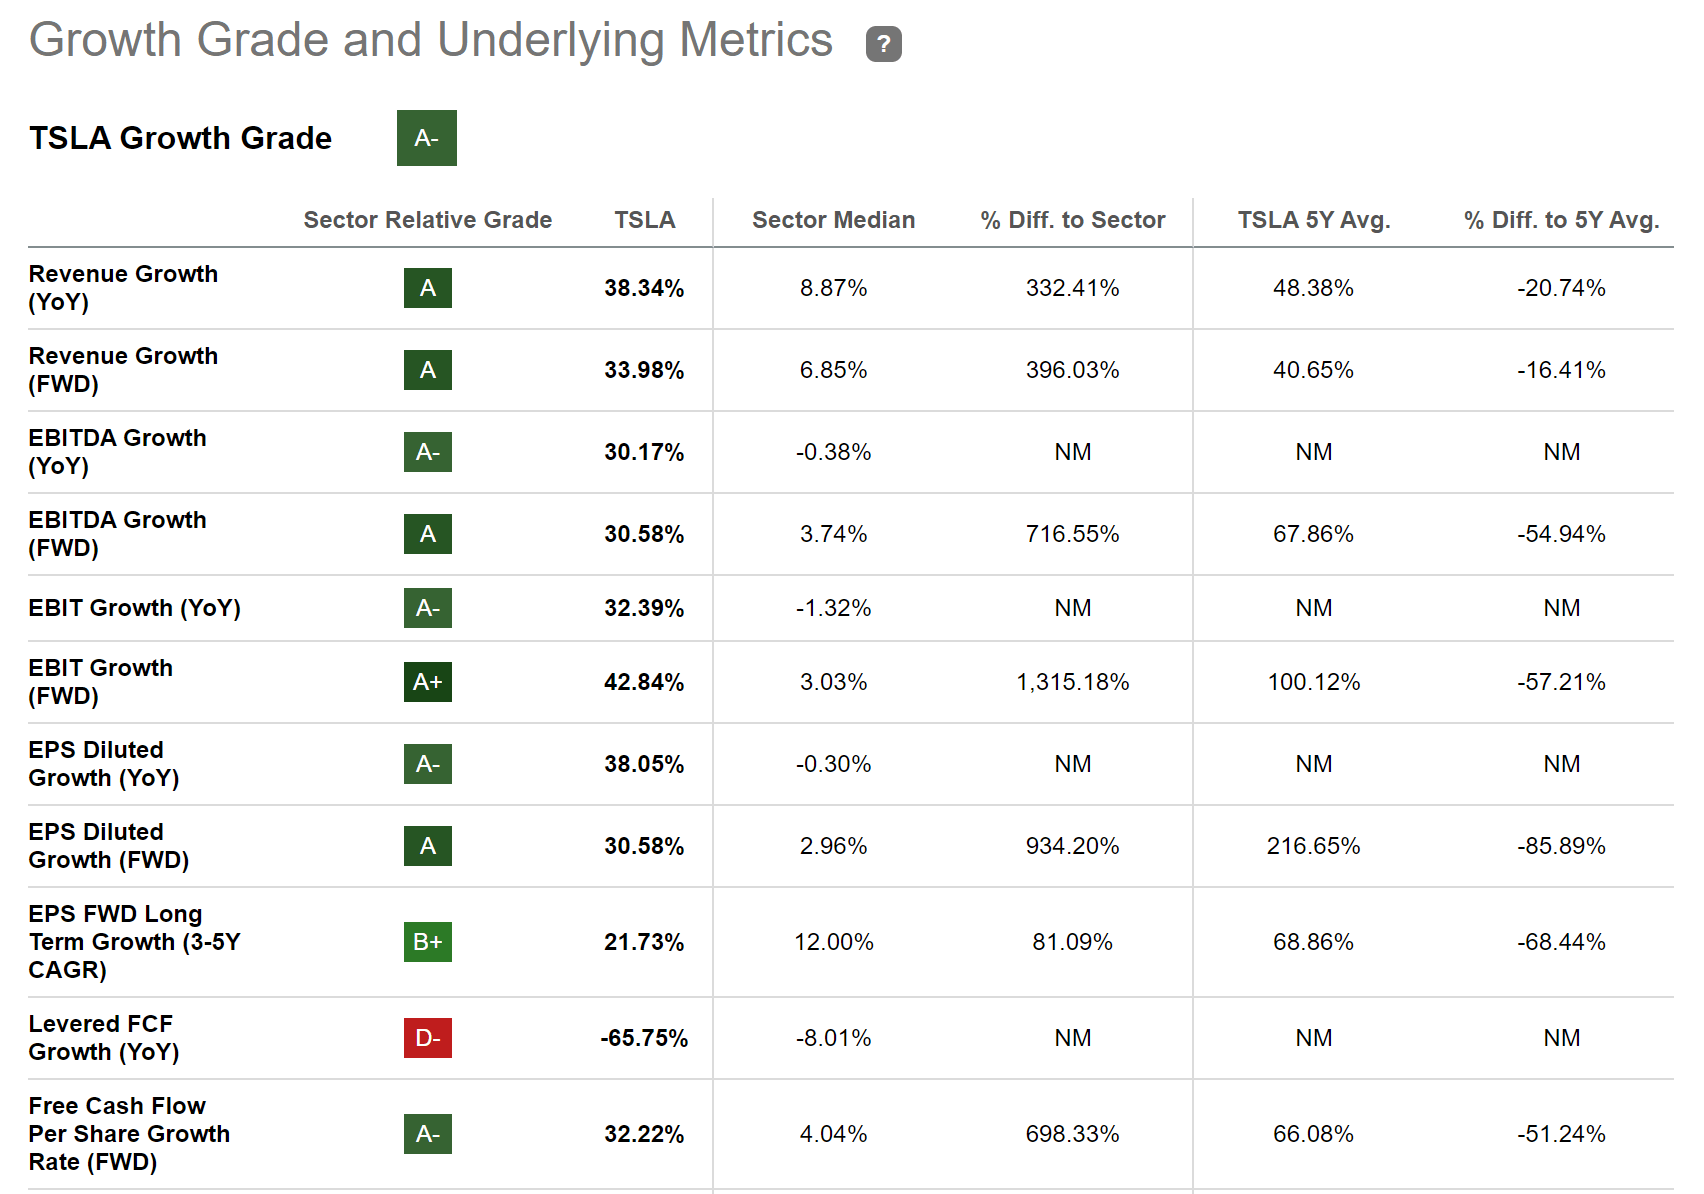
Even though Tesla’s current P/E Non-GAAP [FWD] Ratio of 74.17 is lower than its Average from over the past 5 years (which is 122.96), it is still significantly above the Sector Median of 14.29.
These numbers show us that in Tesla’s stock price, high growth expectations are still priced in, which leads me to the conclusion to underweight the Tesla position in an investment portfolio.
I suggest to currently limit the Tesla position to a maximum of 3% of your total investment portfolio in order to reduce its risk level and to increase the likelihood of achieving excellent investment results over the long term.
The Trade Desk
The Trade Desk is a technology company that was founded in 2009. The company allows buyers to plan, manage, optimize, and measure data-driven digital advertising campaigns. The Trade Desk has 2,770 employees and a current Market Capitalization of $37.36B.
The company has lately shown excellent results in terms of growth, which is why it has been included in this list of growth companies. The Trade Desk’s Revenue Growth Rate [FWD] of 25.70% stands 416.40% above the Sector Median, and its EPS Diluted Growth Rate [FWD] of 17.57% also lies well above the Sector Median (3.96%).
However, when taking a look at the company’s Valuation, we can see that the risk factors are relatively high, since high growth expectations are priced into its stock price. This is underlined by the company’s P/E Non-GAAP [FWD] Ratio of 62.90, which is much higher than the Sector Median (14.34).
Due to the high risk-factors that come attached to an investment in The Trade Desk, I suggest to give the company a maximum of 1% of your total investment portfolio. This will help limit your portfolio’s downside risk while at the same time allowing you to benefit from the company’s growth potential.
The results of the Seeking Alpha Factor Grades underline my investment thesis that the company is an attractive pick for investors, but that its Valuation is high: The Trade Desk receives an A+ for Momentum, and an A- for Growth, Profitability and Revisions. For Valuation, it only receives an F, thus strengthening my thesis to only underweight the company in an investment portfolio.
Source: Seeking Alpha
XP
XP offers financial products and services in Brazil and was founded in 2001. The company currently has a Market Capitalization of $12.40B.
XP has a large number of competitive advantages such as the strong brand image it has built in Brazil, its broad distribution network, and its digital platform on which it offers a broad product portfolio to its clients.
I believe that the company’s current Valuation is attractive: XP’s P/E [FWD] Ratio stands at 14.82. I believe that this Valuation is attractive, particularly when taking into account the company’s growth rates. XP’s Revenue Growth Rate [FWD] is 14.26% and its EBIT Growth Rate [FWD] is 8.66%. Both metrics stand significantly above the Sector Median.
When having a look at the Wall Street Rating, it can be highlighted that 3 Analysts rate the company as a strong buy and 2 as a buy, backing up by own buy rating for the company.
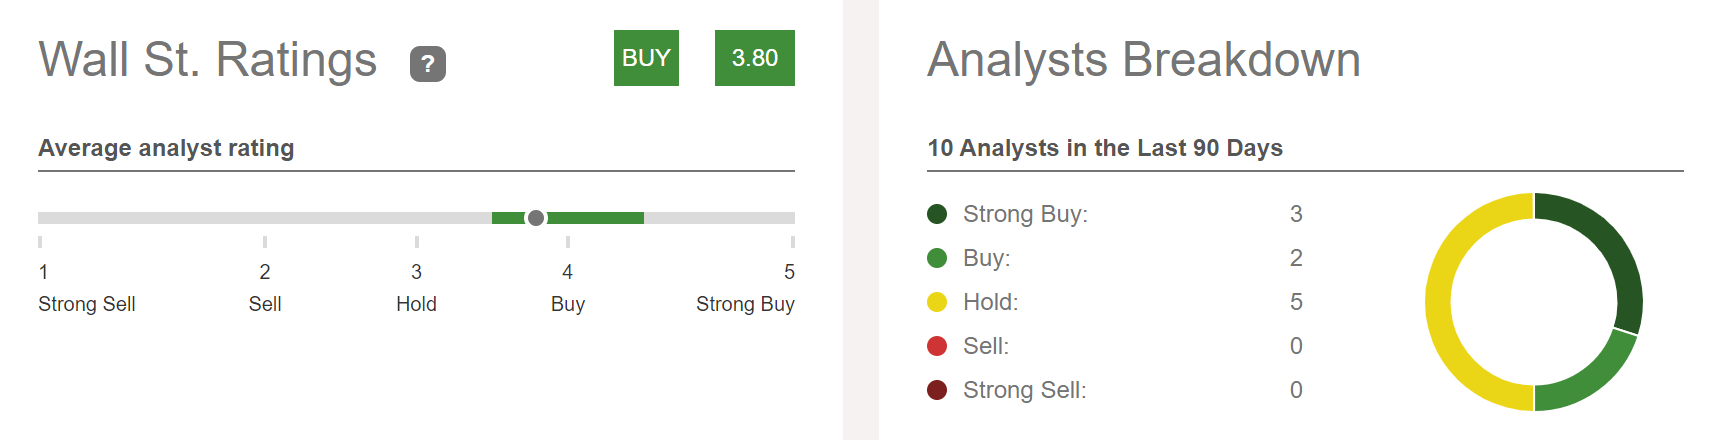
Due to the risk factors that come attached to an investment (such as the currency risk), I suggest to currently limit the XP position to a maximum of 2% of your overall investment portfolio in case you plan to include it.
Conclusion
In general, I consider the risk factors that come attached to an investment in growth companies to be high. This is why I suggest that you limit the percentage of such companies in your overall investment portfolio.
I particularly consider companies that have a high P/E [FWD] Ratio to come along with high risk factors. The higher the P/E Ratio, the higher the growth expectations that are priced into the company’s stock price, and therefore the higher the downside risk for your portfolio. This is the case since the stock price can decline significantly if any of these companies fail to meet their growth target.
From the 10 growth companies that are listed in this article, the following have a particularly high P/E [FWD] Ratio and come along with higher risks, therefore I strongly suggest limiting their percentage in your overall portfolio: Amazon (P/E [FWD] Ratio of 81.32), Palo Alto Networks (57.03), Tesla (74.17), and The Trade Desk (62.90).
By limiting the number of growth companies compared to your overall investment portfolio, you are able to reduce the downside risk while still being able to benefit from the excellent growth potential these companies can provide your portfolio with.
Author’s Note: I would appreciate your opinion on this selection of growth companies. Do you already own or plan to buy some of the listed companies? Which are currently your favorite growth stocks to invest in?
For further details see:
My Top 10 Growth Companies For June 2023