CA - My Top 10 High Dividend Yield Companies For July 2023
2023-07-01 15:00:00 ET
Summary
- My investment strategy aims to combine Dividend Income with Dividend Growth, helping you become less affected by the stock market’s price fluctuations.
- In today’s article, I will present you with 10 high dividend yield companies that currently have an attractive Valuation.
- In addition to that, they have strong competitive advantages, are financially healthy, and I expect them to provide your portfolio with Dividend Growth.
Investment Thesis
Dividend payments can be an excellent source of additional income for investors, particularly when the selected companies not only provide Dividend Income, but also Dividend Growth. My investment strategy focuses on building investment portfolios that have the objective of providing you with an attractive mix of Dividend Income and Dividend Growth, thus helping you grow your extra income at an attractive rate.
In today’s article that focuses on high dividend yield companies, I will introduce you to those kinds of companies that can help you earn a significant amount of extra income in the form of Dividends. Each of these selected companies has strong competitive advantages, is financially healthy, and has an attractive Valuation (8 out of the 10 selected companies have a P/E [FWD] Ratio below 10).
These picks could help you raise the Weighted Average Dividend Yield of your investment portfolio and help you become increasingly protected from stock market price fluctuations.
Below, I will describe the selection process in more detail. Since I have already described this process in a previous article , if you are already familiar with it you can skip the following section written in italics.
First step of the Selection Process: Analysis of the Financial Ratios
In order to identify companies with a relatively high Dividend Yield [FWD], I use a filter process to make a pre-selection. From this pre-selection, I will later choose my top 10 high Dividend Yield companies of the month. To be part of this pre-selection of high Dividend Yield stocks, the companies should fulfil the following requirements:
- Market Capitalization > $10B
- Dividend Yield [FWD] > 2.5%
- P/E [FWD] Ratio < 30
In the following, I would like to specify why I have chosen the metrics mentioned above in order to select my top 10 high Dividend Yield stocks of the month.
A Market Capitalization of more than $10B contributes to the fact that the risks attached to your investments are lower, since companies with a higher Market Capitalization tend to have a lower volatility than companies with a low Market Capitalization.
A P/E [FWD] Ratio of less than 30 implies that the price you pay for the company is not extraordinarily high, thus filtering out those that have stock prices in which high growth expectations are priced in. High growth expectations imply strong risks for investors, since the stock price could drop significantly. Again, the filtering process helps us to reduce the risk so that we are more likely to make an excellent investment decision.
Second step of the selection process: Analysis of the Competitive Advantages
In a second step, the companies’ competitive advantages (for example: brand image, innovation, technology, economies of scale, etc.) are analyzed in order to make an even narrower selection. I consider it to be particularly important for companies to have strong competitive advantages in order to stand out against the competition in the long term. Companies without strong competitive advantages have a higher probability of going bankrupt one day, thus representing a strong risk for investors to lose their invested money.
Third step of the selection process: The Valuation of the companies
In the third step of the selection process, I will dive deeper into the Valuation of the companies.
In order to conduct the Valuation process, I use different methods and criteria, for example, the companies’ current Valuation as according to my DCF Model, the expected compound annual rate of return as according to my DCF Model and/or a deeper analysis of the companies’ P/E [FWD] Ratio. These metrics should serve as an additional filter to only select companies that currently have an attractive Valuation, which helps you to identify companies that are at least fairly valued.
The Fourth and final step of the selection process: Diversification over Industries and Countries
In the fourth and final step of the selection process, I have established the following rules for choosing my top picks: in order to help you diversify your investment portfolio, a maximum of two companies should be from the same industry. In addition to that, there should be at least one pick that is from a company that is based outside of the United States, serving as an additional geographical diversification.
New Companies compared to the previous month of June
- BHP Group Limited (BHPLF)
- Energy Transfer (NYSE: ET )
- Rio Tinto (NYSE: RIO )
- Société Générale Société anonyme ([[SCGLF]], [[SCGLY]])
- Swiss RE (SSREF)
My Top 10 High Dividend Yield Stocks to Invest in for July 2023
- Altria (NYSE: MO )
- AT&T (NYSE: T )
- BHP Group Limited
- Energy Transfer
- Rio Tinto
- Société Générale
- Swiss RE
- The Bank of Nova Scotia (NYSE: BNS )(BNS:CA)
- United Parcel Service (NYSE: UPS )
- Verizon Communications Inc. (NYSE: VZ )
Overview of the selected companies for July 2023
| Company Name |
| Sector |
| Industry |
| Country |
| Dividend Yield [TTM] |
| Dividend Yield [FWD] |
| Div Growth 5Y |
| P/E [FWD] Ratio |
| Altria Group |
| Consumer Staples |
| Tobacco |
| United States |
| 8.48% |
| 8.48% |
| 6.69% |
| 9.37 |
| AT&T |
| Communication Services |
| Integrated Telecommunication Services |
| United States |
| 7.01% |
| 7.01% |
| -5.78% |
| 6.85 |
| BHP Group |
| Materials |
| Diversified Metals and Mining |
| Australia |
| 8.77% |
| 5.96% |
| 24.84% |
| 13.86 |
| Energy Transfer |
| Energy |
| Oil and Gas Storage and Transportation |
| United States |
| 8.76% |
| 9.73% |
| -1.43% |
| 8.95 |
| Rio Tinto |
| Materials |
| Diversified Metals and Mining |
| United Kingdom |
| 7.58% |
| 6.93% |
| 10.99% |
| 7.31 |
| Société Générale |
| Financials |
| Diversified Banks |
| France |
| 7.13% |
| 7.13% |
| -6.65% |
| 6.02 |
| Swiss RE |
| Financials |
| Reinsurance |
| Switzerland |
| 6.54% |
| 6.54% |
| 4.64% |
| 3.48 |
| The Bank of Nova Scotia |
| Financials |
| Diversified Banks |
| Canada |
| 6.27% |
| 6.37% |
| 4.48% |
| 9.53 |
| United Parcel Service |
| Industrials |
| Air Freight and Logistics |
| United States |
| 3.60% |
| 3.71% |
| 12.53% |
| 16.33 |
| Verizon Communications |
| Communication Services |
| Integrated Telecommunication Services |
| United States |
| 7.11% |
| 7.14% |
| 2.04% |
| 7.96 |
Source: The Author
BHP Group Limited
BHP Group is a company from the Diversified Metals and Mining Industry that was founded in 1851 and operates through the following segments :
- Copper
- Iron Ore
- Coal
BHP Group pays a Dividend Yield [FWD] of 5.96% and it has shown excellent results in terms of Dividend Growth: the company’s Dividend Growth Rate [CAGR] over the past 10 years is 10.05%, which lies 69.77% above the Sector Median.
This mix between a relatively high Dividend Yield and an attractive Dividend Growth Rate makes the company an appealing fit for dividend income and dividend growth investors that are looking for ways to generate extra income in the form of Dividends.
I believe that the BHP Group is currently fairly valued, which is based on the company’s P/E [FWD] Ratio currently being 13.86. The company’s Average P/E [FWD] Ratio over the past 5 years stands at 13.22, confirming my investment thesis that the company is currently fairly valued.
In addition to that, I would like to highlight that the company is an excellent pick when it comes to Profitability. This thesis is confirmed by having a look at the company’s EBIT Margin [TTM] of 46.30% (the EBIT Margin [TTM] of the Sector Median is 11.51%) and its Return on Equity of 39.04% (the Return on Equity of the Sector Median is 10.68%).
The Seeking Alpha Profitability Grade underlines the company’s strength in terms of Profitability.
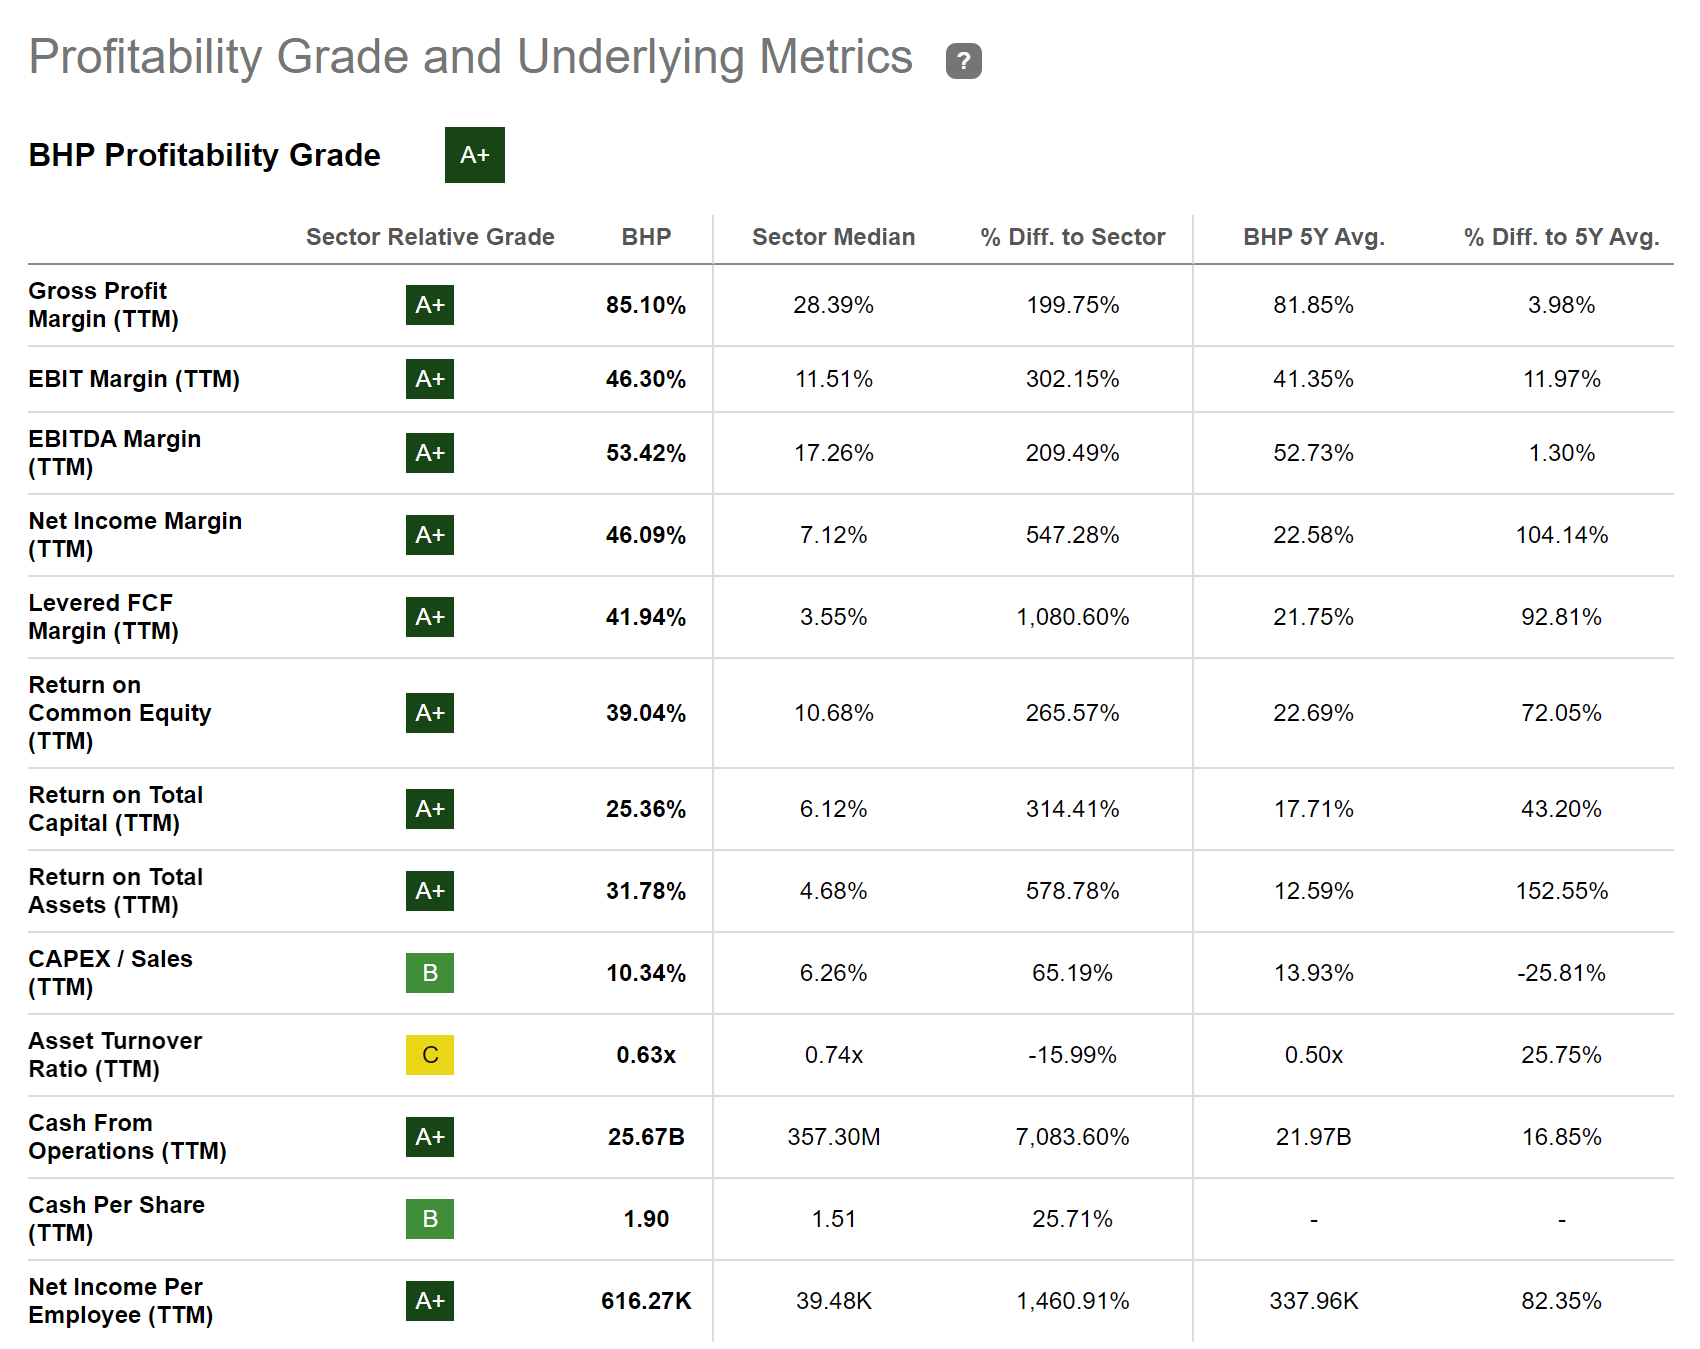
Source: Seeking Alpha
Energy Transfer
At the company’s current price level of $12.74, the company pays a Dividend Yield [FWD] of 9.73%. In addition to that, it is worth mentioning that the company’s 10 Year Dividend Growth Rate [CAGR] stands at 5.76%, indicating that investors should not only benefit from an attractive Dividend Yield, but also from the fact that the company’s Dividend could continue to grow within the upcoming years.
However, it should be mentioned that I do not consider the company’s Dividend to be entirely safe. The reason for that is that its Payout Ratio lies at 82.65%. This relatively high Payout Ratio contributes to the fact that I suggest underweighting the company in an investment portfolio, helping you reduce the downside risk of your portfolio.
Nevertheless, I believe that Energy Transfer is currently an attractive fit for investors when considering risk and reward, which can be proven by the company’s Free Cash Flow Yield [TTM] of 15.69%. This number can be used as a clear indicator that investors can benefit from an investment without relying on the company meeting high growth expectations.
In addition to the above, I would like to highlight that I believe the company is currently fairly valued. This assumption is based on the fact that the company’s P/E Non-GAAP [FWD] Ratio lies at 9.07, which is 1.17% above the Sector Median and only 9.31% above the company’s Average P/E [FWD] Ratio over the past 5 years.
The Seeking Alpha Factor Grades further strengthen my belief that the company is currently a great pick for investors: it is rated with an A- in terms of Profitability and Momentum, with a B for Valuation, and with a C+ for Revisions.
Source: Seeking Alpha
Rio Tinto
Rio Tinto was founded in 1873 and currently has a Market Capitalization of $108.81B. The company provides investors with a Dividend Yield [FWD] of 6.93%.
At the company’s current price level, it has a Free Cash Flow Yield [TTM] of 9.09%, which indicates that the company is an excellent choice in terms of risk and reward at this moment of writing.
Over the past years, the company has also shown excellent results when it comes to Dividend Growth: the company’s Dividend Growth Rate [CAGR] over the past 10 years stands at 11.51%, which lies 94.30% above the Sector Median.
The company’s current P/E [FWD] Ratio of 7.31 further indicates that the company is currently undervalued since it lies 45.54% below the Sector Median (13.43).
The Seeking Alpha Profitability Grade shows us that Rio Tinto disposes of a strong Profitability: the company’s EBITDA Margin [TTM] stands at 40.24% and its Return on Equity is 24.45%, both underlying the company’s strength in terms of Profitability.
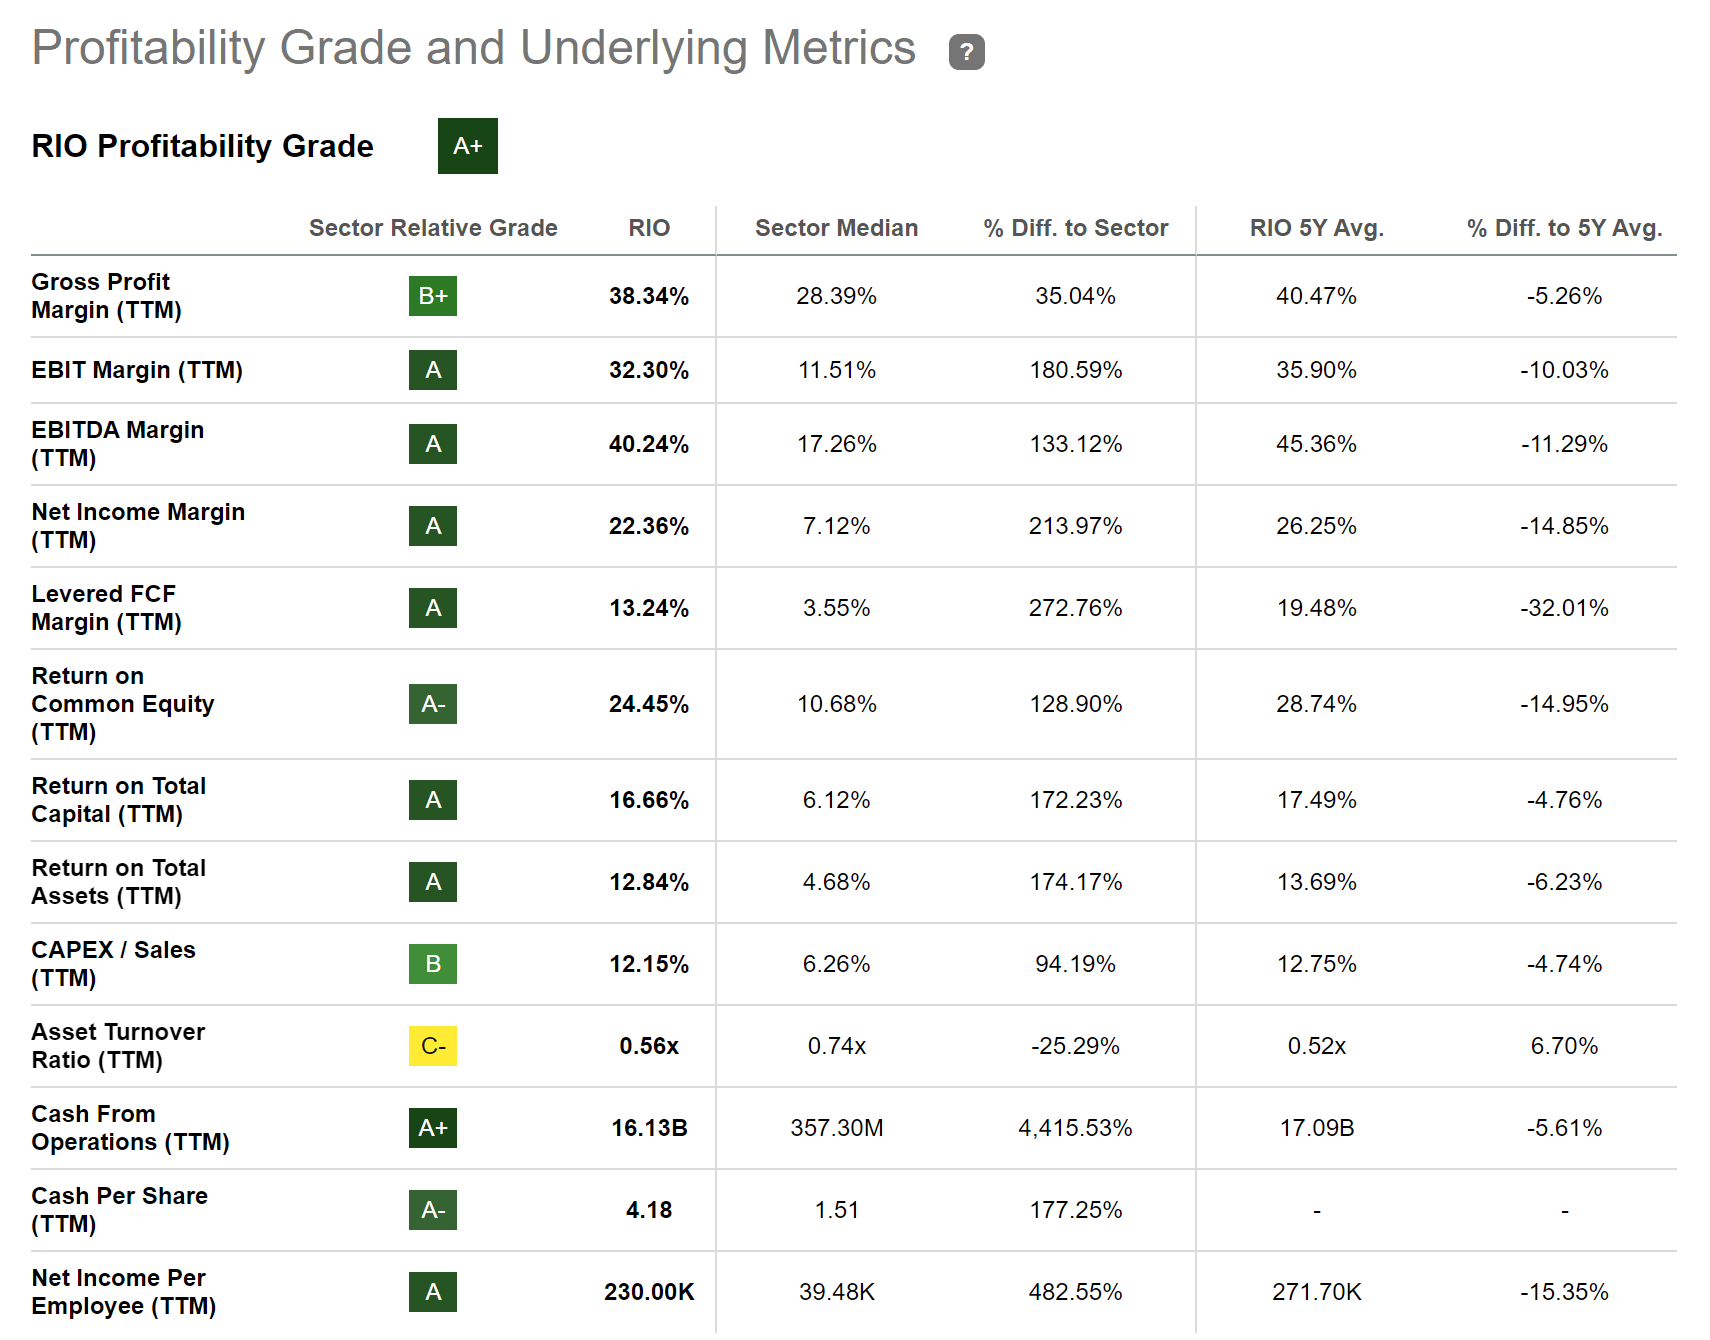
Source: Seeking Alpha
Société Générale
Société Générale provides banking and financial services and it operates through the following segments :
- French Retail Banking
- International Retail Banking & Financial Services
- Global Banking and Investor Solutions
The French bank was founded back in 1864. It currently has 117,000 employees.
At the company’s current stock price of $5.10, it pays shareholders a Dividend Yield [FWD] of 7.13%.
In my opinion, the French bank is currently undervalued. This is confirmed when having a look at the company’s current P/E [FWD] Ratio of 6.02, which lies 33.54% below the Sector Median of 9.06. These metrics strengthen my confidence to believe that the bank is undervalued at its current price level.
The Seeking Alpha Factor Grades also demonstrate that the company could result to be an excellent investment. The French bank is rated with an A+ in terms of Valuation, Growth, and Profitability. For Momentum, it receives an A-, and for Revisions, a D.
Source: Seeking Alpha
However, I do not consider the French banks dividend to be safe (which is further underlined by Seeking Alpha’s D Rating in terms of Dividend Safety). Therefore, I suggest to only underweight the French bank in an investment portfolio in case you decide to include it into your portfolio. I further recommend giving the bank a maximum of 2% of your overall investment portfolio with the objective of reducing the risk level for your investment portfolio and herewith to increase the probability of obtaining excellent returns over the long term.
Swiss RE
Swiss RE provides reinsurance and insurance services worldwide. The company operates through the following segments :
- Property & Casualty Reinsurance
- Life & Health Reinsurance
- Corporate Solutions
The company currently pays a Dividend Yield [FWD] of 6.54%. It has further shown a Dividend Growth Rate [CAGR] of 4.64% over the past 5 years. These numbers have contributed to the fact that I believe it could be a great pick for those investors that would like to combine a high Dividend Yield with Dividend Growth.
In terms of Valuation, I would like to highlight that Swiss RE currently has a P/E GAAP [FWD] Ratio of 3.48, which lies clearly below the Sector Median of 9.06, indicating that the company is undervalued at its current price level.
Below you can find the Seeking Alpha Valuation Grade, which highlights the company’s attractiveness when it comes to Valuation and can be seen as additional evidence that Swiss RE is currently undervalued.
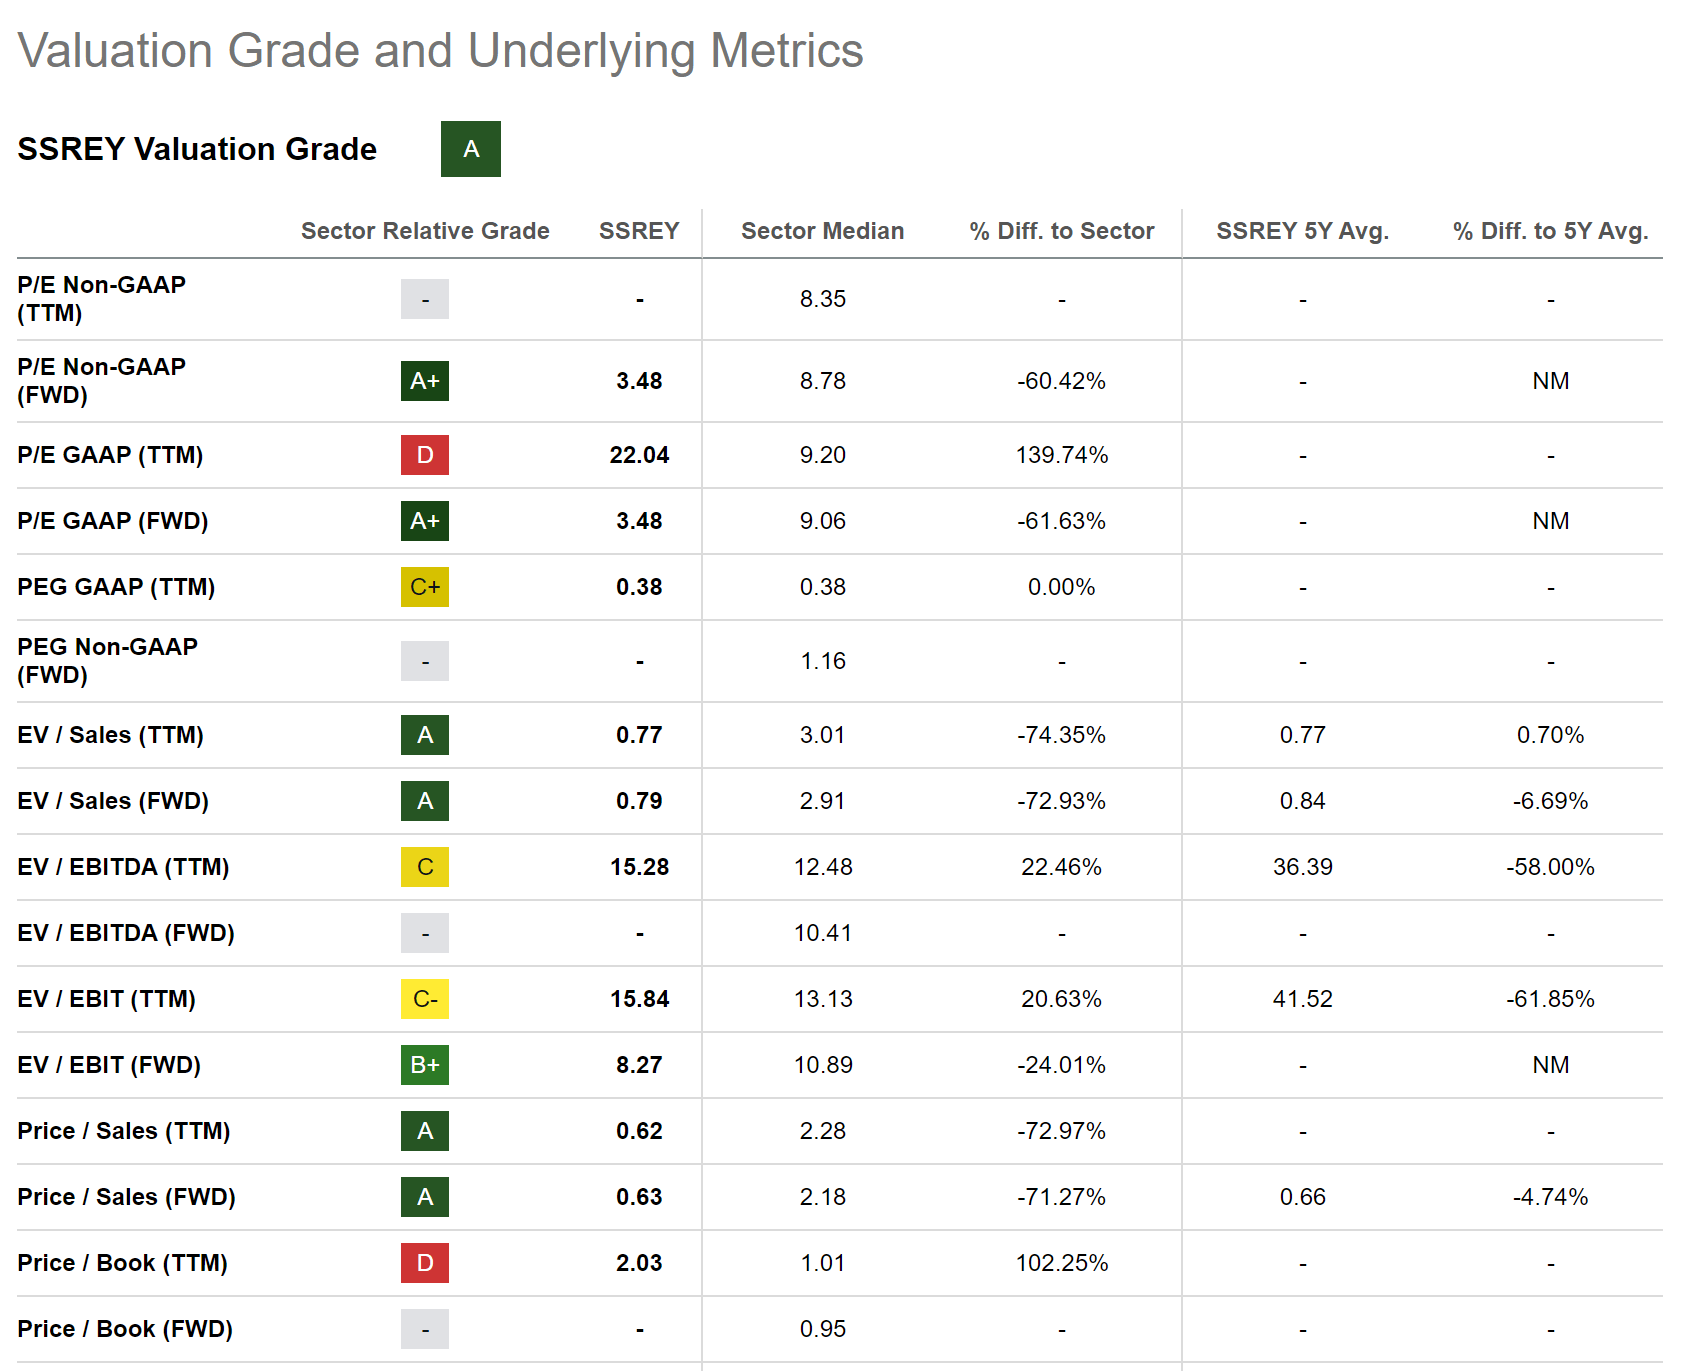
Source: Seeking Alpha
The company further seems to be an attractive fit when it comes to Growth, which is underlined by its EBIT Growth [YoY] of 43.04%, which is clearly above the Sector Median of 5.11%, and its EPS Diluted Growth [YoY] of 58.27%, that is also significantly above the Sector Median (-2.36%).
Altria
Within the past 5 years, Altria has shown a performance of -22.33%. This negative performance has contributed to the fact that the company has an attractive stock price today. At the company’s current price level of $44.50, Altria has a P/E [FWD] Ratio of 9.41.
The company’s current Valuation lies 26.51% below its Average over the past 5 years, clearly indicating that Altria is currently undervalued. This is also confirmed when having a look at the company’s Dividend Yield [TTM] of 8.45%, which lies 17.39% above its Average from over the past 5 years.
Altria pays shareholders a Dividend Yield [FWD] of 8.45% and has a Payout Ratio of 75.92%. I interpret the company’s Payout Ratio of 75.92% in a way that its Dividend is not entirely safe. For this reason, I suggest that you limit the proportion of the Altria position to a maximum of 5% of your total investment portfolio when deciding to include the company in your portfolio.
When compared to Philip Morris (NYSE: PM ), I believe that Altria is slightly superior when it comes to Dividend Yield (Altria’s Dividend Yield [FWD] is 8.45% while Philip Morris’ is 5.28%), Dividend Growth (Altria’s 5 Year Dividend Growth Rate [CAGR] is 6.69% while Philip Morris’ is 3.15%) and in terms of Profitability (while Altria’s Gross Profit Margin is 68.82%, Philip Morris’ is 63.58%).
I also believe that Altria is more attractive than Philip Morris in terms of Valuation, which is confirmed by the company’s lower P/E [FWD] Ratio of 9.41 when compared to Philip Morris’s (P/E [FWD] Ratio of 15.74).
AT&T
AT&T has a number of competitive advantages, providing the company with an economic moat over new companies that could enter into its business segment: among the company’s competitive advantages are its strong brand image (according to Brand Finance , AT&T is currently 22 nd in the list of the most valuable brands in the world), its broad customer base, the company’s economies of scale and its network infrastructure.
At this moment of writing, I believe that the company has an attractive Valuation: AT&T currently has a P/E [FWD] Ratio of 6.82. This implies that the company’s P/E [FWD] Ratio currently lies 40.34% below its Average over the past 5 years. It also lies 61.71% below the Sector Median. Therefore, I believe that AT&T is currently undervalued.
Below you can find the Seeking Alpha Valuation Grade which raises my confidence that the company is an attractive pick in terms of Valuation at this moment in time.
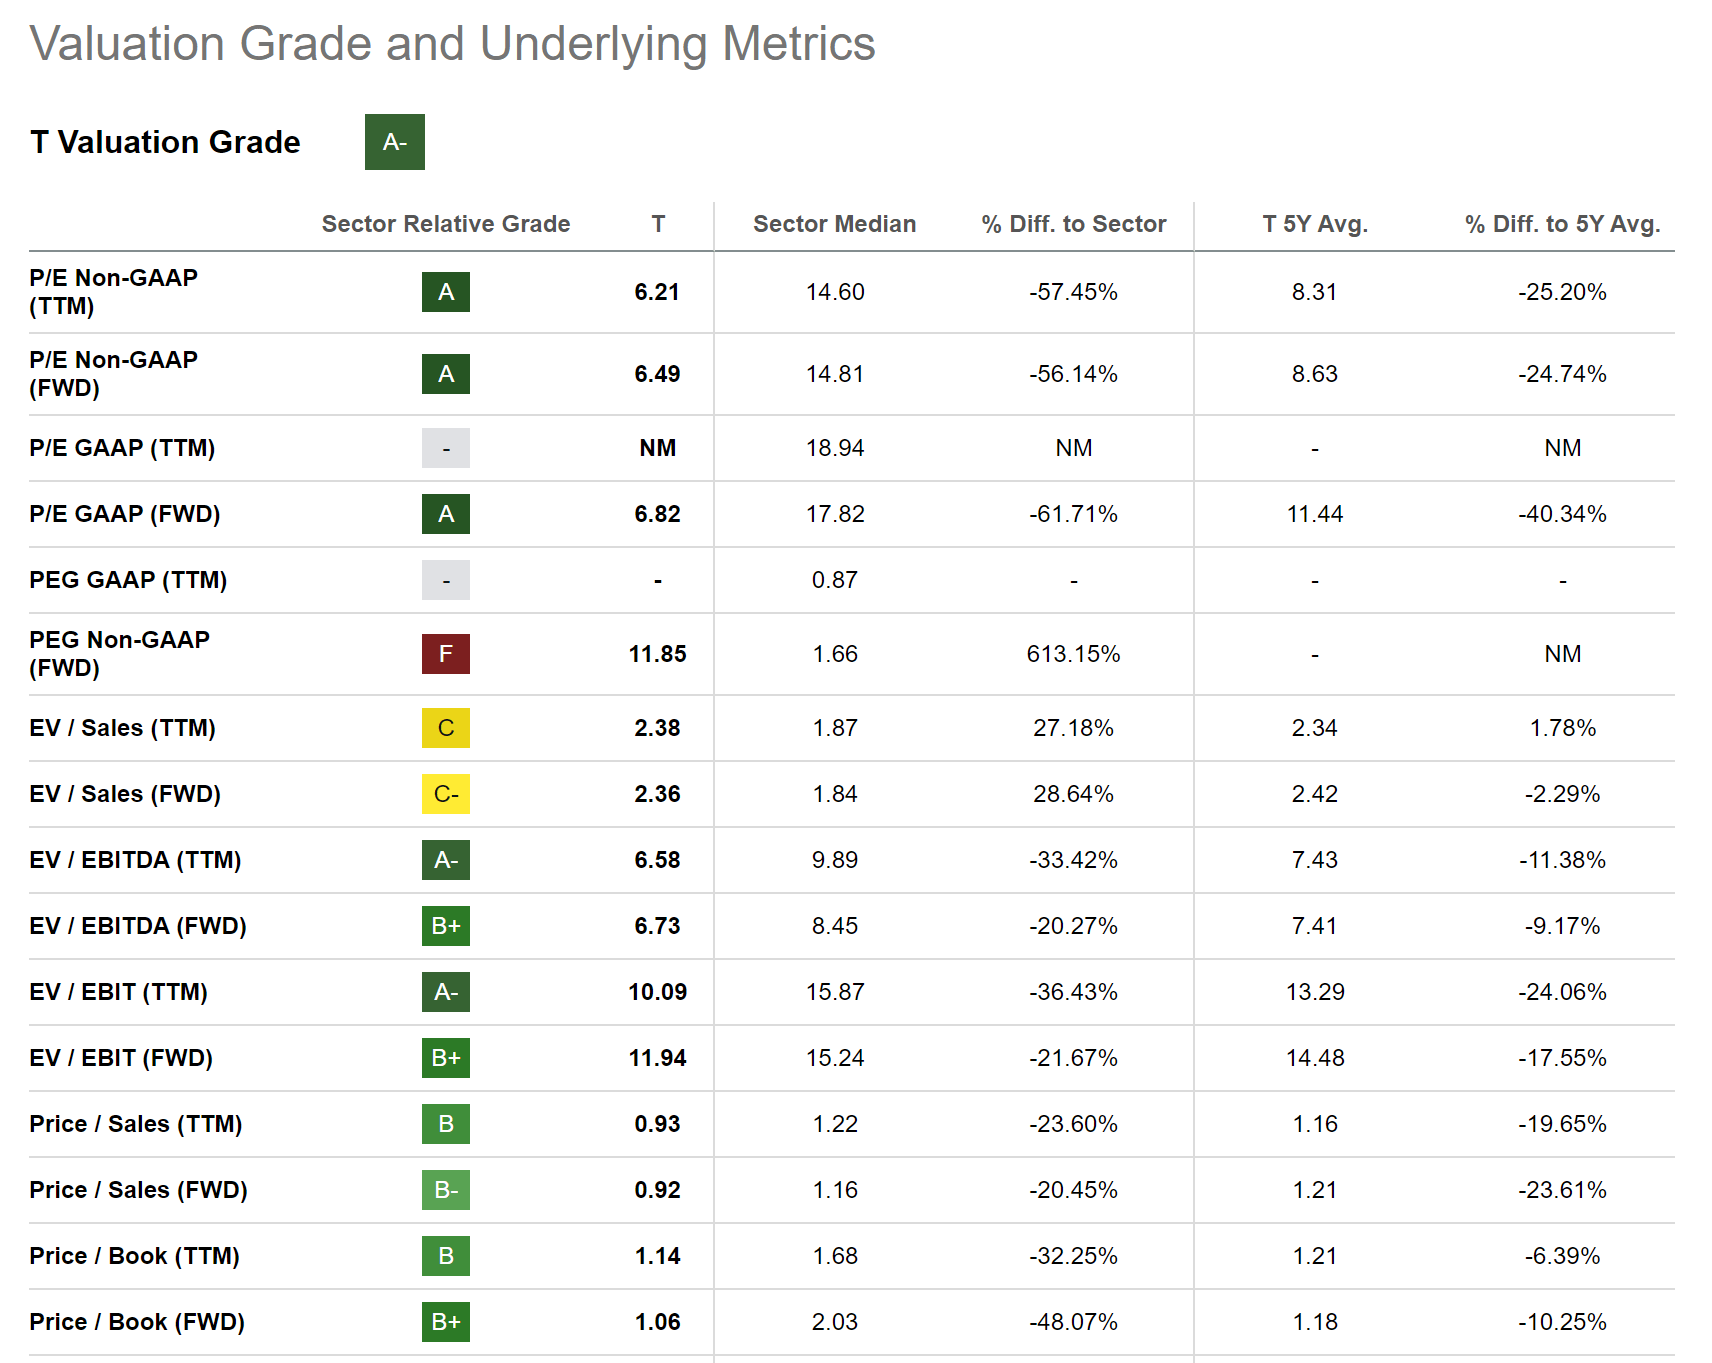
Source: Seeking Alpha
AT&T currently pays a Dividend Yield [FWD] of 7.03%, which shows that the company is particularly attractive for dividend income investors that aim to build extra income in the form of Dividends.
However, it is true that the company has limited growth perspectives (the company’s Average Revenue Growth Rate [YoY] over the past 5 years stands at 0.22%), and for this reason I suggest underweighting AT&T in your investment portfolio. This helps you decrease the risk level of your portfolio while increasing the probability of achieving excellent investment results over the long term.
The Bank of Nova Scotia
Over the past 12-month-period, The Bank of Nova Scotia has shown a Total Return of -18.02%, which has resulted in the bank currently having a P/E [FWD] Ratio of 9.53. Its current P/E [FWD] Ratio lies 5.89% below the bank’s Average over the past 5 years, indicating that the bank is undervalued at this moment of writing.
At the bank’s current stock price of $48.78, the Canadian bank pays its shareholders a Dividend Yield [FWD] of 6.37%. In addition to this attractive Dividend Yield, it is worth mentioning that the bank has shown a Dividend Growth Rate [CAGR] of 4.74% over the past 3 years, making me believe that it is one of these companies that can provide investors with an attractive mix between dividend income and dividend growth.
Furthermore, it is noteworthy to highlight that the bank has already shown 17 Consecutive Years of Dividend Payments, which can be interpreted as an additional indicator that shows that the bank is attractive for dividend income investors.
When compared to U.S. banks such as JPMorgan (NYSE: JPM ) or Bank of America (NYSE: BAC ), it can be stated that The Bank of Nova Scotia pays a significantly higher Dividend Yield. While the Canadian bank pays shareholders a Dividend Yield [FWD] of 6.37%, JPMorgan’s Dividend Yield [FWD] currently stands at 2.89%, and Bank of America’s at 3.14%.
However, it should be highlighted that these U.S. banks have a significantly lower Payout Ratio than their Canadian competitor: while JPMorgan’s Payout Ratio lies at 29.52%, Bank of America’s stands at 26.13%; The Bank of Nova Scotia’s Payout Ratio is 52.95%, indicating that its Dividend is less safe than the Dividend from the U.S. banks and that these U.S. banks have more room for future Dividend enhancements.
These U.S. banks have also shown higher Dividend Growth Rates in recent years: while The Bank of Nova Scotia’s Dividend Growth Rate [CAGR] over the past 5 years is 4.38%, JPMorgan’s is 12.91% and Bank of America’s is 12.89%, indicating that they could be the better picks in terms of Dividend Growth.
In my opinion, The Bank of Nova Scotia is also a great pick when considering Profitability: the bank has a Net Income Margin of 29.36%, which lies 13.61% above the Sector Median.
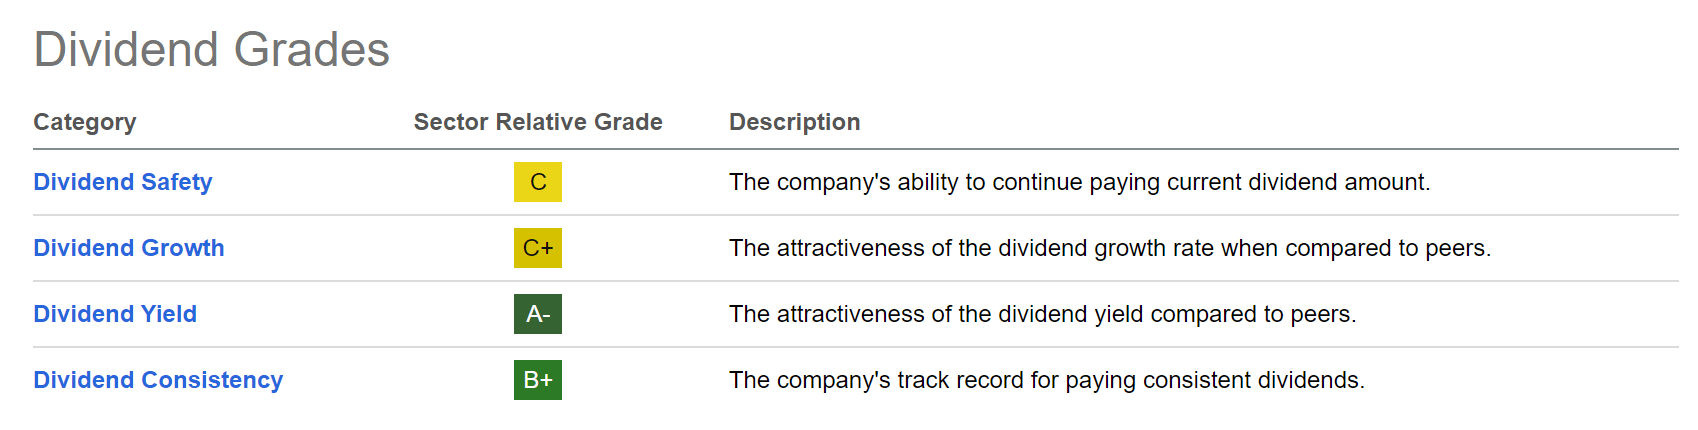
Below you can find the results of the Seeking Alpha Dividend Grades, which once again, confirm the bank’s attractive Dividend: The Bank of Nova Scotia receives an A- for Dividend Yield, a B+ for Dividend Consistency, a C+ for Dividend Growth, and a C for Dividend Safety.
Source: Seeking Alpha
United Parcel Services
United Parcel Services is also among these types of companies that combines a relatively high Dividend Yield with Dividend Growth, making it possible to earn an attractive Dividend Yield from today onwards, while being able to increase this amount at an attractive growth rate from year to year.
At this moment of writing, UPS pays a Dividend Yield [FWD] of 3.71%. The company’s Payout Ratio lies at 51.07%. Furthermore, it is worth mentioning that the company’s Dividend Growth Rate [CAGR] over the past 3 years is 16.81%, which is significantly above the Sector Median of 7.62%. This serves as an additional indicator that investors should not only benefit from the company’s relatively high Dividend Yield, but also from the fact that the company provides your portfolio with Dividend Growth.
I further believe that UPS is at least fairly valued: this is because its P/E [FWD] Ratio of 16.33 lies 14.01% below the Sector Median of 19.00. In addition to that, it only stands 1.53% above the company’s Average P/E [FWD] Ratio over the past 5 years, confirming its fair Valuation.
It is worth highlighting that UPS (P/E [FWD] Ratio of 16.33) has a slightly higher Valuation when compared to FedEx (NYSE: FDX ) (P/E [FWD] Ratio of 14.73), but its Valuation is significantly lower than the Valuation of Amazon (NASDAQ: AMZN ) (82.56) (due to the fact that Amazon expands more and more its logistics capabilities, they can be considered competitors in certain businesses). However, I see UPS as the most attractive pick for dividend income investors, which is based on the fact that it pays a Dividend Yield [FWD] of 3.71% while FedEx’s is 2.03% (Amazon does not pay a Dividend). However, I see FedEx slightly ahead of UPS when it comes to Dividend Growth: FedEx’s Dividend Growth Rate [CAGR] over the past 5 years is 23.99%, while UPS’ is 12.53%.
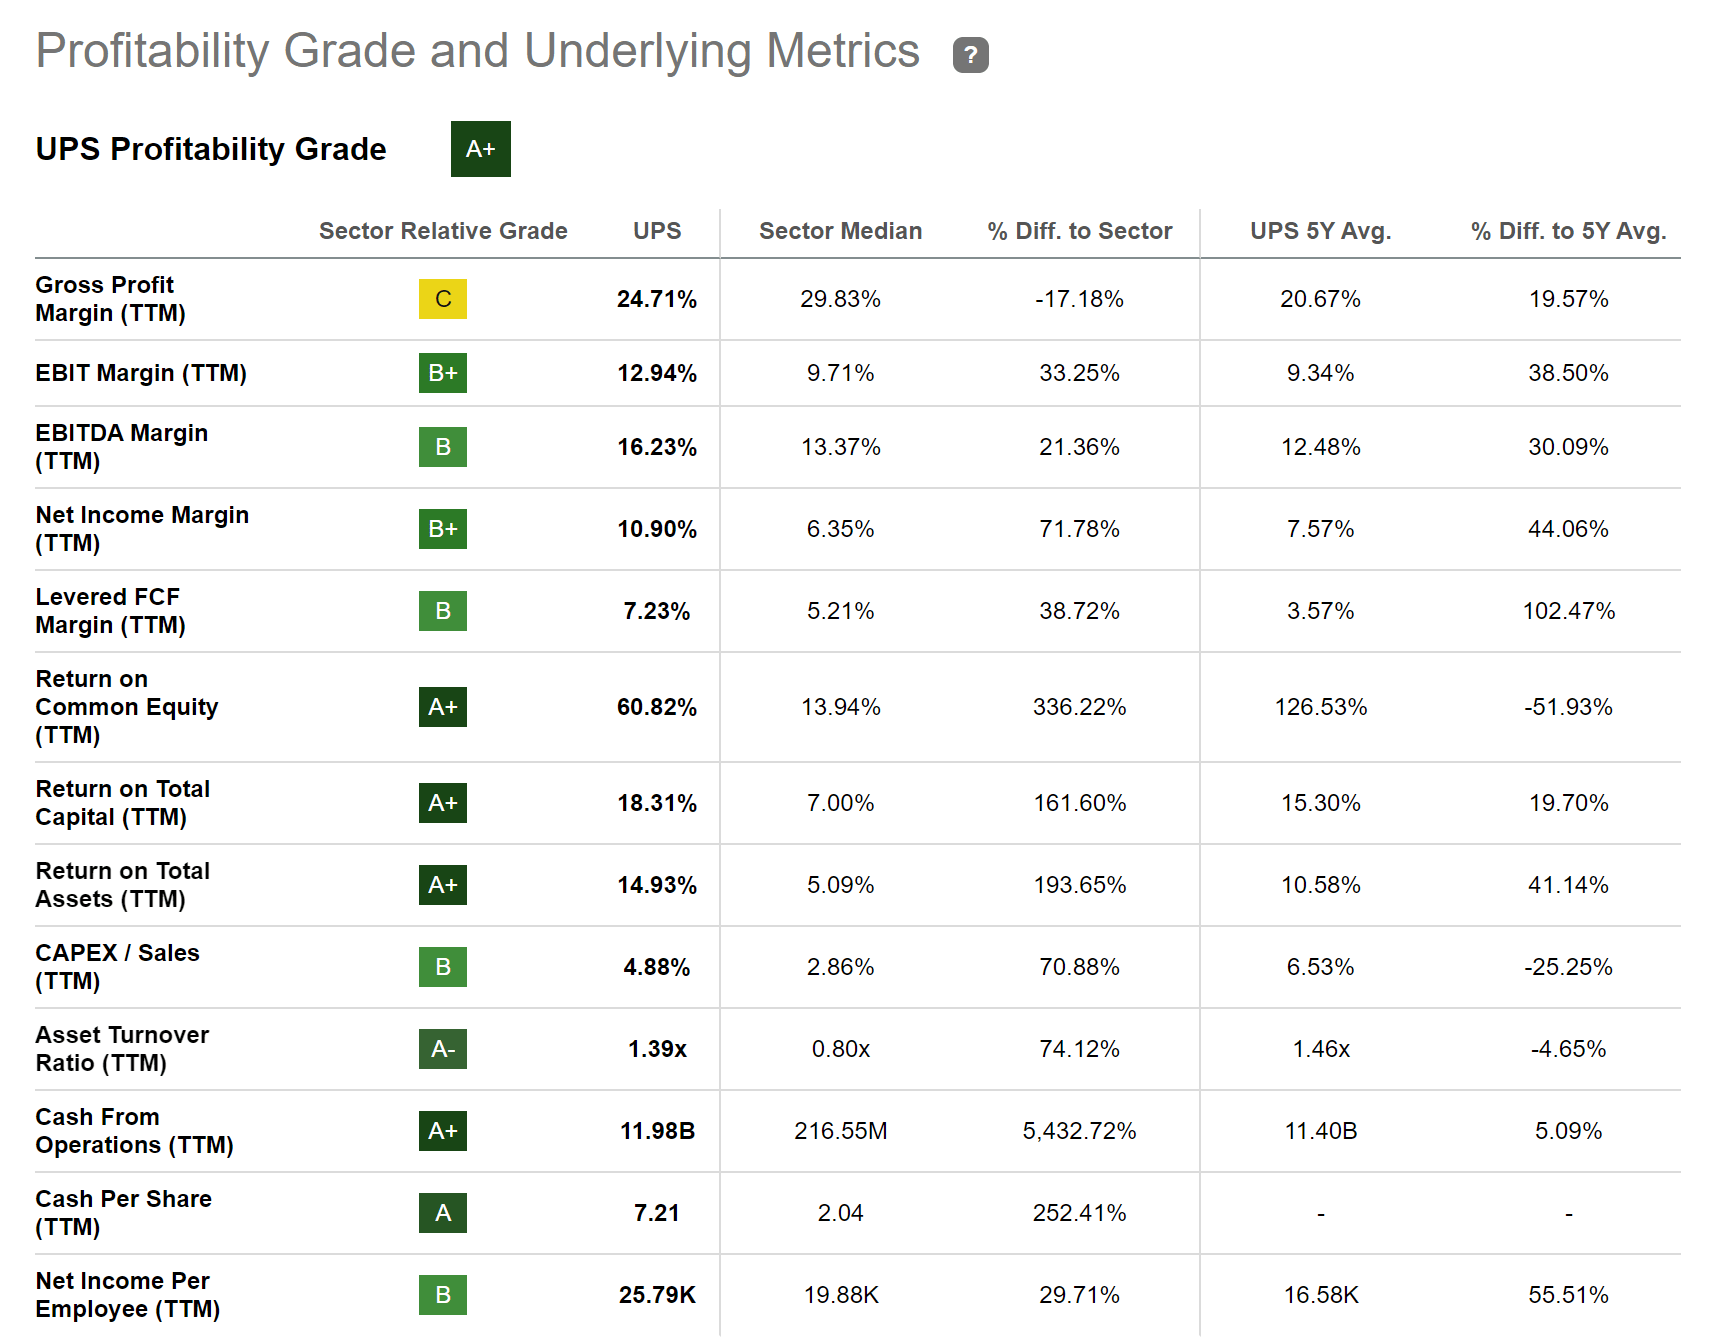
The Seeking Alpha Profitability Grade further strengthens my belief that the company possesses strong financial health: UPS has an EBIT Margin [TTM] of 12.94% and a Return on Equity [TTM] of 60.82%.
Source: Seeking Alpha
Verizon
Verizon was founded in 1983 and I also believe it has strong competitive advantages that prevent other companies from entering its business segment: to name just a few of them, Verizon has a strong brand reputation (it is ranked 8 th in the list of the most valuable brands in the world according to Brand Finance ), a strong network (due to its wireless and fiber-optic networks) and a broad customer base as well as a focus on innovation (which is also expressed by its 5G networks).
At today’s stock price of $36.72, Verizon pays its shareholders a Dividend Yield [FWD] of 7.09%, serving as an indicator that the company is attractive for dividend income investors. It is further worth mentioning that Verizon has shown a Dividend Growth Rate [CAGR] of 2.42% over the past 10 years, which demonstrates that investors should be able to increase their additional income in the form of dividends annually when investing in Verizon.
I consider this mix of Dividend Income and Dividend Growth very important for investors, since it helps investors become increasingly protected from stock market price fluctuations.
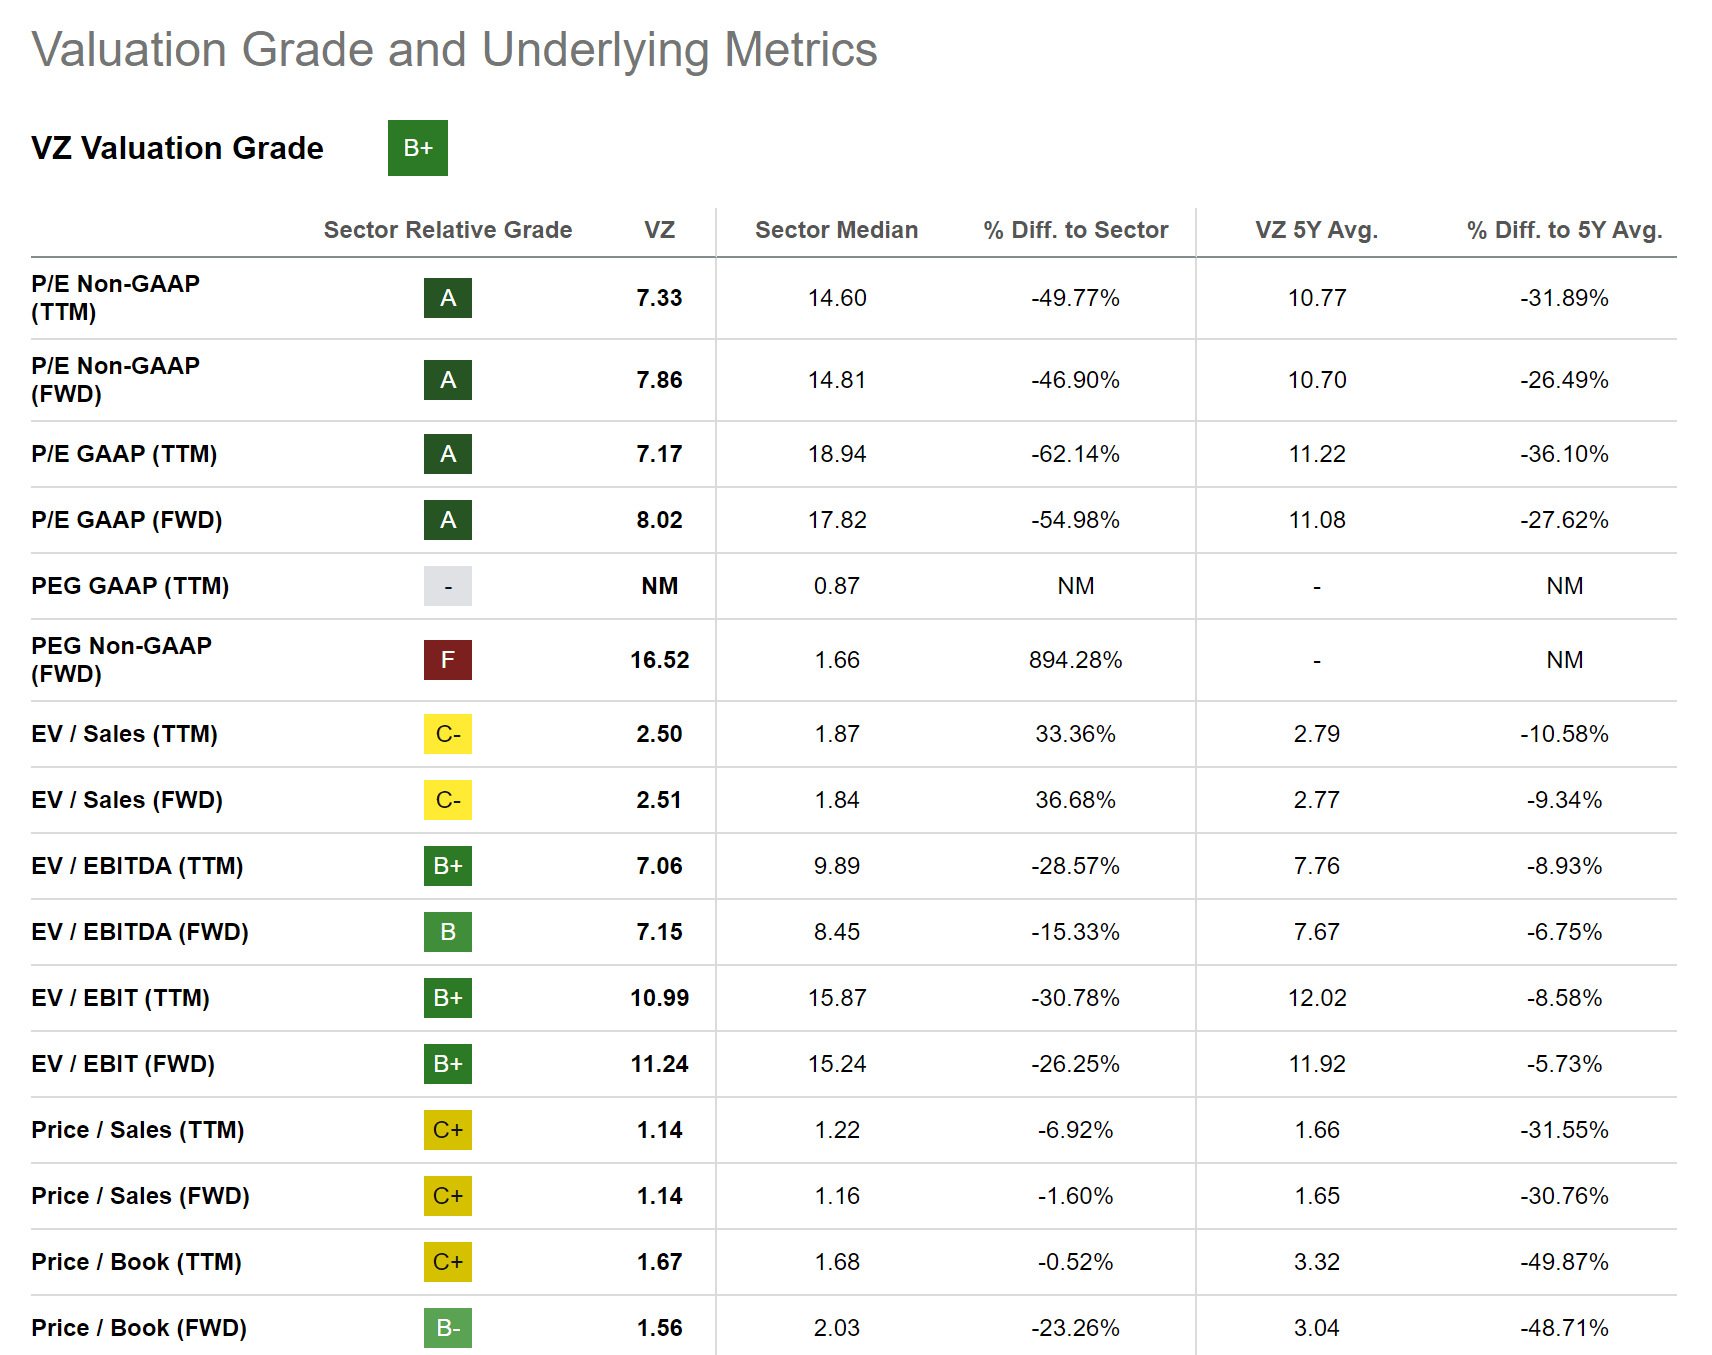
I further believe that Verizon is undervalued. My opinion is based on the fact that Verizon’s P/E [FWD] Ratio of 8.02 stands 54.98% below the Sector Median. It can also be highlighted that it lies 27.62% below its Average over the past 5 years.
Below you can find the Seeking Alpha Valuation Grade, which underlines my theory that Verizon is currently undervalued.
Source: Seeking Alpha
Conclusion
Implementing an investment strategy that aims to combine Dividend Income with Dividend Growth helps you become less affected by stock market price fluctuations.
The focus of this article was on companies that particularly provide your investment portfolio with an attractive Dividend Yield, helping you increase the Weighted Average Dividend Yield of your portfolio.
I consider these picks to currently be attractive in terms of Valuation, which is demonstrated by the fact that 8 out of the 10 selected companies currently have a P/E [FWD] Ratio below 10. Furthermore, they have strong competitive advantages and are financially healthy, raising my confidence that they can be attractive long-term investments.
With my investment analyses, I aim to help you build a diversified long-term investment portfolio with a reduced risk level that helps you generate extra income in the form of Dividends (combining Dividend Income with Dividend Growth) while prioritizing the pursuit of Total Return, encompassing both Capital Gains and Dividends.
Author’s Note: I would love to hear your opinion on my selection of high dividend yield companies to buy in July 2023. Do you already own or plan to acquire any of the picks? Which are currently your favorite high dividend yield companies? If you would like to receive a notification when I publish my next analysis, you can click the 'Follow' button.
For further details see:
My Top 10 High Dividend Yield Companies For July 2023